Home > Analyses > Financial Services > Upstart Holdings, Inc.
Upstart Holdings reshapes consumer lending by harnessing artificial intelligence to streamline loan approvals. Its cloud-based platform connects borrowers with AI-powered bank partners, reducing risk and expanding access to credit. Known for innovation and precision, Upstart stands out in the financial credit services sector. But as competition intensifies and valuation pressures mount, I ask: does Upstart’s growth potential still justify its current market price?

Table of contents
Business Model & Company Overview
Upstart Holdings, Inc. operates a cloud-based AI lending platform headquartered in San Mateo, California. Founded in 2012, it has cemented its role in the financial credit services sector by connecting consumer loan demand with a network of AI-enabled bank partners. This ecosystem leverages artificial intelligence to streamline lending, creating a cohesive, tech-driven approach to credit services.
The company’s revenue engine balances technology and finance by aggregating loan demand and enabling banks to underwrite smarter, faster loans across the United States. Its model thrives on recurring interactions between consumers and financial institutions. Upstart’s strategic focus in the U.S. market, combined with its AI-driven platform, forms a strong economic moat, positioning it as a disruptor shaping the future of lending.
Financial Performance & Fundamental Metrics
I analyze Upstart Holdings, Inc.’s income statement, financial ratios, and dividend payout policy to assess its core profitability and capital allocation efficiency.
Income Statement
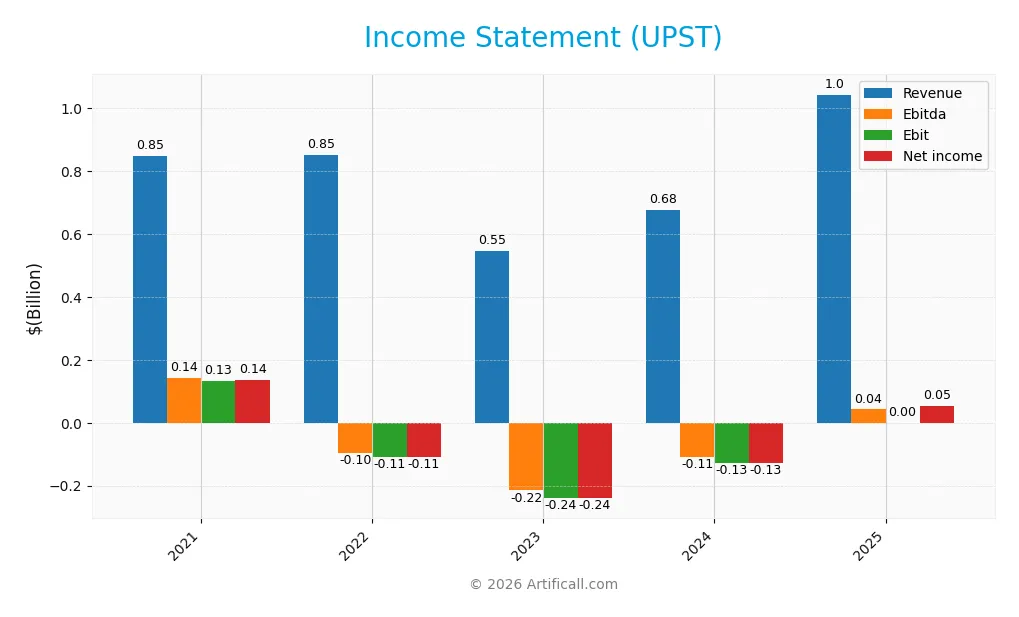
The table below summarizes Upstart Holdings, Inc.’s key income statement figures for fiscal years 2021 through 2025, reflecting revenue, expenses, and profitability metrics.
| 2021 | 2022 | 2023 | 2024 | 2025 | |
|---|---|---|---|---|---|
| Revenue | 850M | 853M | 548M | 677M | 1.04B |
| Cost of Revenue | 3.3M | 15.5M | 39.6M | 48.1M | 0 |
| Operating Expenses | 713M | 947M | 748M | 757M | 1.00B |
| Gross Profit | 847M | 838M | 508M | 629M | 0 |
| EBITDA | 141M | -96M | -215M | -108M | 43M |
| EBIT | 134M | -109M | -240M | -128M | 0 |
| Interest Expense | 3.3M | 10.8M | 34.9M | 48.1M | -31.7M |
| Net Income | 135M | -109M | -240M | -129M | 54M |
| EPS | 1.73 | -1.31 | -2.87 | -1.44 | 0.56 |
| Filing Date | 2022-02-18 | 2023-02-16 | 2024-02-15 | 2025-02-14 | 2026-02-10 |
Income Statement Evolution
Upstart’s revenue increased by 22.8% from 2021 to 2025, with a sharp 54.2% jump in the last year. Net income declined overall by 60.4%, despite a favorable 127% net margin growth in 2025. Gross profit turned unfavorable, collapsing to zero in 2025, while operating expenses scaled in line with revenue growth.
Is the Income Statement Favorable?
The 2025 income statement shows a clear rebound, with net income of $54M and a 5.13% net margin, both improving significantly year-over-year. Interest expense is well-controlled at 3.03% of revenue, supporting profitability. However, the absence of reported gross profit and zero EBIT margin raise questions about cost structure transparency. Overall, fundamentals appear generally favorable but warrant cautious monitoring.
Financial Ratios
The table below presents Upstart Holdings, Inc.’s key financial ratios for the fiscal years 2021 through 2025, offering a concise view of profitability, liquidity, leverage, and valuation metrics:
| Ratios | 2021 | 2022 | 2023 | 2024 | 2025 |
|---|---|---|---|---|---|
| Net Margin | 16% | -13% | -44% | -19% | 5% |
| ROE | 17% | -16% | -38% | -20% | 7% |
| ROIC | 8% | -6% | -12% | -6% | 5% |
| P/E | 87.3 | -10.1 | -14.3 | -42.8 | 78.3 |
| P/B | 14.6 | 1.63 | 5.39 | 8.70 | 5.26 |
| Current Ratio | 7.77 | 1.25 | 0.98 | 3.06 | 0 |
| Quick Ratio | 7.77 | 1.25 | 0.98 | 3.06 | 0 |
| D/E | 0.99 | 1.62 | 1.74 | 2.29 | 0 |
| Debt-to-Assets | 44% | 56% | 55% | 61% | 0 |
| Interest Coverage | 40.8 | -10.1 | -6.9 | -2.7 | -1.3 |
| Asset Turnover | 0.47 | 0.44 | 0.27 | 0.29 | 0.35 |
| Fixed Asset Turnover | 7.1 | 6.54 | 5.63 | 8.21 | 12.8 |
| Dividend Yield | 0% | 0% | 0% | 0% | 0% |
Evolution of Financial Ratios
Upstart Holdings’ Return on Equity (ROE) has improved from deeply negative values to a modest 6.7% in 2025, indicating a gradual recovery in profitability. The Current Ratio declined sharply to zero by 2025, signaling deteriorating liquidity. Debt-to-Equity Ratio fell to zero in 2025, reflecting a reduction in leverage or debt usage. Profitability remains weak but shows signs of stabilization.
Are the Financial Ratios Favorable?
In 2025, Upstart’s profitability ratios, including net margin (5.1%) and ROE (6.7%), are generally unfavorable compared to sector and market benchmarks. Liquidity ratios are critically weak, with both current and quick ratios at zero. Leverage ratios appear favorable, with no debt recorded. Asset turnover is low, but fixed asset turnover is strong. The overall ratio assessment is unfavorable, with 71% of ratios negative and only 21% positive.
Shareholder Return Policy
Upstart Holdings, Inc. does not pay dividends, reflecting its ongoing reinvestment strategy during a high growth phase. The company has no dividend payout ratio or yield, and lacks share buyback programs according to the latest data.
This approach aligns with prioritizing growth and R&D investments to build long-term shareholder value. The absence of distributions supports sustainable capital allocation, consistent with firms focusing on maximizing future returns over immediate payouts.
Score analysis
The following radar chart illustrates Upstart Holdings, Inc.’s key financial metric scores for a clear comparative view:
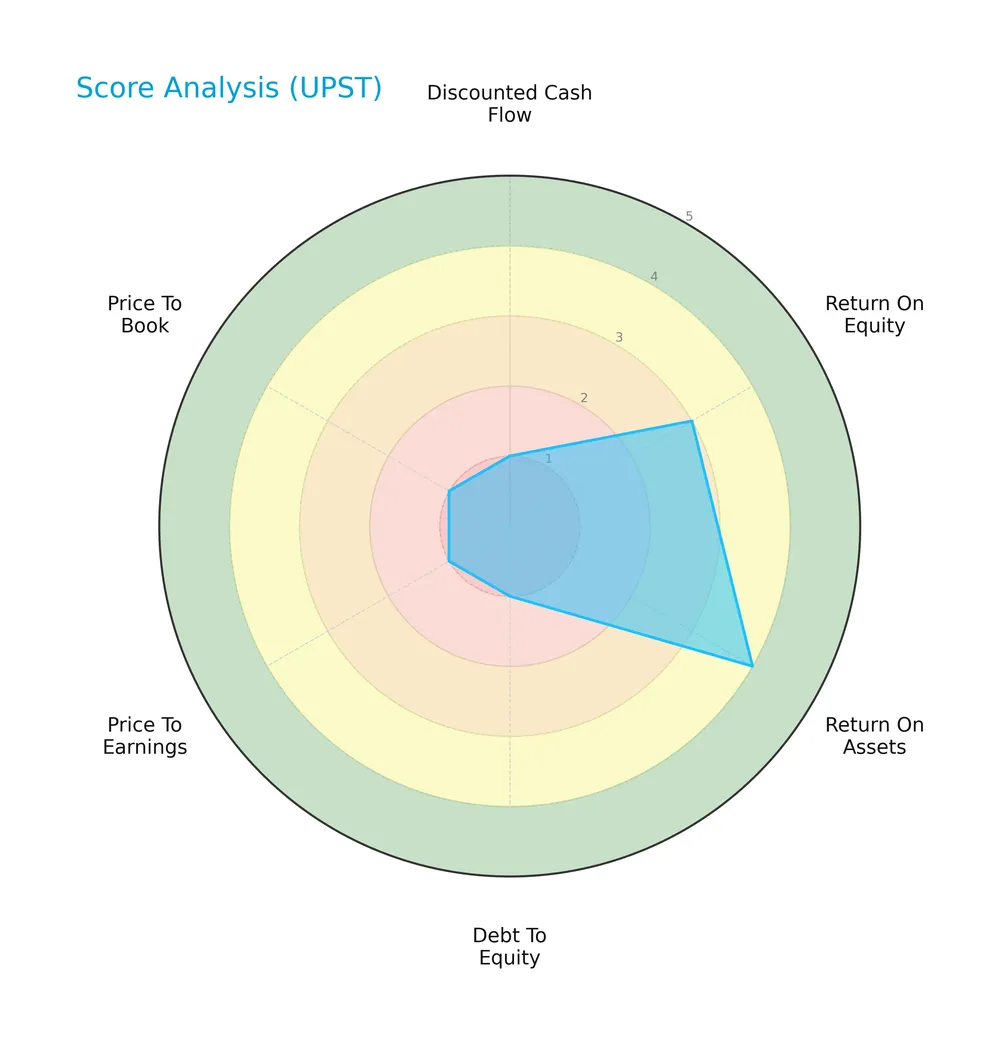
Upstart’s scores reveal a mixed financial profile. Return on assets scores favorably at 4, while return on equity is moderate at 3. However, discounted cash flow, debt to equity, price to earnings, and price to book scores are all very unfavorable at 1, dragging the overall score down to 2.
Analysis of the company’s bankruptcy risk
Upstart’s Altman Z-Score of 1.42 places it in the distress zone, signaling a high risk of financial distress and potential bankruptcy:

Is the company in good financial health?
The Piotroski Score diagram below provides insights into Upstart’s financial health, rated as average:

A Piotroski Score of 4 indicates moderate financial strength. This score suggests Upstart has some financial stability but lacks the robustness seen in stronger companies scoring 8 or above.
Competitive Landscape & Sector Positioning
This sector analysis reviews Upstart Holdings, Inc.’s strategic positioning, revenue segments, key products, and main competitors. I will assess whether Upstart holds a competitive advantage in the financial credit services industry.
Strategic Positioning
Upstart Holdings concentrates on a cloud-based AI lending platform within the US financial credit services sector. Its revenue streams focus on borrower and servicing fees, showing a specialized product portfolio with no geographic diversification beyond the United States.
Revenue by Segment
This pie chart illustrates Upstart Holdings, Inc.’s revenue breakdown by segment for the fiscal year 2025, highlighting the relative contributions of each fee category.
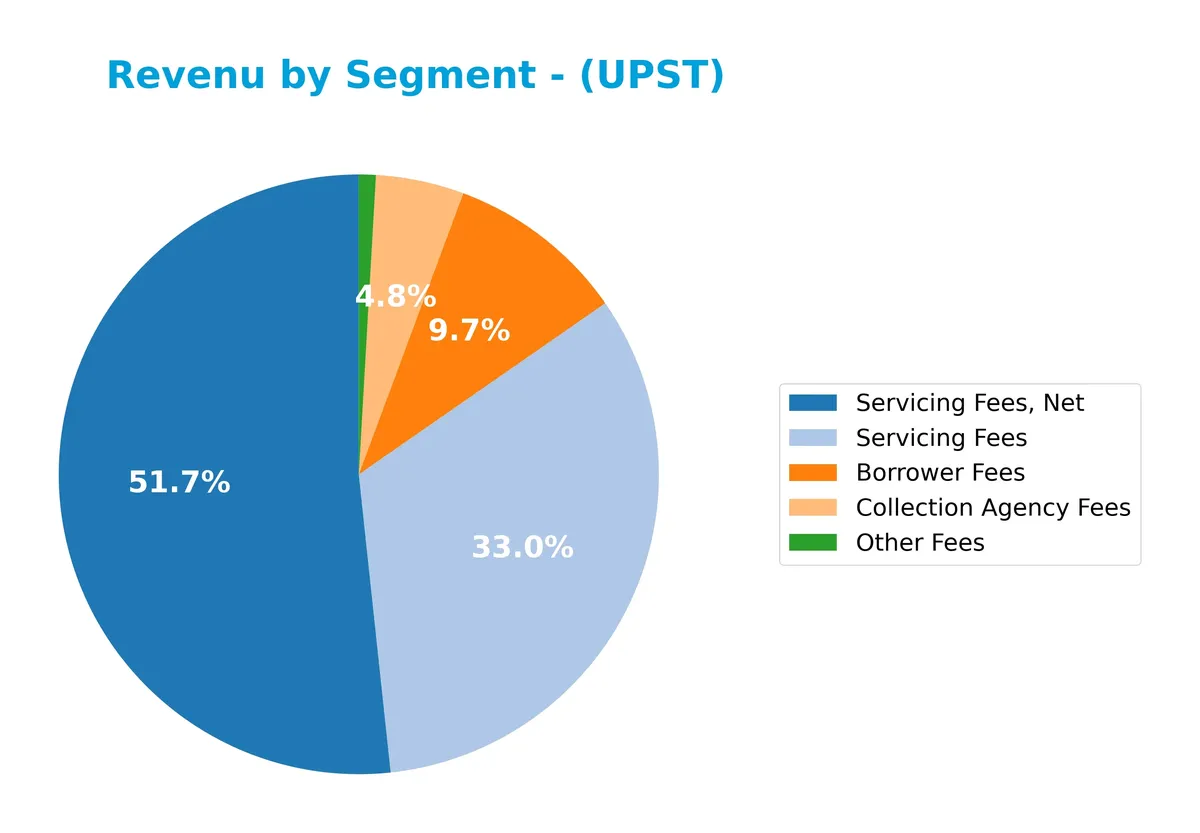
In 2025, Servicing Fees, Net dominate Upstart’s revenue at 157M, showing steady growth from 133M in 2024. Borrower Fees contribute a smaller but stable 29M, while Collection Agency Fees and Other Fees remain minor at 14M and 3M respectively. The absence of Platform and Referral Fees this year signals a notable shift in revenue composition, concentrating risk in servicing activities. This trend requires close monitoring for sustainability.
Key Products & Brands
Upstart Holdings, Inc. generates revenue primarily from the following product and fee categories:
| Product | Description |
|---|---|
| Platform and Referral Fees, Net | Fees earned by connecting consumers to AI-enabled bank partners via its cloud lending platform. |
| Servicing Fees, Net | Income from managing loan servicing activities, net of expenses. |
| Servicing Fees | Gross fees related to loan servicing before netting expenses. |
| Borrower Fees | Charges levied directly on borrowers for loan processing or other services. |
| Collection Agency Fees | Fees earned from collection activities on defaulted or delinquent loans. |
| Other Fees | Miscellaneous fees not categorized under the above segments. |
Upstart’s revenue mix reflects its AI-driven lending platform’s core role, supplemented by servicing and collection fees. Platform fees dominated early years, while servicing fees have grown more significant recently.
Main Competitors
Upstart Holdings, Inc. faces competition from 6 key players in the Financial – Credit Services industry. The table below lists the top 6 leaders by market capitalization:
| Competitor | Market Cap. |
|---|---|
| Visa Inc. | 672B |
| Mastercard Incorporated | 506B |
| American Express Company | 260B |
| Capital One Financial Corporation | 158B |
| PayPal Holdings, Inc. | 54B |
| Synchrony Financial | 32B |
No exact rank or relative market cap is available for Upstart Holdings, Inc. The company operates below both the average market cap of the top 10 competitors (280B) and the median sector market cap (209B). With only 6 competitors listed, Upstart’s scale is smaller than these leaders, and no data indicates its proximity to the next closest competitor.
Comparisons with competitors
Check out how we compare the company to its competitors:
Aucun article trouvé pour ces critères.
Does Upstart Holdings have a competitive advantage?
Upstart Holdings does not present a competitive advantage as its ROIC is significantly below WACC, indicating value destruction and declining profitability over 2021-2025. The company’s financial metrics reveal challenges in sustaining economic profits despite favorable revenue growth.
Looking ahead, Upstart’s cloud-based AI lending platform and network of bank partners offer expansion opportunities in the U.S. credit services market. Continued innovation and market penetration remain critical to reversing its unfavorable profitability trends.
SWOT Analysis
This SWOT analysis highlights Upstart Holdings’ key strategic factors to inform investment decisions.
Strengths
- strong revenue growth of 54% in 2025
- AI-driven lending platform with scalable tech
- zero debt and low financial leverage
Weaknesses
- declining ROIC well below WACC
- very unfavorable profitability trends
- high valuation multiples (PE 78x, PB 5.3x)
Opportunities
- expanding AI adoption in credit services
- growing consumer demand for alternative lending
- potential to improve margins with scale
Threats
- high beta indicating stock volatility
- intense competition in fintech sector
- regulatory risks in financial services
Upstart demonstrates robust growth and technological edge but suffers from value destruction and profitability challenges. The company must leverage AI innovation while addressing margin pressures and valuation risks to build a sustainable competitive advantage.
Stock Price Action Analysis
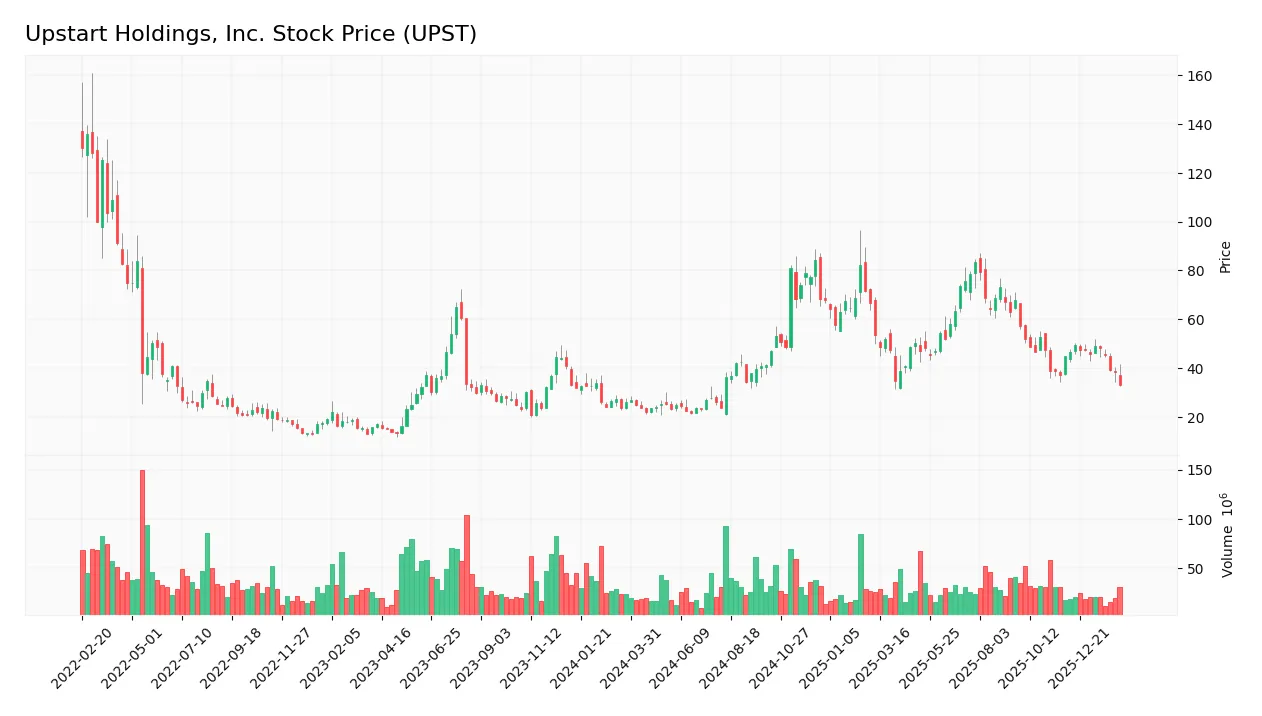
The weekly stock chart for Upstart Holdings, Inc. (UPST) highlights price fluctuations and key levels over the past 12 months:
Trend Analysis
Over the past 12 months, UPST’s stock price rose 27.31%, indicating a bullish trend. The highest price reached 84.46, the lowest was 21.64. Despite strong gains, the trend shows deceleration and volatility remains elevated with a 17.51 standard deviation.
Volume Analysis
Over the last three months, trading volume has decreased. Sellers dominate with 67.33% of activity, suggesting bearish sentiment and reduced market participation among buyers. This seller-driven volume reflects cautious investor behavior in recent weeks.
Target Prices
Analysts present a moderately optimistic target consensus for Upstart Holdings, Inc.
| Target Low | Target High | Consensus |
|---|---|---|
| 40 | 56 | 49.2 |
The target range from 40 to 56 suggests analysts expect a solid upside from the current price, with a consensus near 49.2 indicating balanced confidence.

Don’t Let Luck Decide Your Entry Point
Optimize your entry points with our advanced ProRealTime indicators. You’ll get efficient buy signals with precise price targets for maximum performance. Start outperforming now!
Analyst & Consumer Opinions
This section examines Upstart Holdings, Inc.’s recent analyst ratings alongside consumer feedback and satisfaction trends.
Stock Grades
The following table shows the latest verified grades for Upstart Holdings, Inc. from recognized analysts:
| Grading Company | Action | New Grade | Date |
|---|---|---|---|
| Truist Securities | Maintain | Buy | 2026-02-11 |
| Needham | Maintain | Buy | 2026-02-11 |
| JP Morgan | Maintain | Overweight | 2025-11-05 |
| Citigroup | Maintain | Buy | 2025-11-05 |
| Needham | Maintain | Buy | 2025-11-05 |
| BTIG | Maintain | Neutral | 2025-11-05 |
| Piper Sandler | Maintain | Overweight | 2025-11-05 |
| B of A Securities | Maintain | Neutral | 2025-11-05 |
| Stephens & Co. | Maintain | Equal Weight | 2025-11-05 |
| Goldman Sachs | Maintain | Sell | 2025-10-13 |
The consensus leans toward a Buy rating, reflecting steady confidence from multiple firms, though a few maintain Neutral or Sell stances. This mix indicates cautious optimism among analysts.
Consumer Opinions
Upstart Holdings, Inc. evokes mixed yet insightful reactions from its user base, reflecting its innovative approach and areas for growth.
| Positive Reviews | Negative Reviews |
|---|---|
| “Seamless loan approval process, very fast.” | “Customer service response times are slow.” |
| “AI-driven recommendations saved me money.” | “Some loan terms were confusing upfront.” |
| “Easy-to-use platform with clear interface.” | “Interest rates felt higher than expected.” |
Overall, consumers praise Upstart’s efficient, AI-powered lending platform and user-friendly design. However, recurring concerns include customer support delays and occasional unclear loan conditions, signaling areas for operational improvement.
Risk Analysis
The following table summarizes key risks facing Upstart Holdings, Inc., highlighting their likelihood and potential impact:
| Category | Description | Probability | Impact |
|---|---|---|---|
| Financial Health | Altman Z-Score signals distress zone, indicating bankruptcy risk | High | High |
| Profitability | Low ROE (6.71%) and ROIC (4.99%) below WACC (15.01%) | High | Medium |
| Valuation | Elevated P/E (78.35) and P/B (5.26) ratios suggest overvaluation | Medium | High |
| Liquidity | Current and quick ratios at zero raise severe short-term risk | High | High |
| Market Volatility | Beta of 2.386 indicates high stock price volatility | Medium | Medium |
| Debt Management | Zero debt levels reduce financial risk but limit leverage use | Low | Low |
The most pressing risks are liquidity shortfalls and financial distress signals. The zero current and quick ratios flag potential cash flow challenges. The Altman Z-Score below 1.8 strongly warns of bankruptcy risk. Coupled with high valuation multiples, these factors heighten vulnerability amid market volatility.
Should You Buy Upstart Holdings, Inc.?
Upstart Holdings, Inc. appears to be navigating a challenging phase with declining operational efficiency and a deteriorating moat reflected by negative ROIC trends. Despite a manageable leverage profile, its profitability remains weak, suggesting a cautious profile rated C overall.
Strength & Efficiency Pillars
Upstart Holdings, Inc. posts a modest net margin of 5.13%, signaling some operational profitability. However, its return on equity (6.71%) and return on invested capital (4.99%) both lag behind the weighted average cost of capital (15.01%), indicating value erosion rather than creation. The company’s interest expense is favorably low at -3.03%, which slightly cushions financial pressure. Overall, operational efficiency shows pockets of strength, but the firm struggles to generate returns above its capital cost.
Weaknesses and Drawbacks
The Altman Z-Score of 1.42 places Upstart in the Distress Zone, signaling a high risk of bankruptcy. This solvency risk dwarfs other financial metrics and demands caution. Additionally, valuations are stretched with a P/E of 78.35 and P/B of 5.26, reflecting a premium that may not be justified by fundamentals. Liquidity ratios are critically weak at zero, heightening short-term financial vulnerability. Recent trading is seller-dominant with only 32.67% buyer volume, adding near-term market pressure.
Our Final Verdict about Upstart Holdings, Inc.
Despite some operational profitability, the company’s Z-Score of 1.42 exposes a significant solvency threat, rendering the investment highly speculative. The risk of financial distress outweighs modest margin gains and recent bullish trends. Conservative investors should approach with extreme caution as the company’s balance sheet instability may lead to severe downside.
Disclaimer: This content is for informational purposes only and does not constitute financial, investment, or other professional advice. Investing in financial markets involves a significant risk of loss, and past performance is not indicative of future results.
Additional Resources
- Upstart Holdings, Inc. (UPST) Misses Q4 Earnings Estimates – Yahoo Finance (Feb 10, 2026)
- Upstart stock jumps after Q4 earnings, 2026 guidance impress (UPST:NASDAQ) – Seeking Alpha (Feb 10, 2026)
- Upstart Publishes Monthly Origination Volumes – Upstart (Feb 10, 2026)
- AI lender Upstart posts $53.6M profit, plans CEO handover to Paul Gu – Stock Titan (Feb 10, 2026)
- Upstart Stock Climbs After Q4 Earnings: Here’s Why – Benzinga (Feb 10, 2026)
For more information about Upstart Holdings, Inc., please visit the official website: upstart.com