Home > Analyses > Technology > Unity Software Inc.
Unity Software Inc. powers the immersive worlds behind games, apps, and virtual reality that millions engage with daily. Its real-time 3D content platform dominates the software application industry, enabling creators across mobile, console, and AR/VR devices to build interactive experiences. Renowned for innovation and broad market reach, Unity sets the standard for digital content creation. The critical question now: does Unity’s current financial footing and growth outlook justify its market valuation in 2026?
Table of contents
Business Model & Company Overview
Unity Software Inc., founded in 2004 and headquartered in San Francisco, CA, leads the software application industry with its interactive real-time 3D content platform. The company empowers creators—including developers, artists, and architects—to design and monetize 2D and 3D content across devices such as mobile phones, PCs, consoles, and AR/VR gear. This cohesive ecosystem supports a broad creative community, making Unity a cornerstone in digital content innovation.
Unity’s revenue engine balances software sales with recurring monetization services, driving growth in diverse markets across the Americas, Europe, and Asia. Its platform’s scalability and versatility underpin strong global adoption, supplemented by direct sales and distributor channels. Unity’s substantial economic moat lies in its entrenched network effect and indispensable role in shaping the future of interactive digital experiences worldwide.
Financial Performance & Fundamental Metrics
I analyze Unity Software Inc.’s income statement, key financial ratios, and dividend payout policy to uncover its core strengths and risks.
Income Statement
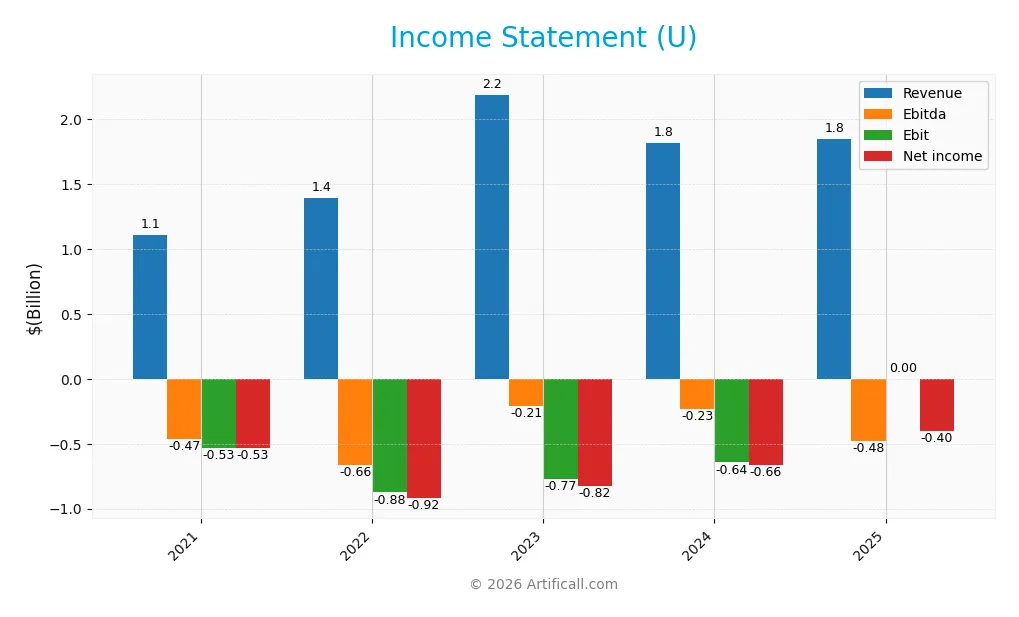
The table below presents Unity Software Inc.’s income statement for fiscal years 2021 through 2025, detailing revenue, expenses, and profitability metrics in USD.
| 2021 | 2022 | 2023 | 2024 | 2025 | |
|---|---|---|---|---|---|
| Revenue | 1.11B | 1.39B | 2.19B | 1.81B | 1.85B |
| Cost of Revenue | 254M | 443M | 734M | 481M | 478M |
| Operating Expenses | 1.39B | 1.83B | 2.29B | 2.09B | 1.85B |
| Gross Profit | 857M | 949M | 1.45B | 1.33B | 1.37B |
| EBITDA | -466M | -663M | -209M | -235M | -479M |
| EBIT | -530M | -875M | -773M | -644M | 0 |
| Interest Expense | 1.13M | 7.40M | 24.58M | 23.54M | 24.01M |
| Net Income | -533M | -919M | -822M | -664M | -403M |
| EPS | -1.89 | -2.96 | -2.16 | -1.68 | -0.96 |
| Filing Date | 2022-02-22 | 2023-02-27 | 2024-02-29 | 2025-02-21 | 2026-02-11 |
Income Statement Evolution
Unity Software’s revenue grew 67% from 2021 to 2025, with a modest 2% increase in the last year. Gross profit margins remained strong above 70%, reflecting stable cost control. Operating losses narrowed significantly in 2025, doubling EBIT from negative $755M in 2024 to approximately zero, indicating improving operational efficiency.
Is the Income Statement Favorable?
In 2025, Unity reported $1.85B revenue and a net loss of $403M, narrowing sharply from prior years. Gross margin held at a favorable 74%, while EBIT margin reached breakeven, a notable improvement. Interest expense remained low at 1.3% of revenue. Despite negative net margin of -21.8%, overall fundamentals show progress, with earnings growth and margin expansion signaling a cautiously favorable outlook.
Financial Ratios
The table below summarizes key financial ratios for Unity Software Inc. over the past five fiscal years, revealing trends in profitability, leverage, liquidity, and valuation:
| Ratios | 2021 | 2022 | 2023 | 2024 | 2025 |
|---|---|---|---|---|---|
| Net Margin | -48% | -66% | -38% | -37% | -22% |
| ROE | -22% | -26% | -26% | -21% | -12% |
| ROIC | -13% | -13% | -13% | -13% | -8% |
| P/E | -76 | -10 | -19 | -13 | -46 |
| P/B | 17 | 3 | 5 | 3 | 6 |
| Current Ratio | 3.44 | 2.34 | 2.60 | 2.50 | 1.84 |
| Quick Ratio | 3.44 | 2.34 | 2.60 | 2.50 | 1.84 |
| D/E | 0.76 | 0.77 | 0.85 | 0.74 | 0.69 |
| Debt-to-Assets | 38% | 35% | 37% | 35% | 33% |
| Interest Coverage | -470 | -119 | -34 | -32 | 20 |
| Asset Turnover | 0.23 | 0.18 | 0.30 | 0.27 | 0.27 |
| Fixed Asset Turnover | 10.5 | 11.4 | 15.5 | 18.3 | 27.1 |
| Dividend Yield | 0% | 0% | 0% | 0% | 0% |
Evolution of Financial Ratios
From 2021 to 2025, the current ratio steadily declined from 3.44 to 1.84, indicating reduced liquidity but still above 1. The debt-to-equity ratio remained fairly stable around 0.7, suggesting consistent leverage. Return on equity worsened from -22.24% in 2021 to -12.44% in 2025, showing some improvement but persistent unprofitability.
Are the Financial Ratios Favorable?
In 2025, profitability metrics such as net margin (-21.78%) and ROIC (-8.16%) remain unfavorable, reflecting ongoing losses. Liquidity ratios like current and quick ratios are favorable at 1.84, showing adequate short-term asset coverage. Leverage is neutral with a debt-to-equity of 0.69. Efficiency is mixed; fixed asset turnover is favorable at 27.1, while asset turnover at 0.27 is weak. Overall, the financial ratios portray an unfavorable profile.
Shareholder Return Policy
Unity Software Inc. does not pay dividends, reflecting its negative net income and focus on reinvestment. The company also does not engage in share buybacks, consistent with its high-growth phase and prioritization of expanding operations over shareholder distributions.
This approach aligns with long-term value creation by emphasizing growth and development rather than immediate returns. However, investors should monitor profitability improvements to assess when distributions might become sustainable without compromising financial health.
Score analysis
The radar chart below illustrates Unity Software Inc.’s key financial scores, highlighting strengths and weaknesses across valuation and profitability metrics:
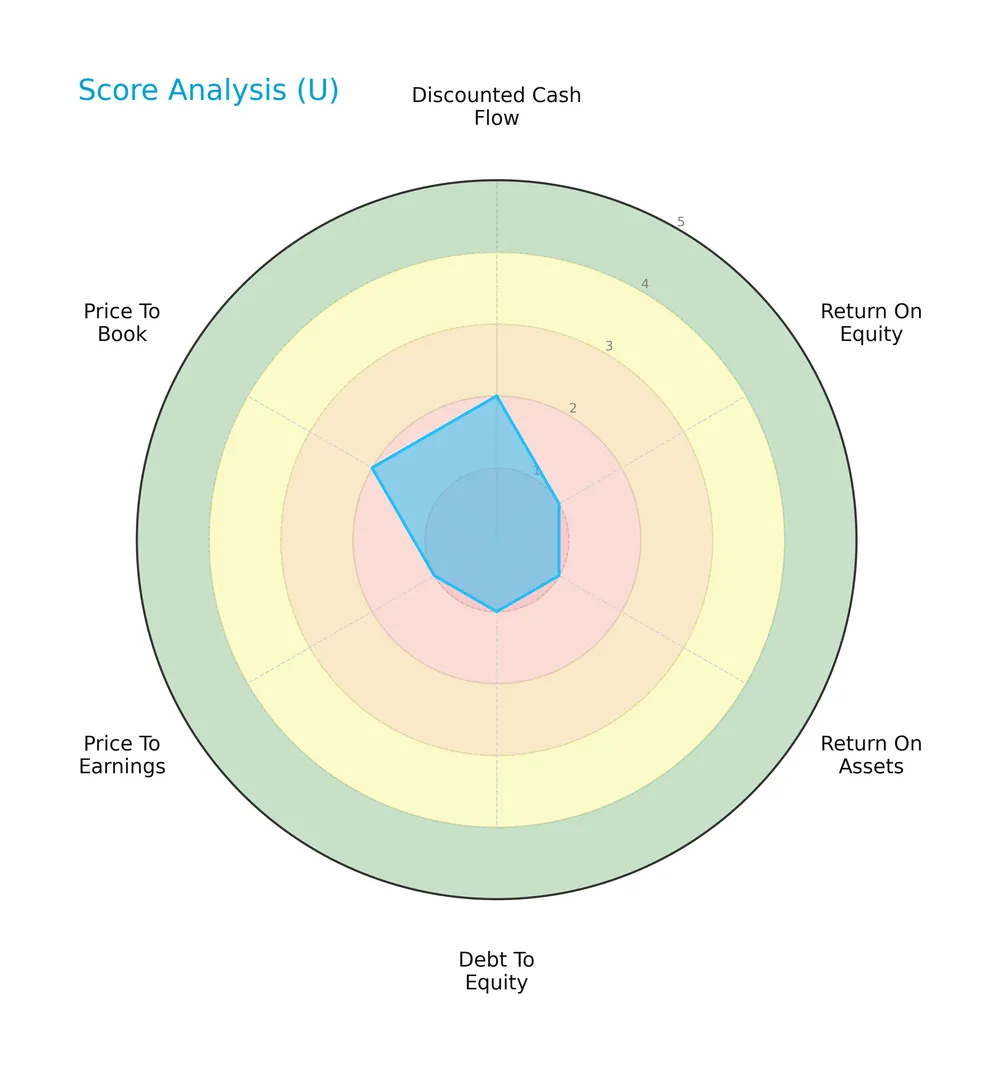
Unity Software’s scores reveal generally weak profitability and leverage metrics. Return on equity, assets, debt to equity, and price-to-earnings all score very unfavorably at 1. Discounted cash flow and price-to-book scores are slightly better but still unfavorable at 2.
Analysis of the company’s bankruptcy risk
Unity Software’s Altman Z-Score places it in the distress zone, indicating a high risk of financial distress and bankruptcy:
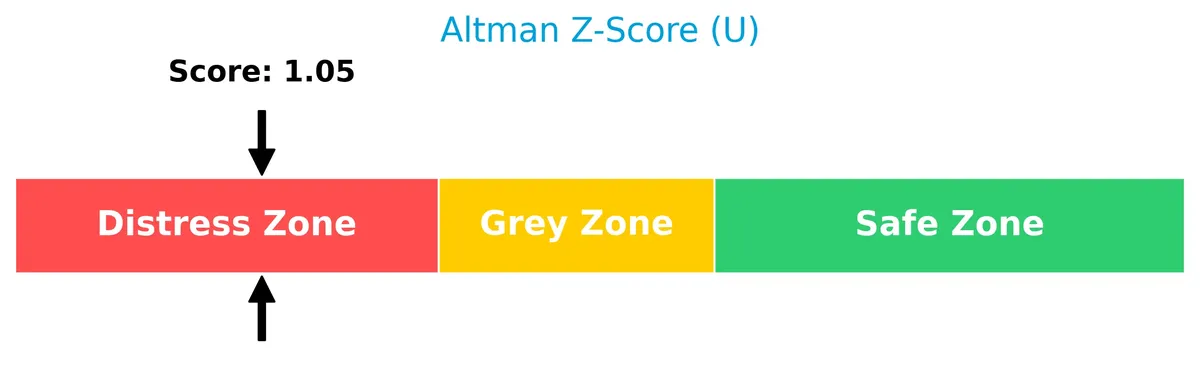
Is the company in good financial health?
The Piotroski Score diagram below represents Unity Software’s financial strength based on nine accounting criteria:
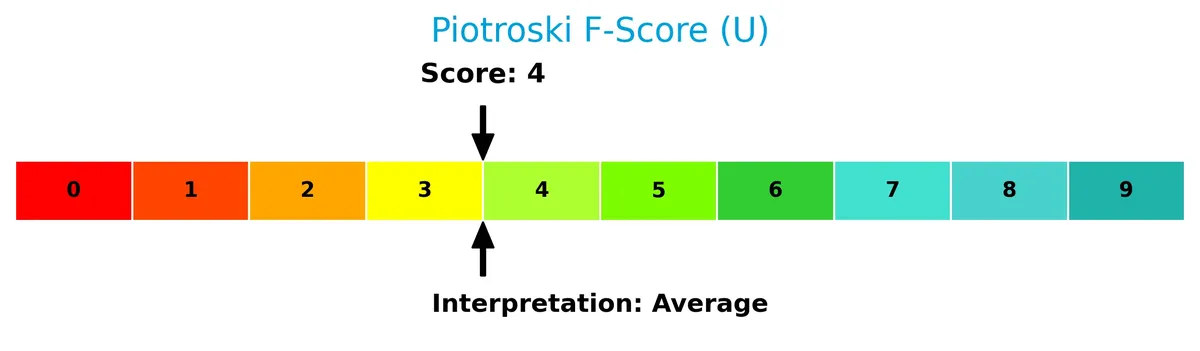
With a Piotroski Score of 4, Unity Software shows average financial health. This score suggests moderate operational efficiency and financial stability but leaves room for improvement.
Competitive Landscape & Sector Positioning
This section analyzes Unity Software Inc.’s strategic positioning, revenue segments, key products, and main competitors. I will examine whether Unity holds a competitive advantage within its software application sector.
Strategic Positioning
Unity Software Inc. concentrates its product portfolio on Create and Grow/Operate Solutions, generating roughly $1.9B in combined revenue for 2025. Geographically, it maintains broad exposure with significant sales in the US ($518M), EMEA ($601M), and Asia Pacific ($349M), reflecting a balanced global footprint.
Revenue by Segment
The pie chart illustrates Unity Software Inc.’s revenue distribution by segment for fiscal year 2025, highlighting Create Solutions and Grow Solutions as key contributors.
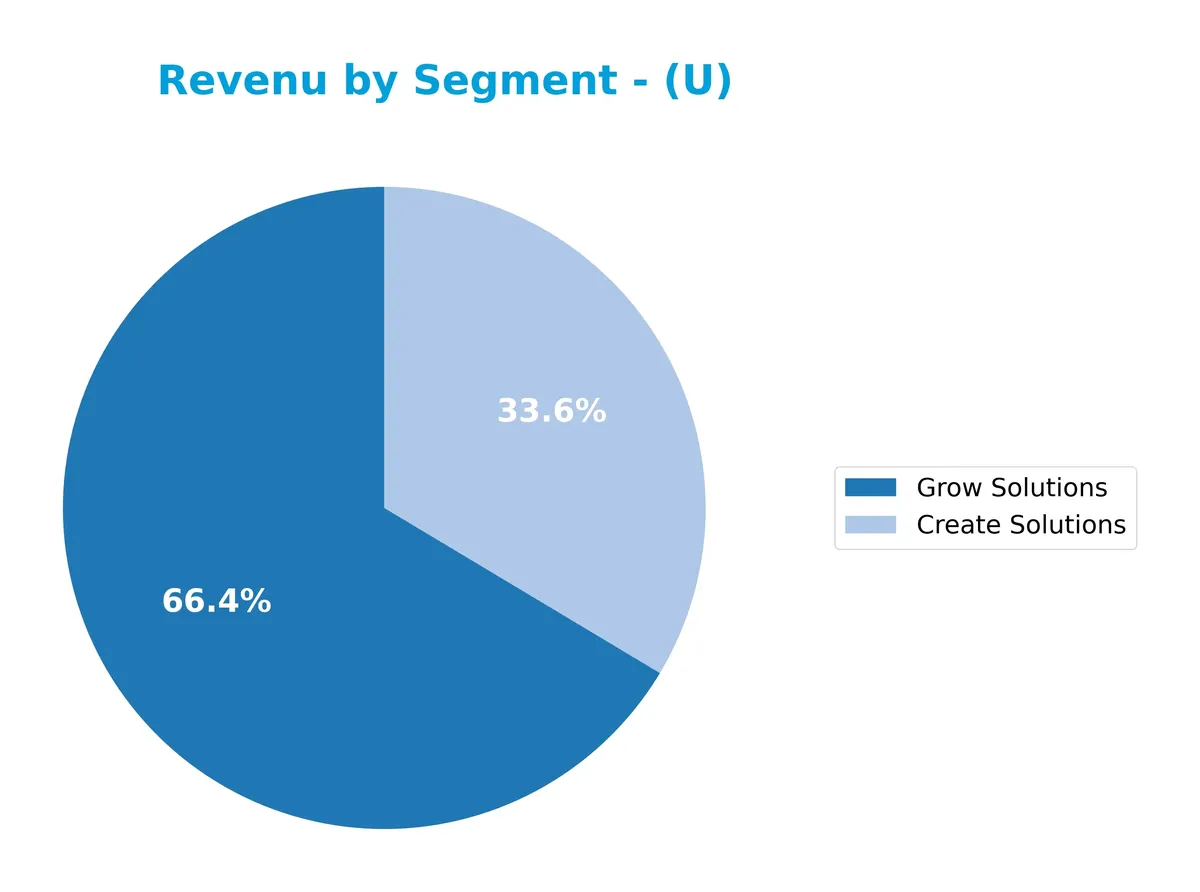
In 2025, Grow Solutions leads with $1.23B, surpassing Create Solutions at $621M. This marks a strategic shift from previous years where Operate Solutions dominated. The emergence of Grow Solutions signals a pivot towards expanding user engagement and monetization, while Create Solutions maintains steady growth. The data suggests Unity is diversifying income streams, though the concentration in two segments highlights some risk if market dynamics shift.
Key Products & Brands
The table below summarizes Unity Software Inc.’s primary products and their business roles:
| Product | Description |
|---|---|
| Create Solutions | Software tools enabling developers and creators to build interactive, real-time 2D and 3D content. |
| Operate Solutions | Services and platforms to run and monetize interactive content across multiple devices and applications. |
| Grow Solutions | Solutions focused on expanding user engagement and monetization capabilities within the interactive content. |
Unity Software’s product suite centers on content creation and monetization. Create Solutions drives initial development, while Operate and Grow Solutions support scaling and revenue generation. This segmentation reflects a comprehensive platform approach.
Main Competitors
Unity Software Inc. faces competition from 33 companies in its sector, with the table below showing the top 10 leaders by market capitalization:
| Competitor | Market Cap. |
|---|---|
| Salesforce, Inc. | 242B |
| Shopify Inc. | 210B |
| AppLovin Corporation | 209B |
| Intuit Inc. | 175B |
| Uber Technologies, Inc. | 172B |
| ServiceNow, Inc. | 153B |
| Cadence Design Systems, Inc. | 84B |
| Snowflake Inc. | 73B |
| Autodesk, Inc. | 61B |
| Workday, Inc. | 55B |
Unity Software Inc. ranks 16th among 33 competitors, with a market cap just 3.78% that of Salesforce, the sector leader. The company sits below both the average market cap of the top 10 (143.6B) and the sector median (18.8B). It holds a substantial 122.81% market cap gap to the next competitor above, indicating a significant size difference with its closest rival.
Comparisons with competitors
Check out how we compare the company to its competitors:
Does Unity Software Inc. have a competitive advantage?
Unity Software Inc. shows a slightly unfavorable competitive advantage as its ROIC is below WACC, indicating value destruction despite growing profitability. Its gross margin stands strong at 74%, yet net margin remains negative at -22%.
Looking ahead, Unity targets expansion through its interactive real-time 3D content platform across mobile, PC, consoles, and AR/VR devices. Growth opportunities exist in Asia Pacific and Greater China markets, supported by steady revenue gains and product innovation.
SWOT Analysis
This SWOT analysis identifies Unity Software Inc.’s core strategic factors to guide investment decisions.
Strengths
- strong gross margin at 74%
- growing ROIC trend
- global platform reach across multiple markets
Weaknesses
- negative net margin of -22%
- ROIC below WACC indicating value destruction
- unfavorable profitability ratios (ROE, net margin)
Opportunities
- expanding AR/VR market demand
- increasing adoption in emerging markets
- potential for operational leverage improvements
Threats
- high beta signaling volatility
- intense software industry competition
- technological disruption risks
Unity’s solid margin and expanding profitability metrics contrast with persistent losses and value destruction. The company must leverage growth opportunities while managing financial risks and competitive pressures.
Stock Price Action Analysis
The weekly stock chart for Unity Software Inc. (ticker U) illustrates price movements over the past 100 weeks, highlighting key volatility and trend shifts:
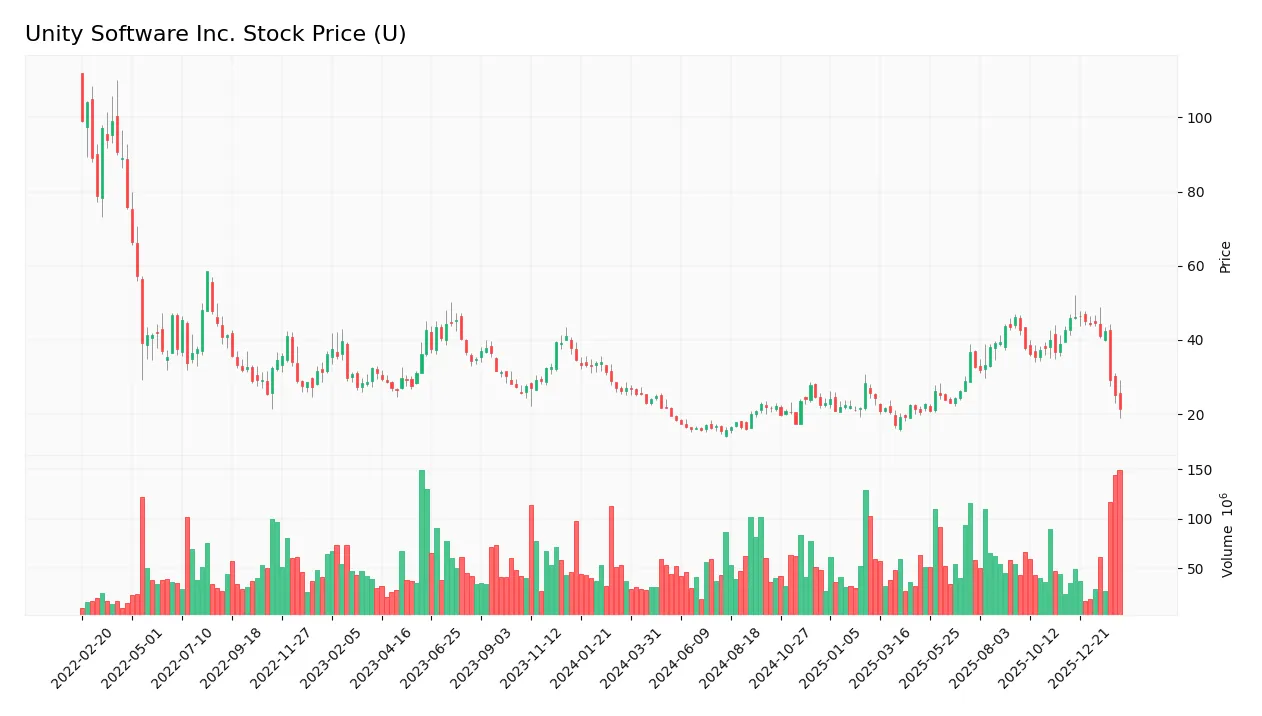
Trend Analysis
Over the past 12 months, Unity’s stock price declined by 20.67%, indicating a bearish trend. Price volatility is moderate, with a 9.18 standard deviation. The stock peaked at 46.42 and bottomed at 15.32, showing deceleration in bearish momentum.
Volume Analysis
In the last three months, trading volumes increased but remain seller-dominant, with buyers accounting for only 28.5%. This suggests cautious investor sentiment, with sellers exerting stronger pressure amid rising market participation.
Target Prices
Analysts set a target consensus of $44.75 for Unity Software Inc.
| Target Low | Target High | Consensus |
|---|---|---|
| 29 | 60 | 44.75 |
The range from $29 to $60 reflects varied optimism, with a moderate consensus suggesting cautious growth expectations.

Don’t Let Luck Decide Your Entry Point
Optimize your entry points with our advanced ProRealTime indicators. You’ll get efficient buy signals with precise price targets for maximum performance. Start outperforming now!
Analyst & Consumer Opinions
This section reviews analyst grades and consumer feedback to provide an overview of Unity Software Inc.’s market perception.
Stock Grades
Here are the latest verified analyst grades for Unity Software Inc., illustrating diverse opinions across top firms:
| Grading Company | Action | New Grade | Date |
|---|---|---|---|
| Needham | Maintain | Buy | 2026-02-11 |
| UBS | Maintain | Neutral | 2026-02-10 |
| Oppenheimer | Upgrade | Outperform | 2026-02-10 |
| Goldman Sachs | Maintain | Neutral | 2026-01-13 |
| Morgan Stanley | Maintain | Overweight | 2026-01-13 |
| Wells Fargo | Maintain | Overweight | 2026-01-08 |
| Jefferies | Maintain | Buy | 2026-01-05 |
| Piper Sandler | Upgrade | Overweight | 2025-12-11 |
| BTIG | Upgrade | Buy | 2025-12-11 |
| Wells Fargo | Upgrade | Overweight | 2025-12-05 |
The overall trend shows a strong bias toward positive outlooks, with multiple upgrades to Overweight and Outperform grades. The consensus leans clearly toward a Buy rating, reflecting growing confidence among analysts.
Consumer Opinions
Consumer sentiment around Unity Software Inc. reveals a mix of enthusiasm for its innovation and frustration with certain user experience issues.
| Positive Reviews | Negative Reviews |
|---|---|
| “Unity’s platform offers unmatched flexibility for developers.” | “Occasional bugs disrupt workflow during critical projects.” |
| “Strong community support boosts learning and troubleshooting.” | “Pricing can be steep for smaller studios and freelancers.” |
| “Regular updates introduce valuable new features and improvements.” | “The learning curve is steep for beginners.” |
Overall, users praise Unity’s innovative tools and active community. However, they flag pricing and technical glitches as persistent concerns, impacting smaller developers more significantly.
Risk Analysis
Below is a summary of key risks facing Unity Software Inc., highlighting their likelihood and potential impact:
| Category | Description | Probability | Impact |
|---|---|---|---|
| Financial Health | Low Altman Z-Score (1.05) signals high bankruptcy risk | High | High |
| Profitability | Negative net margin (-21.78%) and ROIC (-8.16%) | High | High |
| Market Volatility | High beta (2.09) increases stock price sensitivity | High | Medium |
| Leverage | Moderate debt-to-assets (32.7%) with weak interest coverage | Medium | Medium |
| Valuation | High price-to-book (5.74) suggests overvaluation risk | Medium | Medium |
| Competitive Risk | Rapid innovation in software sector demands constant upgrades | Medium | High |
| Liquidity | Strong current and quick ratios (1.84) reduce short-term risk | Low | Low |
Unity’s most pressing risks stem from its distressed financial condition and unprofitable operations. The Altman Z-Score firmly places it in the distress zone, signaling a material bankruptcy threat. Its negative ROIC versus a high WACC highlights poor capital allocation. Meanwhile, the stock’s high beta exposes investors to amplified market swings, especially amid sector volatility. These factors require cautious monitoring despite adequate liquidity.
Should You Buy Unity Software Inc.?
Unity Software Inc. appears to be shedding value despite improving profitability, suggesting a slightly unfavorable competitive moat. While its leverage profile remains challenging, the company’s overall rating of C- indicates considerable financial risks amid modest operational efficiency.
Strength & Efficiency Pillars
Unity Software Inc. shows operational resilience with a strong gross margin of 74.17%, reflecting robust core profitability. Interest expense remains favorable at -1.3%, indicating manageable financing costs. While net margin stands at -21.78% and ROIC at -8.16%, the company’s EBIT growth of 100% over the past year signals improving operational efficiency. However, with ROIC below WACC (11.63%), Unity is currently a value destroyer rather than a value creator.
Weaknesses and Drawbacks
Unity is in financial distress, as the Altman Z-Score of 1.05 places it firmly in the Distress Zone, signaling a high bankruptcy risk. Profitability metrics are weak, with net margin at -21.78% and ROE at -12.44%. Valuation metrics present challenges; a high price-to-book ratio of 5.74 suggests overvaluation. The stock faces market pressure, with recent seller dominance at 71.5%, exacerbating downside risks. Interest coverage is negative, flagging potential difficulties in meeting debt obligations.
Our Final Verdict about Unity Software Inc.
Despite operational improvements, Unity’s distressed financial health and looming solvency concerns make its profile highly speculative. The significant risk highlighted by the Altman Z-Score outweighs recent positive EBIT growth and margin trends. Investors seeking stability may find this stock too risky for conservative capital allocation at this stage.
Disclaimer: This content is for informational purposes only and does not constitute financial, investment, or other professional advice. Investing in financial markets involves a significant risk of loss, and past performance is not indicative of future results.
Additional Resources
- Unity (NYSE:U) Beats Q4 CY2025 Sales Expectations But Stock Drops 24% – Yahoo Finance (Feb 11, 2026)
- Unity plummets after Q1 revenue outlook falls below expectations – Seeking Alpha (Feb 11, 2026)
- What’s Going On With Unity Stock Wednesday? – Benzinga (Feb 11, 2026)
- Unity Reports Fourth Quarter and Fiscal Year 2025 Financial Results – Business Wire (Feb 11, 2026)
- Unity shares sink 30% on disappointing first-quarter outlook – Investing.com (Feb 11, 2026)
For more information about Unity Software Inc., please visit the official website: unity.com