Home > Analyses > Industrials > United Rentals, Inc.
United Rentals transforms construction sites and industrial projects by supplying essential equipment that keeps operations moving. It dominates the rental and leasing services industry with a vast fleet spanning general construction tools to specialized machinery. Renowned for innovation and operational scale, it supports critical infrastructure and municipal projects worldwide. As the company navigates evolving market demands, I will assess whether its robust fundamentals continue to justify its premium valuation and growth prospects.

Table of contents
Business Model & Company Overview
United Rentals, Inc. operates as a leading player in the Rental & Leasing Services industry, founded in 1997 and headquartered in Stamford, Connecticut. It manages a cohesive ecosystem of equipment rental solutions across general construction, industrial, and specialty sectors. Its expansive network of 1,360 locations spans North America, Europe, and Oceania, serving contractors, municipalities, and manufacturers with a broad range of tools and machinery.
The company’s revenue engine balances high-margin equipment rentals with complementary sales and maintenance services. Its two segments—General Rentals and Specialty—combine hardware assets like aerial lifts and fluid solutions with recurring service contracts. This integrated model drives stable cash flows and supports its dominant market position. United Rentals’ economic moat stems from scale, geographic reach, and a comprehensive product portfolio shaping the future of infrastructure support.
Financial Performance & Fundamental Metrics
I analyze United Rentals, Inc.’s income statement, key financial ratios, and dividend payout policy to assess its fiscal health and shareholder value creation.
Income Statement
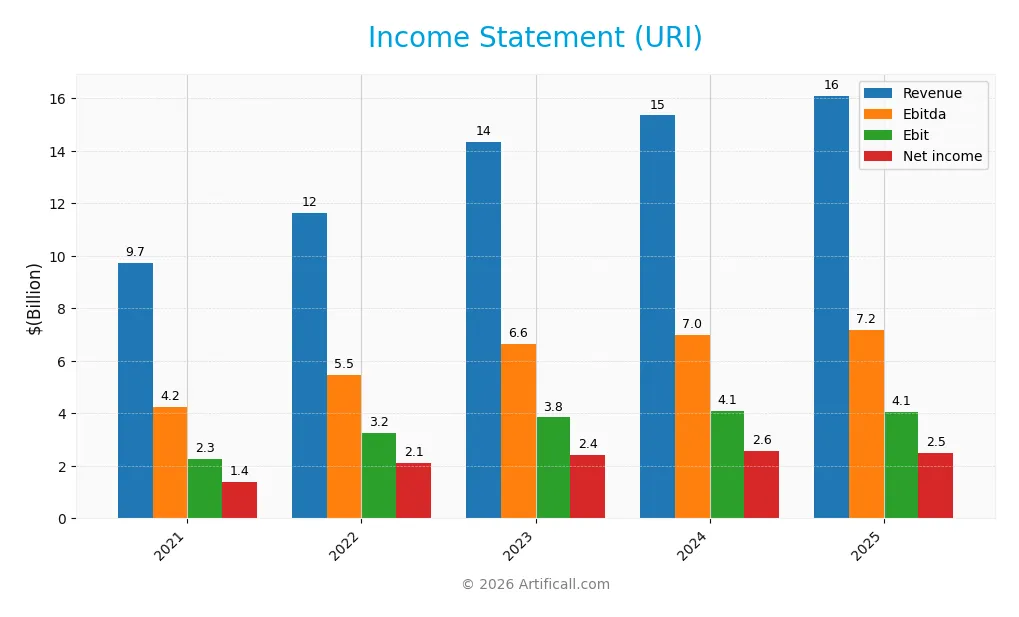
This table displays United Rentals, Inc.’s key income statement figures for fiscal years 2021 through 2025, reflecting its financial performance and profitability trends.
| 2021 | 2022 | 2023 | 2024 | 2025 | |
|---|---|---|---|---|---|
| Revenue | 9.7B | 11.6B | 14.3B | 15.3B | 16.1B |
| Cost of Revenue | 6.2B | 7.0B | 8.9B | 9.6B | 10.4B |
| Operating Expenses | 1.2B | 1.4B | 1.5B | 1.6B | 1.7B |
| Gross Profit | 3.5B | 4.6B | 5.4B | 5.7B | 5.7B |
| EBITDA | 4.2B | 5.5B | 6.6B | 7.0B | 7.2B |
| EBIT | 2.3B | 3.2B | 3.8B | 4.1B | 4.1B |
| Interest Expense | 424M | 445M | 635M | 691M | 716M |
| Net Income | 1.4B | 2.1B | 2.4B | 2.6B | 2.5B |
| EPS | 19.14 | 29.77 | 35.40 | 38.82 | 38.71 |
| Filing Date | 2022-01-26 | 2023-01-25 | 2024-01-24 | 2025-01-29 | 2026-01-28 |
Income Statement Evolution
United Rentals’ revenue grew 65.7% from 2021 to 2025, with a 4.9% increase in the latest year. Net income rose 79.9% over the period but declined slightly by 3.1% in 2025 versus 2024. Margins improved overall, with gross margin steady near 35.4%, though net margin saw a 7.7% contraction in the last year, reflecting some margin pressure.
Is the Income Statement Favorable?
In 2025, United Rentals reported $16.1B revenue and $2.49B net income, yielding a net margin of 15.5%, rated favorable. EBITDA margin remained strong at 44.5%, while interest expense stayed controlled at 4.45% of revenue. However, slight deterioration in EBIT and net income growth alongside rising operating expenses presents caution. Overall fundamentals are favorable but show emerging headwinds.
Financial Ratios
The table below presents key financial ratios for United Rentals, Inc. over the past five fiscal years, illustrating profitability, liquidity, leverage, and market valuation trends:
| Ratios | 2021 | 2022 | 2023 | 2024 | 2025 |
|---|---|---|---|---|---|
| Net Margin | 14.3% | 18.1% | 16.9% | 16.8% | 15.5% |
| ROE | 23.1% | 29.8% | 29.8% | 29.9% | 27.8% |
| ROIC | 9.2% | 11.0% | 12.3% | 11.8% | 10.7% |
| P/E | 17.4 | 11.9 | 16.2 | 18.1 | 20.9 |
| P/B | 4.0 | 3.6 | 4.8 | 5.4 | 5.8 |
| Current Ratio | 0.83 | 1.11 | 0.81 | 0.98 | 0.94 |
| Quick Ratio | 0.76 | 1.02 | 0.75 | 0.92 | 0.88 |
| D/E | 1.75 | 1.73 | 1.56 | 1.72 | 1.84 |
| Debt-to-Assets | 52% | 51% | 49% | 53% | 55% |
| Interest Coverage | 5.4 | 7.3 | 6.1 | 5.9 | 5.6 |
| Asset Turnover | 0.48 | 0.48 | 0.56 | 0.54 | 0.54 |
| Fixed Asset Turnover | 0.81 | 0.78 | 0.90 | 0.89 | 6.37* |
| Dividend Yield | 0% | 0% | 1.0% | 0.93% | 0.89% |
*Note: The fixed asset turnover in 2025 appears as 6.37, which is an outlier compared to prior years and likely reflects a data anomaly or classification difference.
Evolution of Financial Ratios
From 2021 to 2025, United Rentals’ Return on Equity (ROE) improved steadily from 23.13% to 27.81%, signaling stronger profitability. The Current Ratio fluctuated below 1.2, ending at 0.94 in 2025, indicating constrained short-term liquidity. Debt-to-Equity rose from 1.75 to 1.84, reflecting increased leverage with moderate stability in profit margins.
Are the Financial Ratios Favorable?
In 2025, profitability metrics like ROE (27.81%) and net margin (15.49%) are favorable, supported by a solid interest coverage of 5.66x. Liquidity ratios, including the current ratio at 0.94 and quick ratio at 0.88, show some caution. Leverage remains elevated with debt-to-equity at 1.84 and debt-to-assets exceeding 55%. Market multiples are mixed, with a high price-to-book ratio (5.81) marked unfavorable. Overall, the ratio profile is neutral, balancing strengths and weaknesses.
Shareholder Return Policy
United Rentals, Inc. maintains a consistent dividend payout ratio around 17-19%, with dividend per share rising steadily to $7.20 in 2025. The annual dividend yield hovers near 0.9%, supported by moderate free cash flow coverage and supplemented by share buybacks.
This balanced distribution strategy reflects prudent capital allocation, aligning dividends and buybacks with sustainable cash generation. Despite a modest current ratio below 1, the approach appears designed to support long-term shareholder value without risking over-distribution.
Score analysis
The radar chart below presents a comprehensive view of United Rentals, Inc.’s key financial scores:
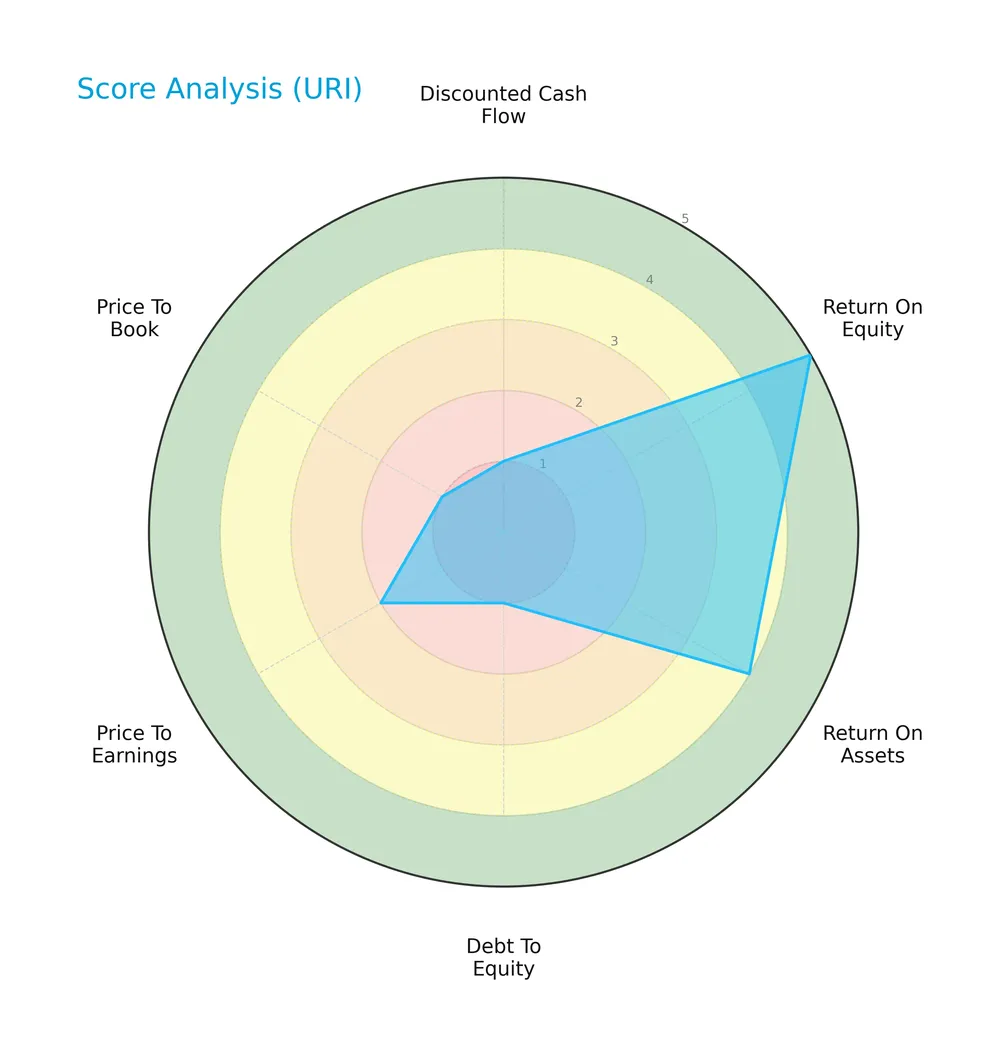
United Rentals exhibits a mixed score profile. Its return on equity (5) and return on assets (4) are favorable, reflecting operational efficiency. However, debt to equity (1), discounted cash flow (1), and price to book (1) scores are very unfavorable, signaling financial leverage and valuation concerns.
Analysis of the company’s bankruptcy risk
United Rentals’ Altman Z-Score situates the company securely in the safe zone, indicating a low bankruptcy risk:

Is the company in good financial health?
The Piotroski Score diagram highlights the company’s moderate financial health status:

With a Piotroski Score of 5, United Rentals demonstrates average financial strength. This suggests the company maintains a balanced but not robust position concerning profitability, leverage, and efficiency metrics.
Competitive Landscape & Sector Positioning
This sector analysis explores United Rentals, Inc.’s strategic positioning, revenue streams, key products, and main competitors. I will assess whether United Rentals holds a competitive advantage over its peers in the rental and leasing services industry.
Strategic Positioning
United Rentals, Inc. maintains a concentrated product portfolio centered on equipment rentals and related services. Geographically, it predominantly serves the U.S. market, generating over $14.6B in 2025, with a smaller but growing presence in Canada, Europe, Australia, and New Zealand totaling $1.4B.
Revenue by Segment
This pie chart illustrates United Rentals, Inc.’s revenue distribution by segment for the fiscal year 2025, highlighting the relative contribution of each business unit to total sales.
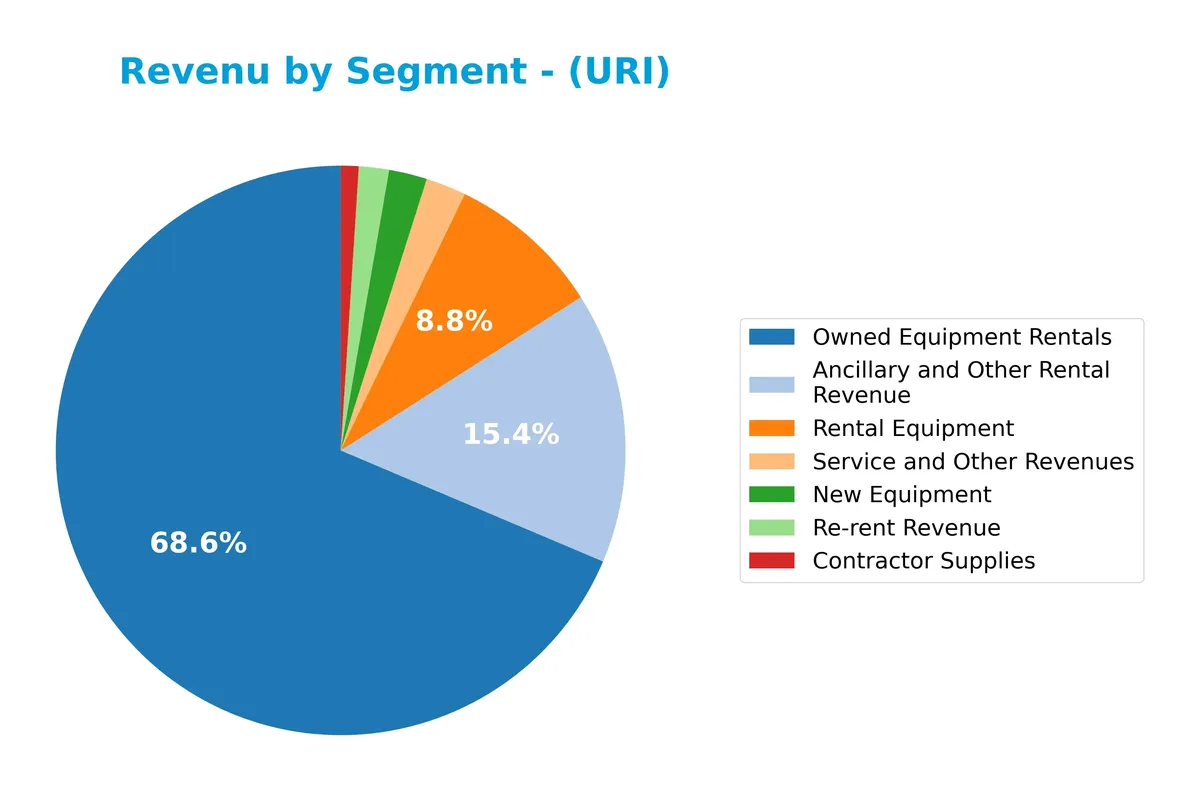
In 2025, Owned Equipment Rentals dominates with 11B in revenue, reflecting its core role in United Rentals’ portfolio. Ancillary and Other Rental Revenue grew to 2.48B, indicating strong support services demand. Rental Equipment declined slightly to 1.41B, signaling some softness. New Equipment and Service Revenues remain smaller but steady contributors at 348M and 369M respectively. The mix shows reliance on rental assets, with recent growth focused on ancillary services.
Key Products & Brands
United Rentals generates revenue from a diverse range of rental and sales products and services across construction and industrial sectors:
| Product | Description |
|---|---|
| General Rentals | Rental of general construction and industrial equipment including backhoes, forklifts, and lifts. |
| Specialty Rentals | Specialty construction products like trench safety equipment, HVAC, power generators, and fluid solutions. |
| Owned Equipment Rentals | Revenue from renting equipment owned by the company to construction, industrial, and municipal clients. |
| Ancillary and Other Rental Revenue | Additional rental-related services and equipment supporting core rentals. |
| Contractor Supplies | Sales of consumables, tools, small equipment, and safety supplies for contractors. |
| New Equipment Sales | Sales of new aerial lifts, forklifts, telehandlers, compressors, and generators. |
| Service and Other Revenues | Repair, maintenance, and other related service revenues. |
| Re-rent Revenue | Income from renting equipment sourced from third parties for customer use. |
United Rentals operates a broad product portfolio centered on equipment rental, supported by complementary sales and services. This mix serves diverse customer needs in construction, infrastructure, and industrial markets across multiple geographies.
Main Competitors
United Rentals, Inc. faces competition from a total of 2 companies, with the following table listing the top 10 leaders by market capitalization:
| Competitor | Market Cap. |
|---|---|
| United Rentals, Inc. | 54.9B |
| Pony AI Inc. American Depositary Shares | 5.6B |
United Rentals, Inc. ranks 1st among its competitors. Its market cap is 4.2% larger than the next closest rival, Pony AI. The company stands well above both the average market cap of the top 10 peers (30.3B) and the sector median, indicating strong scale. The gap to its nearest competitor below is substantial, highlighting a dominant market position.
Comparisons with competitors
Check out how we compare the company to its competitors:
Does United Rentals have a competitive advantage?
United Rentals currently does not demonstrate a clear competitive advantage, as its ROIC remains below WACC, indicating value erosion despite a growing profitability trend. The company’s slightly favorable moat status reflects improving efficiency but lacks strong economic moat characteristics.
Looking ahead, United Rentals benefits from expanding its rental network across multiple continents and offers diverse equipment segments, including specialty construction products. These avenues present growth opportunities in infrastructure and industrial markets, potentially enhancing its competitive positioning over time.
SWOT Analysis
This analysis highlights United Rentals, Inc.’s key internal and external factors shaping its strategic outlook.
Strengths
- strong market position in equipment rental
- favorable EBIT margin at 25.18%
- growing ROIC trend
Weaknesses
- high debt-to-equity ratio at 1.84
- current ratio below 1 at 0.94
- unfavorable PB ratio at 5.81
Opportunities
- expanding international footprint
- infrastructure spending boosts demand
- increasing specialty rental segment
Threats
- economic cycles affect construction demand
- rising interest rates increase debt costs
- competition pressures pricing and margins
United Rentals leverages solid profitability and market leadership but must address leverage risks. Growth opportunities in infrastructure and specialty rentals support expansion, though cyclical and financial risks require vigilance.
Stock Price Action Analysis
The weekly stock chart for United Rentals, Inc. (URI) highlights significant price movements and volatility over the past 12 months:
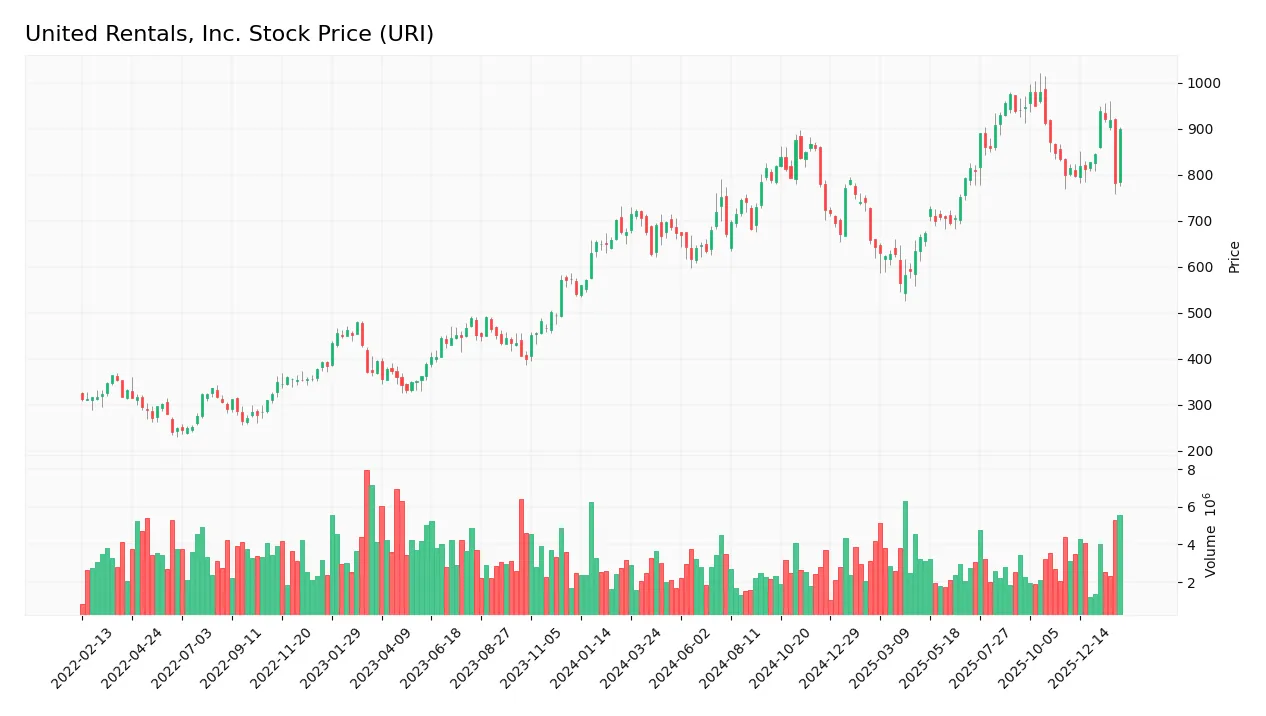
Trend Analysis
Over the past 12 months, URI stock gained 33.15%, indicating a bullish trend with clear acceleration. The price ranged from a low of 565 to a high near 981, reflecting strong upward momentum and elevated volatility (std dev 105). The recent three-month period shows a 12.44% gain, confirming continued positive momentum.
Volume Analysis
Total volume for the year reached 347M shares, with buyers accounting for 52.27%. Volume trends upward, signaling growing market participation. However, in the recent three months, sellers slightly dominated 53%, with neutral buyer behavior, suggesting mixed investor sentiment and potential short-term caution.
Target Prices
Analysts present a robust target consensus for United Rentals, Inc., signaling strong growth expectations.
| Target Low | Target High | Consensus |
|---|---|---|
| 600 | 1,071 | 942.9 |
The broad range from 600 to 1,071 reflects some volatility, but the consensus near 943 suggests solid confidence in the stock’s upside potential.

Don’t Let Luck Decide Your Entry Point
Optimize your entry points with our advanced ProRealTime indicators. You’ll get efficient buy signals with precise price targets for maximum performance. Start outperforming now!
Analyst & Consumer Opinions
This section reviews analyst ratings and consumer feedback to provide insight into United Rentals, Inc.’s market perception.
Stock Grades
Here are the latest verified stock grades for United Rentals, Inc. from reputable financial institutions:
| Grading Company | Action | New Grade | Date |
|---|---|---|---|
| Citigroup | Maintain | Buy | 2026-02-02 |
| JP Morgan | Maintain | Overweight | 2026-01-30 |
| RBC Capital | Maintain | Outperform | 2026-01-30 |
| Wells Fargo | Maintain | Overweight | 2026-01-23 |
| Citigroup | Maintain | Buy | 2026-01-13 |
| UBS | Upgrade | Buy | 2026-01-05 |
| Truist Securities | Maintain | Buy | 2025-12-18 |
| Citigroup | Maintain | Buy | 2025-12-11 |
| Keybanc | Maintain | Overweight | 2025-12-03 |
| RBC Capital | Maintain | Outperform | 2025-10-24 |
The consensus reveals a consistent buy or outperform stance, indicating broad confidence in United Rentals. Only UBS recently upgraded its rating, while all others maintained positive views.
Consumer Opinions
United Rentals, Inc. sparks a mix of enthusiasm and caution among its customers, reflecting its position in a competitive equipment rental market.
| Positive Reviews | Negative Reviews |
|---|---|
| Equipment quality is consistently reliable. | Pricing can be higher than some competitors. |
| Customer service is responsive and helpful. | Delivery times sometimes delay project starts. |
| Wide selection of rental equipment available. | Invoicing errors occasionally reported. |
Overall, consumers praise United Rentals for dependable equipment and strong service. However, recurring concerns about pricing and occasional logistical hiccups suggest areas needing strategic focus.
Risk Analysis
Below is a summary of key risks United Rentals, Inc. faces, including likelihood and potential impact:
| Category | Description | Probability | Impact |
|---|---|---|---|
| Leverage Risk | High debt-to-equity ratio (1.84) increases financial vulnerability. | High | High |
| Liquidity Risk | Current ratio below 1 (0.94) signals tight short-term liquidity. | Medium | Medium |
| Valuation Risk | Elevated price-to-book ratio (5.81) suggests expensive stock relative to assets. | Medium | Medium |
| Market Volatility | Beta of 1.676 implies stock is more volatile than the market. | High | Medium |
| Operational Risk | Heavy reliance on construction and industrial sectors exposes URI to cyclical downturns. | Medium | High |
Leverage and liquidity risks stand out as the most significant. The company’s debt burden exceeds industry norms, raising refinancing concerns if rates rise. Despite a safe Altman Z-score (3.17), the moderate Piotroski score (5) reflects average financial strength. Caution is warranted given URI’s reliance on economic cycles.
Should You Buy United Rentals, Inc.?
United Rentals appears to be improving profitability with growing ROIC, yet it is shedding value relative to WACC. Despite a manageable leverage profile, its competitive moat remains slightly favorable. The overall B- rating suggests cautious optimism amid mixed financial signals.
Strength & Efficiency Pillars
United Rentals, Inc. posts solid profitability with a net margin of 15.49% and return on equity at 27.81%, reflecting efficient capital use. Its ROIC stands at 10.75%, slightly below the WACC of 9.82%, indicating the company is close to breaking even on value creation but is not yet a definitive value creator. Operational margins remain strong, supported by a favorable EBIT margin of 25.18% and interest expense at a manageable 4.45%.
Weaknesses and Drawbacks
The company faces valuation and leverage challenges. Its price-to-book ratio of 5.81 and debt-to-equity ratio of 1.84 signal elevated financial risk and premium market valuation. Liquidity is a concern, with a current ratio of 0.94 below the safe threshold, increasing short-term solvency risks. Despite a safe Altman Z-Score of 3.17, these leverage and liquidity drawbacks warrant caution, especially amid a seller-dominant recent trading period with only 47.01% buyer volume.
Our Final Verdict about United Rentals, Inc.
United Rentals presents a fundamentally stable profile with safe solvency metrics and strong profitability. Despite a bullish long-term trend, recent market pressure and moderate valuation premiums suggest a cautious stance. The stock may appear suitable for long-term exposure, but investors might consider waiting for a more favorable entry point given near-term liquidity risks and seller dominance.
Disclaimer: This content is for informational purposes only and does not constitute financial, investment, or other professional advice. Investing in financial markets involves a significant risk of loss, and past performance is not indicative of future results.
Additional Resources
- BI Asset Management Fondsmaeglerselskab A S Trims Stake in United Rentals, Inc. $URI – MarketBeat (Feb 06, 2026)
- Peering Into United Rentals Inc’s Recent Short Interest – Benzinga (Feb 05, 2026)
- AI-focused venture capitalist joins United Rentals board – stocktitan.net (Feb 04, 2026)
- United Rentals (URI): The Industrial Titan Navigating a New Economic Normal – FinancialContent (Feb 05, 2026)
- United Rentals’ (NYSE:URI) Shareholders Will Receive A Bigger Dividend Than Last Year – Yahoo Finance (Feb 01, 2026)
For more information about United Rentals, Inc., please visit the official website: unitedrentals.com