Home > Analyses > Industrials > United Parcel Service, Inc.
United Parcel Service, Inc. powers the flow of global commerce, moving millions of packages daily with precision and speed. It dominates the integrated freight and logistics sector, renowned for its vast delivery network and cutting-edge supply chain solutions. UPS’s blend of innovation and scale sets a high bar for reliability and efficiency worldwide. As market dynamics evolve, I ask: does UPS’s financial strength still justify its premium valuation and growth prospects in 2026?

Table of contents
Business Model & Company Overview
United Parcel Service, Inc., founded in 1907 and headquartered in Atlanta, Georgia, commands a dominant position in the Integrated Freight & Logistics sector. Its ecosystem spans package delivery, transportation, and supply chain solutions, weaving together air and ground services to meet diverse customer needs. With a fleet of 121K vehicles and 59K cargo containers, UPS solidifies its reach and operational scale across 200 countries and territories.
The company’s revenue engine balances U.S. domestic and international package delivery with freight forwarding, customs brokerage, and technology-driven shipping services. UPS’s footprint covers the Americas, Europe, and Asia Pacific, offering guaranteed, time-definite express options worldwide. This robust global presence and diversified service mix create a formidable economic moat, underpinning its role in shaping the future of logistics.
Financial Performance & Fundamental Metrics
I analyze United Parcel Service, Inc.’s income statement, key financial ratios, and dividend payout policy to assess its core financial health and shareholder value.
Income Statement
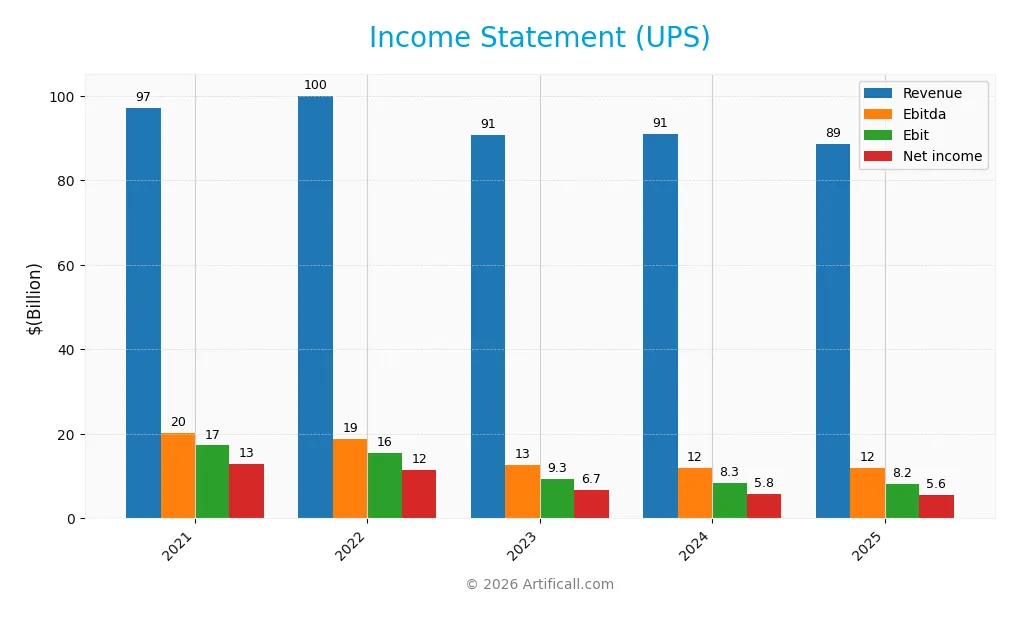
The table below summarizes United Parcel Service, Inc.’s key income statement figures for fiscal years 2021 to 2025, reflecting revenue, expenses, and profitability metrics.
| 2021 | 2022 | 2023 | 2024 | 2025 | |
|---|---|---|---|---|---|
| Revenue | 97.2B | 100B | 90.7B | 90.9B | 88.7B |
| Cost of Revenue | 79.8B | 79.9B | 73.0B | 73.8B | 72.6B |
| Operating Expenses | 4.33B | 7.11B | 8.34B | 8.37B | 8.16B |
| Gross Profit | 17.4B | 20.1B | 17.7B | 17.1B | 16.0B |
| EBITDA | 20.2B | 18.7B | 12.7B | 11.9B | 11.9B |
| EBIT | 17.3B | 15.5B | 9.35B | 8.30B | 8.18B |
| Interest Expense | 683M | 694M | 775M | 861M | 1.02B |
| Net Income | 12.9B | 11.5B | 6.71B | 5.78B | 5.57B |
| EPS | 14.75 | 13.26 | 7.81 | 6.76 | 6.56 |
| Filing Date | 2022-02-22 | 2023-02-21 | 2024-02-20 | 2025-02-18 | 2026-02-17 |
Income Statement Evolution
From 2021 to 2025, UPS’s revenue declined by 8.8%, reflecting a challenging top-line environment. Net income fell sharply by 56.8%, with net margin contracting over 52%. Gross and EBIT margins held steady around 18% and 9%, respectively, indicating stable cost controls despite falling profits. Margin deterioration signals pressure on profitability.
Is the Income Statement Favorable?
The 2025 income statement reveals mixed fundamentals. Net margin of 6.3% and interest expense at 1.15% of revenue are favorable, reflecting efficient financing and cost management. However, revenue and net income both dropped year-over-year, with EPS declining nearly 3%. Overall, the income statement trends appear unfavorable, highlighting persistent earnings challenges.
Financial Ratios
The table below presents key financial ratios for United Parcel Service, Inc. (UPS) over the past five fiscal years, illustrating profitability, valuation, liquidity, leverage, efficiency, and dividend metrics:
| Ratios | 2021 | 2022 | 2023 | 2024 | 2025 |
|---|---|---|---|---|---|
| Net Margin | 13.3% | 11.5% | 7.4% | 6.4% | 6.3% |
| ROE | 90.4% | 58.4% | 38.8% | 34.6% | 34.3% |
| ROIC | 18.7% | 18.1% | 12.8% | 12.0% | 10.4% |
| P/E | 14.5 | 13.1 | 20.1 | 18.6 | 15.1 |
| P/B | 13.1 | 7.7 | 7.8 | 6.4 | 5.2 |
| Current Ratio | 1.42 | 1.22 | 1.10 | 1.17 | 1.22 |
| Quick Ratio | 1.38 | 1.18 | 1.05 | 1.12 | 1.22 |
| D/E | 1.79 | 1.19 | 1.54 | 1.53 | 1.99 |
| Debt-to-Assets | 36.8% | 33.1% | 37.7% | 36.6% | 44.2% |
| Interest Coverage | 19.2 | 18.7 | 12.1 | 10.1 | 7.7 |
| Asset Turnover | 1.40 | 1.41 | 1.28 | 1.30 | 1.21 |
| Fixed Asset Turnover | 2.62 | 2.60 | 2.20 | 2.20 | 2.11 |
| Dividend Yield | 1.8% | 3.4% | 4.0% | 5.0% | 6.4% |
Evolution of Financial Ratios
From 2021 to 2025, UPS’s Return on Equity (ROE) showed a marked decline from 90.4% to 34.3%, indicating slowing profitability. The Current Ratio remained relatively stable around 1.1 to 1.4, suggesting consistent liquidity. Debt-to-Equity Ratio increased from 1.79 to 1.99, reflecting a gradual rise in leverage over the period.
Are the Financial Ratios Favorable?
In 2025, UPS exhibits generally favorable profitability with ROE at 34.3% and ROIC above WACC, signaling efficient capital use. Liquidity ratios are neutral to favorable, with a Current Ratio of 1.22 and Quick Ratio favorable. However, leverage is somewhat elevated, with a Debt-to-Equity near 2. Market valuation ratios are mixed: P/E is neutral, but P/B is unfavorable. Overall, the ratio profile is slightly favorable.
Shareholder Return Policy
United Parcel Service, Inc. maintains a high dividend payout ratio near 97%, with dividends per share steadily rising to 6.36 in 2025. The annual dividend yield stands at 6.4%, supported by free cash flow coverage close to 93%, indicating a commitment to returning capital to shareholders while controlling payout risk.
The company also engages in share buybacks, complementing its dividend policy. This distribution strategy appears balanced, aiming to sustain shareholder value without overextending financial resources, though the high payout ratio warrants monitoring to avoid pressure on future cash flows.
Score analysis
The following radar chart displays United Parcel Service, Inc.’s key financial scores across valuation, profitability, and leverage metrics:
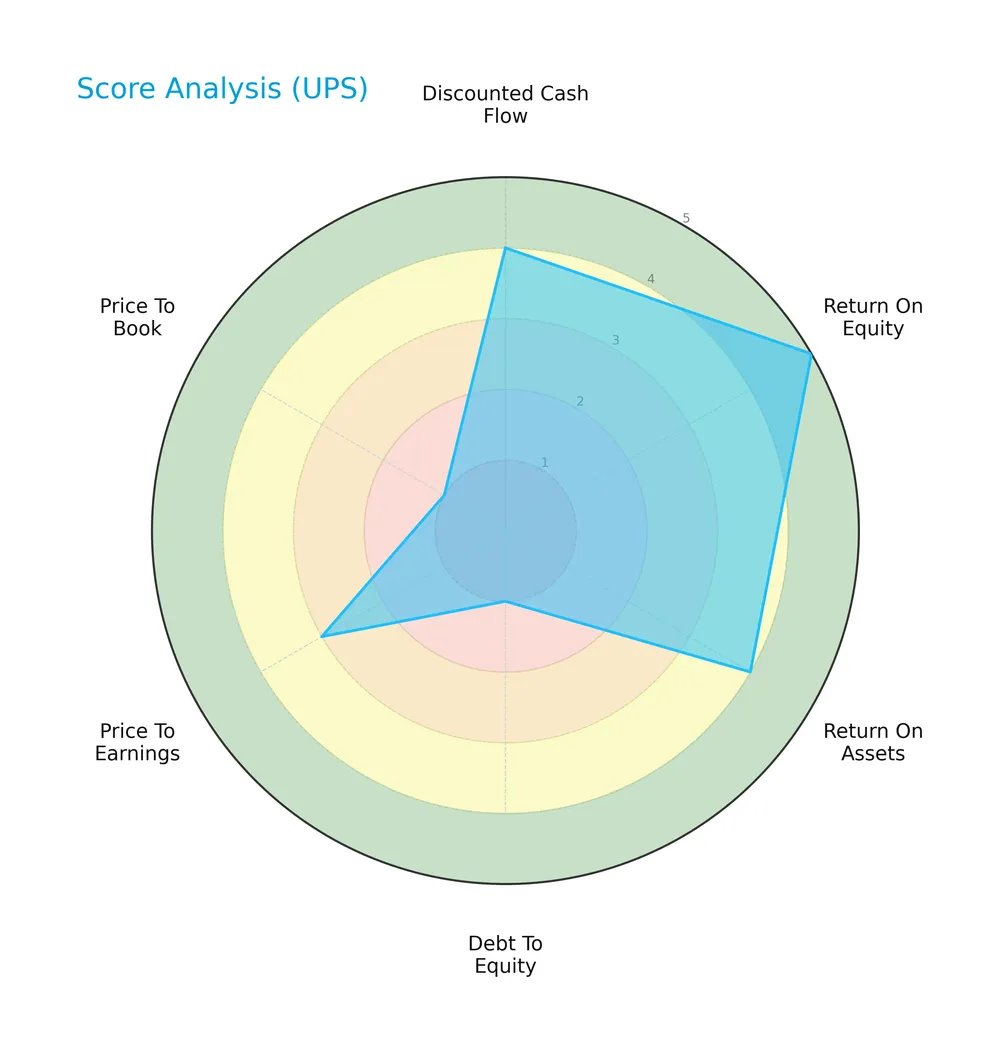
UPS shows strong profitability with a very favorable ROE (5) and favorable ROA (4). Its discounted cash flow is favorable (4), but leverage scores are weak, with very unfavorable debt-to-equity (1) and price-to-book (1). Valuation metrics are moderate.
Analysis of the company’s bankruptcy risk
United Parcel Service’s Altman Z-Score places it in the safe zone, indicating low bankruptcy risk and solid financial stability:

Is the company in good financial health?
The Piotroski Score chart below summarizes UPS’s financial health based on nine key criteria:

With a Piotroski Score of 6, UPS demonstrates average financial strength. This suggests reasonable operational efficiency and profitability but leaves room for improvement in financial robustness.
Competitive Landscape & Sector Positioning
This section analyzes United Parcel Service, Inc.’s strategic positioning, revenue segments, key products, and main competitors. We will assess the company’s competitive advantages in the integrated freight and logistics sector. I will examine whether UPS holds a sustainable edge over its rivals.
Strategic Positioning
United Parcel Service, Inc. concentrates on integrated freight and logistics with a diversified product portfolio spanning U.S. Domestic Package (44B), International Package (14.5B), and Supply Chain & Freight (5.9B) segments. Its geographic exposure covers approximately 200 countries, with dominant U.S. revenue.
Revenue by Segment
This pie chart presents United Parcel Service, Inc.’s revenue distribution by segment for the fiscal year 2025, highlighting the relative contributions of its key business lines.
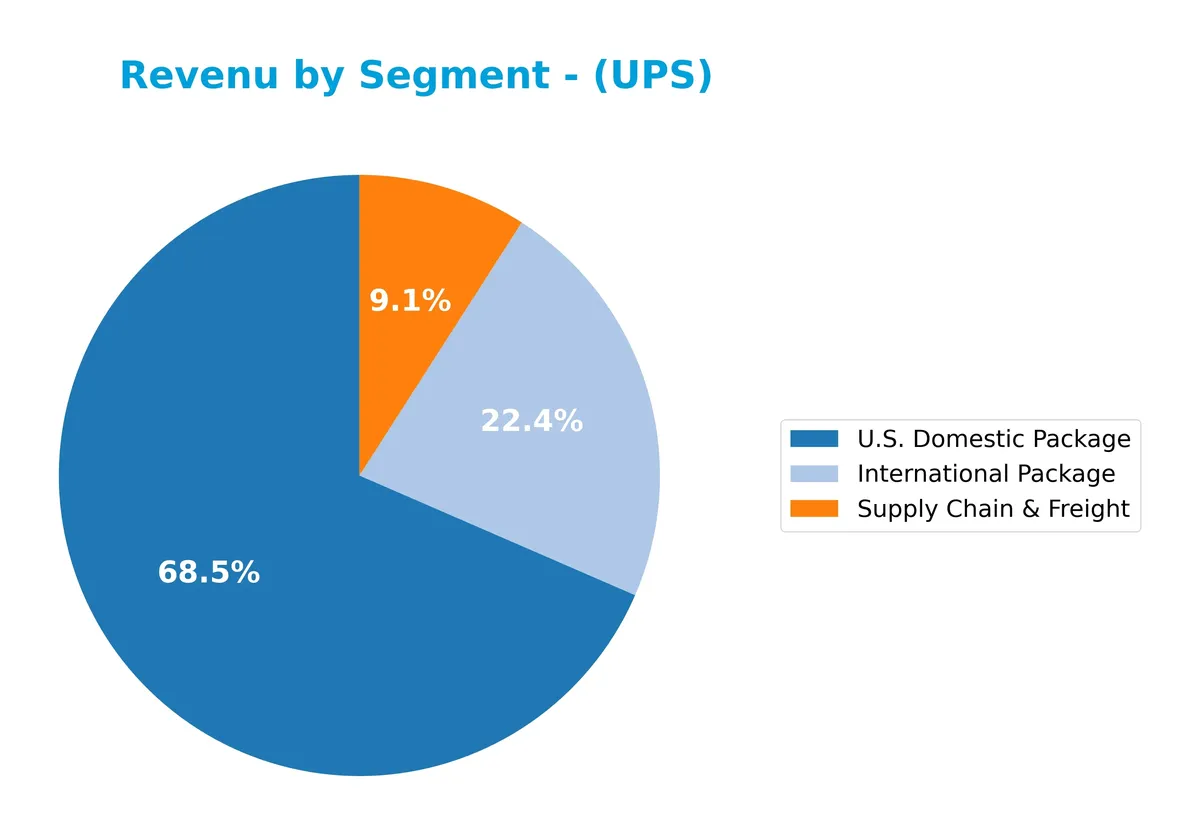
U.S. Domestic Package dominates with $44.2B, underscoring its role as the core revenue driver. International Package follows at $14.5B, showing steady growth over the years. Supply Chain & Freight, at $5.9B, lags behind and even shrank compared to prior peaks, signaling potential concentration risk. The 2025 data reveal an accelerating reliance on domestic services, emphasizing UPS’s stronghold in the U.S. market.
Key Products & Brands
United Parcel Service, Inc. operates through three primary segments and their key services are detailed below:
| Product | Description |
|---|---|
| U.S. Domestic Package | Time-definite delivery of letters, documents, small packages, and palletized freight across the U.S. by air and ground. |
| International Package | Guaranteed day and time-definite international shipping with express options across multiple global regions. |
| Supply Chain & Freight | Freight forwarding, customs brokerage, distribution, supply chain solutions, and related logistics and consulting services. |
UPS’s portfolio covers comprehensive parcel delivery and logistics services domestically and internationally. The U.S. Domestic Package remains the largest revenue contributor, reflecting strong demand for reliable ground and air shipping across the United States. International and supply chain services complement the core business, addressing global trade and complex logistics needs.
Main Competitors
There are 5 competitors in the Integrated Freight & Logistics industry; the table below lists the top 5 leaders by market capitalization:
| Competitor | Market Cap. |
|---|---|
| United Parcel Service, Inc. | 85.7B |
| FedEx Corporation | 69.2B |
| Expeditors International of Washington, Inc. | 20.8B |
| C.H. Robinson Worldwide, Inc. | 19.3B |
| J.B. Hunt Transport Services, Inc. | 18.7B |
United Parcel Service, Inc. ranks 1st among its competitors with a market cap 14% above the next largest player, FedEx. UPS’s market cap is well above both the average of the top 10 competitors (43B) and the sector median (21B). The company leads its closest rival by a significant 42% margin, underscoring its dominant scale in this segment.
Comparisons with competitors
Check out how we compare the company to its competitors:
Does UPS have a competitive advantage?
UPS shows a slight competitive advantage, creating value with a ROIC exceeding WACC by 3.1%. However, its ROIC has declined by over 44% from 2021 to 2025, signaling weakening profitability. Revenue and net income trends remain unfavorable, reflecting challenges in sustaining strong growth and margins over the period.
Looking ahead, UPS continues expanding its global logistics footprint, serving approximately 200 countries. Its U.S. Domestic and International Package segments offer time-definite delivery, while supply chain solutions target healthcare and life sciences. These diversified services provide opportunities to leverage technology and network scale for future growth.
SWOT Analysis
This SWOT analysis highlights United Parcel Service, Inc.’s key strategic factors influencing its competitive position and growth potential.
Strengths
- strong ROE at 34%
- positive ROIC vs. WACC spread
- extensive global logistics network
Weaknesses
- declining revenue and net income growth
- high debt-to-equity ratio
- unfavorable price-to-book valuation
Opportunities
- expanding international e-commerce
- supply chain and healthcare logistics growth
- technology-driven operational efficiencies
Threats
- intense competition from FedEx and Amazon
- economic slowdown impacts volume
- rising fuel and labor costs
UPS’s robust profitability and global footprint provide a solid foundation. However, shrinking revenue and leverage risks demand cautious capital management. Strategic focus on technology and international expansion can offset competitive and macroeconomic pressures.
Stock Price Action Analysis
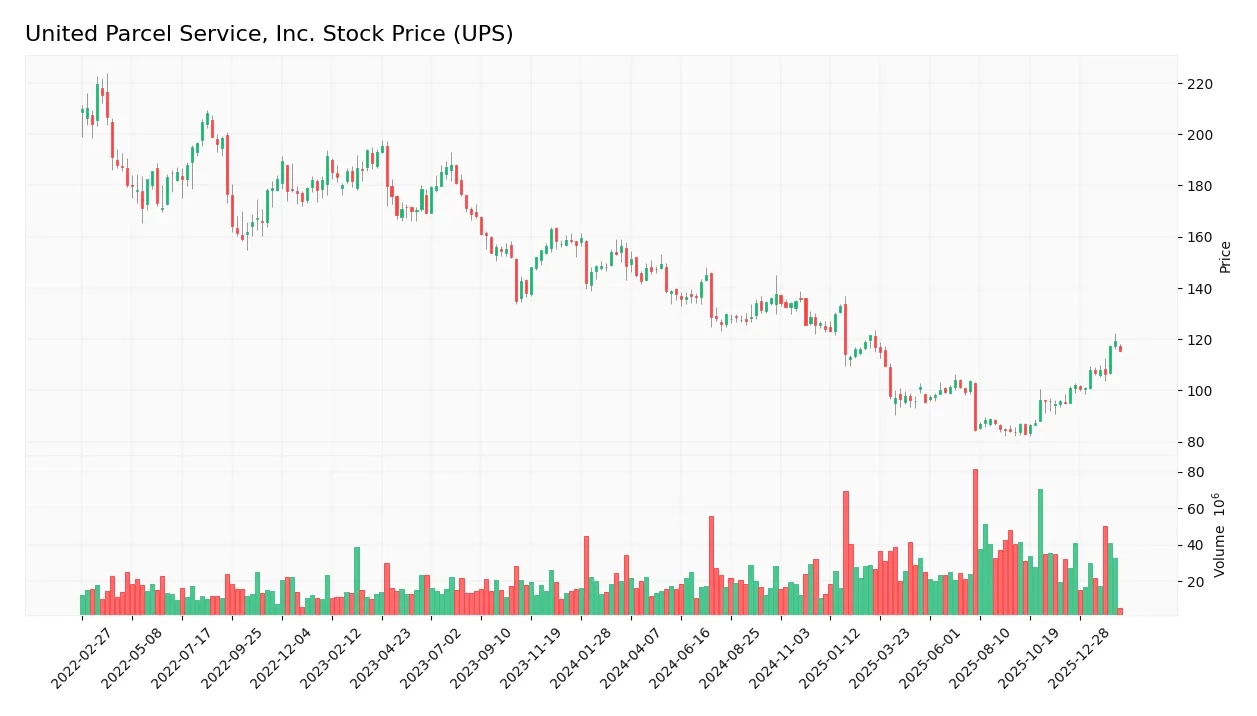
The following weekly chart illustrates United Parcel Service, Inc. (UPS) stock price movements over the past 12 months:
Trend Analysis
Over the past 12 months, UPS stock declined by 22.28%, indicating a bearish trend with accelerating downward momentum. The stock fluctuated between a high of 151.36 and a low of 82.87, with significant volatility marked by a 19.75 standard deviation.
Volume Analysis
In the last three months, trading volume increased with buyer dominance at 62.46%. This buyer-driven activity suggests growing investor interest and positive sentiment despite the prior overall bearish trend.
Target Prices
Analysts set a clear consensus target price for UPS, reflecting moderate upside potential.
| Target Low | Target High | Consensus |
|---|---|---|
| 85 | 128 | 110.6 |
The target range spans from $85 to $128, with a consensus near $111. This suggests analysts expect steady appreciation, balancing risks in logistics and economic cycles.

Don’t Let Luck Decide Your Entry Point
Optimize your entry points with our advanced ProRealTime indicators. You’ll get efficient buy signals with precise price targets for maximum performance. Start outperforming now!
Analyst & Consumer Opinions
This section examines United Parcel Service, Inc.’s grades and consumer feedback to gauge market sentiment and reputation.
Stock Grades
Here are the latest verified stock grades for United Parcel Service, Inc., reflecting analyst sentiment as of early 2026:
| Grading Company | Action | New Grade | Date |
|---|---|---|---|
| Oppenheimer | Maintain | Outperform | 2026-01-28 |
| Deutsche Bank | Maintain | Hold | 2026-01-28 |
| Citigroup | Maintain | Buy | 2026-01-28 |
| BMO Capital | Maintain | Market Perform | 2026-01-28 |
| UBS | Maintain | Buy | 2026-01-28 |
| Stifel | Maintain | Buy | 2026-01-28 |
| JP Morgan | Maintain | Neutral | 2026-01-28 |
| Jefferies | Maintain | Buy | 2026-01-28 |
| Stephens & Co. | Maintain | Equal Weight | 2026-01-28 |
| Truist Securities | Maintain | Buy | 2026-01-28 |
Analyst ratings for UPS predominantly hold steady, with a notable bias towards Buy and Outperform grades. The consensus leans towards a Hold, indicating balanced investor expectations amid mixed signals.
Consumer Opinions
Consumers often praise United Parcel Service, Inc. for its reliable delivery, but some express frustration over occasional delays.
| Positive Reviews | Negative Reviews |
|---|---|
| Timely and secure package delivery. | Delivery delays during peak seasons. |
| Friendly and helpful customer service. | High shipping costs compared to rivals. |
| Easy-to-use tracking system. | Limited options for international shipping. |
Overall, UPS consistently earns praise for dependable service and customer support. However, seasonal delays and premium pricing remain common concerns among users.
Risk Analysis
Below is a summary of key risks United Parcel Service, Inc. faces, categorized by probability and impact:
| Category | Description | Probability | Impact |
|---|---|---|---|
| Leverage Risk | High debt-to-equity ratio (1.99) raises financial risk. | Medium | High |
| Market Volatility | Beta of 1.09 indicates sensitivity to market swings. | High | Medium |
| Valuation Concerns | Elevated price-to-book ratio (5.19) signals overvaluation. | Medium | Medium |
| Operational Risks | Dependence on global logistics amid supply chain issues. | Medium | High |
| Dividend Sustainability | Dividend yield at 6.41%, but net margin is only 6.28%. | Medium | Medium |
| Economic Sensitivity | Exposure to U.S. and international economic cycles. | High | High |
Leverage risk stands out due to UPS’s almost 2:1 debt-to-equity ratio, heightening vulnerability in tightening credit environments. Economic sensitivity remains critical, given UPS’s global footprint and exposure to macro cycles. Operational disruptions, especially in logistics, pose substantial impact amid persistent supply chain volatility.
Should You Buy United Parcel Service, Inc.?
United Parcel Service appears to be creating value with a slightly favorable moat despite declining profitability. Its leverage profile signals caution amid a very unfavorable debt-to-equity score. Overall, the company suggests a B+ rating with moderate financial strength.
Strength & Efficiency Pillars
United Parcel Service, Inc. demonstrates solid operational efficiency with a net margin of 6.28% and a robust return on equity (ROE) of 34.34%. Its return on invested capital (ROIC) stands at 10.4%, comfortably exceeding the weighted average cost of capital (WACC) at 7.29%, confirming the company as a clear value creator. Interest coverage of 8.04 and an asset turnover ratio of 1.21 further underline effective capital utilization. Despite a slight decline in ROIC trend, UPS maintains favorable profitability metrics in a challenging market environment.
Weaknesses and Drawbacks
UPS faces valuation and leverage concerns that could impair investor confidence. The price-to-book ratio at 5.19 is notably high, suggesting the stock trades at a premium relative to its book value. Debt-to-equity ratio near 2.0 indicates a heavy reliance on debt, elevating financial risk despite a neutral current ratio of 1.22. Revenue and net income have contracted significantly over the past years, signaling underlying growth challenges. These factors, combined with a bearish overall stock trend and a 22.28% price decline, warrant caution.
Our Final Verdict about United Parcel Service, Inc.
UPS’s fundamentals show enduring value creation and operational resilience, supported by favorable profitability and capital efficiency. However, the bearish longer-term trend and premium valuation suggest that despite recent buyer dominance, investors might consider a wait-and-see approach for a more attractive entry point. The company’s profile may appear suitable for those with higher risk tolerance, given macroeconomic uncertainties and leverage concerns.
Disclaimer: This content is for informational purposes only and does not constitute financial, investment, or other professional advice. Investing in financial markets involves a significant risk of loss, and past performance is not indicative of future results.
Additional Resources
- United Parcel Service Inc (UPS) Shares Gap Down to $115.63 on Fe – GuruFocus (Feb 17, 2026)
- UNITED PARCEL SERVICE INC SEC 10-K Report – TradingView (Feb 17, 2026)
- United Parcel Service (NYSE:UPS) Has Affirmed Its Dividend Of $1.64 – simplywall.st (Feb 09, 2026)
- United Parcel Service, Inc. (UPS) Is a Trending Stock: Facts to Know Before Betting on It – Yahoo Finance (Feb 05, 2026)
- UPS Releases 4Q 2025 Earnings And Provides 2026 Guidance – UPS (Jan 27, 2026)
For more information about United Parcel Service, Inc., please visit the official website: ups.com