Home > Analyses > Industrials > United Airlines Holdings, Inc.
United Airlines shapes global connectivity by moving millions of passengers and tons of cargo across six continents. It commands a strong presence in the airlines industry with a vast mainline and regional fleet. Renowned for operational scale and innovation in customer service, United influences travel patterns worldwide. As competition intensifies and costs fluctuate, I question whether United’s current fundamentals justify its stock price and future growth prospects.

Table of contents
Business Model & Company Overview
United Airlines Holdings, Inc., founded in 1968 and headquartered in Chicago, Illinois, stands as a major player in the Airlines, Airports & Air Services sector. It operates a vast network spanning North America, Asia, Europe, Africa, the Pacific, the Middle East, and Latin America. The company’s ecosystem integrates passenger and cargo transport via mainline and regional fleets, complemented by ancillary services like catering, ground handling, training, and maintenance.
United’s revenue engine relies on a balanced mix of passenger ticket sales and recurring service contracts, underpinning its global footprint across key markets in the Americas, Europe, and Asia. This diversified model enables steady cash flow even amid cyclical industry volatility. I see its competitive advantage rooted in scale and service breadth, carving an economic moat that positions United to shape the airline industry’s future.
Financial Performance & Fundamental Metrics
I will analyze United Airlines Holdings, Inc.’s income statement, key financial ratios, and dividend payout policy to assess its core financial health and shareholder value.
Income Statement
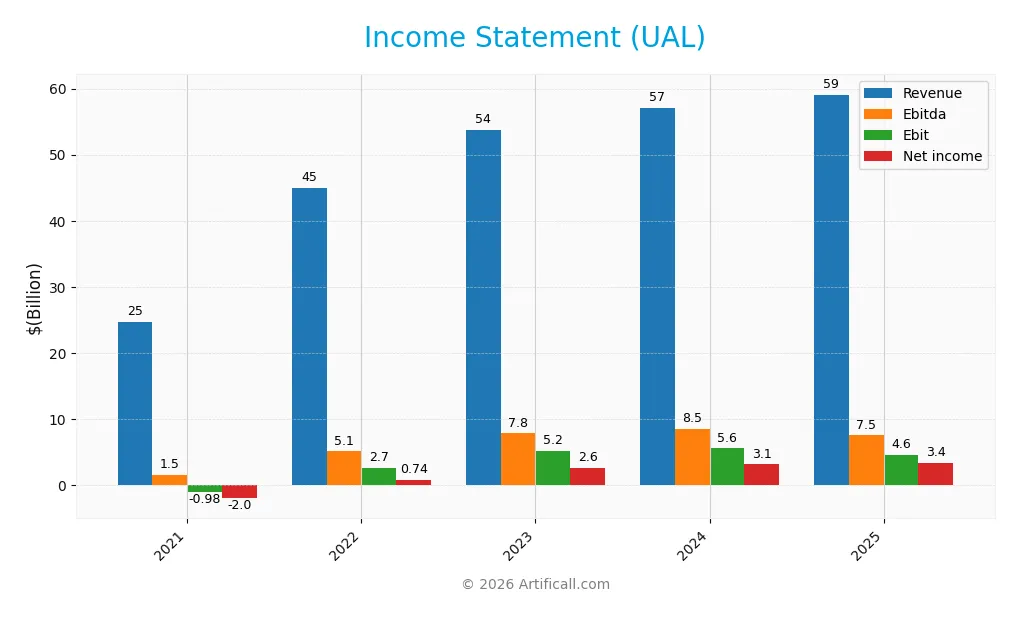
This table summarizes United Airlines Holdings, Inc.’s key income statement figures for fiscal years 2021 through 2025, highlighting revenue, profitability, and earnings per share trends.
| 2021 | 2022 | 2023 | 2024 | 2025 | |
|---|---|---|---|---|---|
| Revenue | 24.6B | 44.9B | 53.7B | 57.1B | 59.1B |
| Cost of Revenue | 23.9B | 34.3B | 38.5B | 37.6B | 21.2B |
| Operating Expenses | 1.74B | 8.30B | 11.0B | 14.3B | 33.2B |
| Gross Profit | 721M | 10.6B | 15.2B | 19.4B | 37.9B |
| EBITDA | 1.51B | 5.12B | 7.83B | 8.50B | 7.54B |
| EBIT | -980M | 2.66B | 5.16B | 5.57B | 4.60B |
| Interest Expense | 1.58B | 1.67B | 1.77B | 1.40B | 1.22B |
| Net Income | -1.96B | 737M | 2.62B | 3.15B | 3.35B |
| EPS | -6.1 | 2.26 | 7.99 | 9.58 | 10.21 |
| Filing Date | 2022-02-18 | 2023-02-16 | 2024-02-29 | 2025-02-27 | 2026-02-12 |
Income Statement Evolution
United Airlines’ revenue rose steadily from 24.6B in 2021 to 59.1B in 2025, marking a strong overall growth of nearly 140%. Net income followed a similar trajectory, surging from a loss of 1.96B in 2021 to a positive 3.35B in 2025. Margins improved significantly, with gross margin reaching a favorable 64.1%, while EBIT margin remained neutral at 7.8%.
Is the Income Statement Favorable?
In 2025, fundamentals appear generally favorable. Revenue growth of 3.5% was moderate, but gross profit nearly doubled, indicating better cost control or pricing power. However, operating expenses grew in line with revenue, pressuring EBIT, which declined 17.4%. Net margin held steady at 5.7%, supported by a favorable interest expense ratio of 2.1%. Overall, the income statement shows resilience with cautious margin management.
Financial Ratios
The table below summarizes key financial ratios for United Airlines Holdings, Inc. over the last five fiscal years:
| Ratios | 2021 | 2022 | 2023 | 2024 | 2025 |
|---|---|---|---|---|---|
| Net Margin | -8% | 2% | 5% | 6% | 6% |
| ROE | -39% | 11% | 28% | 25% | 22% |
| ROIC | -1% | 3% | 6% | 7% | 7% |
| P/E | -7.18 | 16.89 | 5.23 | 10.27 | 10.91 |
| P/B | 2.80 | 1.80 | 1.47 | 2.55 | 2.39 |
| Current Ratio | 1.19 | 1.00 | 0.83 | 0.81 | 0.65 |
| Quick Ratio | 1.14 | 0.95 | 0.76 | 0.74 | 0.59 |
| D/E | 7.83 | 5.28 | 3.94 | 2.65 | 2.39 |
| Debt-to-Assets | 58% | 54% | 52% | 45% | 48% |
| Interest Coverage | -0.65 | 1.40 | 2.37 | 3.63 | 3.86 |
| Asset Turnover | 0.36 | 0.67 | 0.76 | 0.77 | 0.77 |
| Fixed Asset Turnover | 0.67 | 1.17 | 1.23 | 1.22 | 1.14 |
| Dividend Yield | 0 | 0 | 0 | 0 | 0 |
Evolution of Financial Ratios
From 2021 to 2025, United Airlines’ Return on Equity (ROE) improved markedly from negative territory to 21.94%, indicating a recovery in profitability. The Current Ratio declined from 1.19 in 2021 to 0.65 in 2025, signaling weakening short-term liquidity. Debt-to-Equity Ratio also trended downward from 7.83 in 2021 to 2.39 in 2025, reflecting reduced leverage but still relatively high debt levels.
Are the Financial Ratios Favorable?
In 2025, profitability metrics show mixed results: ROE is favorable at 21.94%, while net margin remains neutral at 5.68%. Liquidity ratios, including Current and Quick Ratios, are unfavorable at 0.65 and 0.59, respectively, indicating potential short-term solvency risks. Leverage remains elevated with a Debt-to-Equity Ratio of 2.39, also unfavorable. Market valuation ratios such as PE at 10.91 are favorable, but overall, the financial ratios lean slightly unfavorable with half rated neutral.
Shareholder Return Policy
United Airlines Holdings, Inc. does not pay dividends, reflecting its reinvestment strategy amid ongoing leverage and capital expenditure demands. The company does not currently engage in share buybacks, focusing cash flow on operations and debt servicing.
This approach aligns with a growth and recovery phase, prioritizing long-term value over immediate shareholder payouts. However, high leverage and limited liquidity pose risks, making sustained value creation contingent on improving financial stability and free cash flow generation.
Score analysis
The radar chart below presents key financial scores for United Airlines Holdings, Inc., highlighting strengths and weaknesses across valuation and profitability metrics:
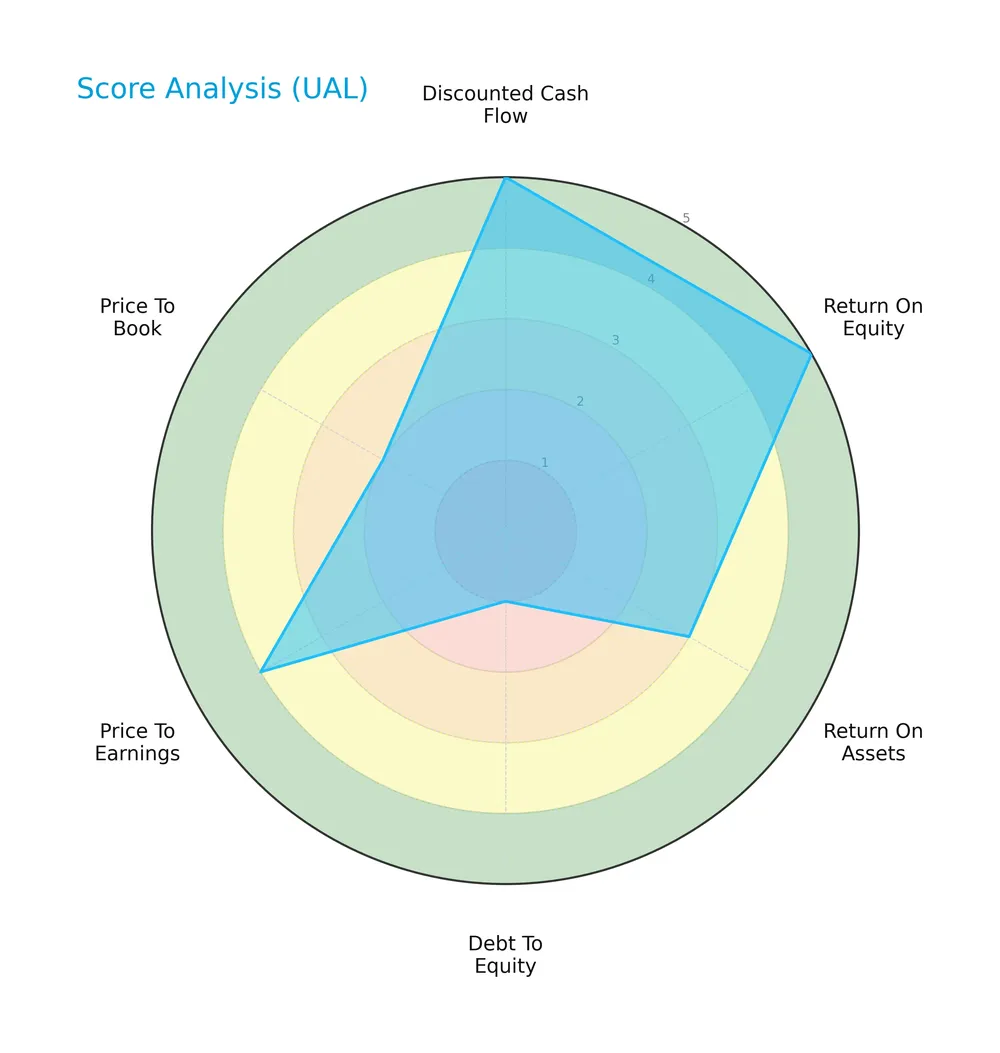
The company scores very favorably in discounted cash flow and return on equity, indicating strong profit generation potential. Return on assets is moderate, suggesting average efficiency. However, the debt-to-equity score is very unfavorable, pointing to high leverage risk. Price-to-earnings is favorable, while price-to-book remains unfavorable.
Analysis of the company’s bankruptcy risk
United Airlines currently resides in the distress zone according to its Altman Z-Score, signaling a high risk of financial distress and potential bankruptcy:

Is the company in good financial health?
The Piotroski Score diagram below summarizes the company’s financial health based on profitability, leverage, and efficiency indicators:

With a score of 6, United Airlines demonstrates average financial strength. This suggests decent operational performance but leaves room for improvement in areas such as balance sheet stability and cash flow quality.
Competitive Landscape & Sector Positioning
This analysis explores United Airlines Holdings, Inc.’s strategic positioning, revenue segments, and key products within the airline industry. I will assess whether United Airlines holds a competitive advantage over its main competitors.
Strategic Positioning
United Airlines focuses primarily on passenger air transportation, generating over $51B in 2024, with cargo contributing $1.7B. Its geographic exposure is diversified across North America, Atlantic, Pacific, Latin America, and broader international markets, reflecting a broad global footprint.
Revenue by Segment
This pie chart illustrates United Airlines Holdings’ revenue breakdown by segment, focusing on passenger and cargo revenues for the fiscal year 2024.
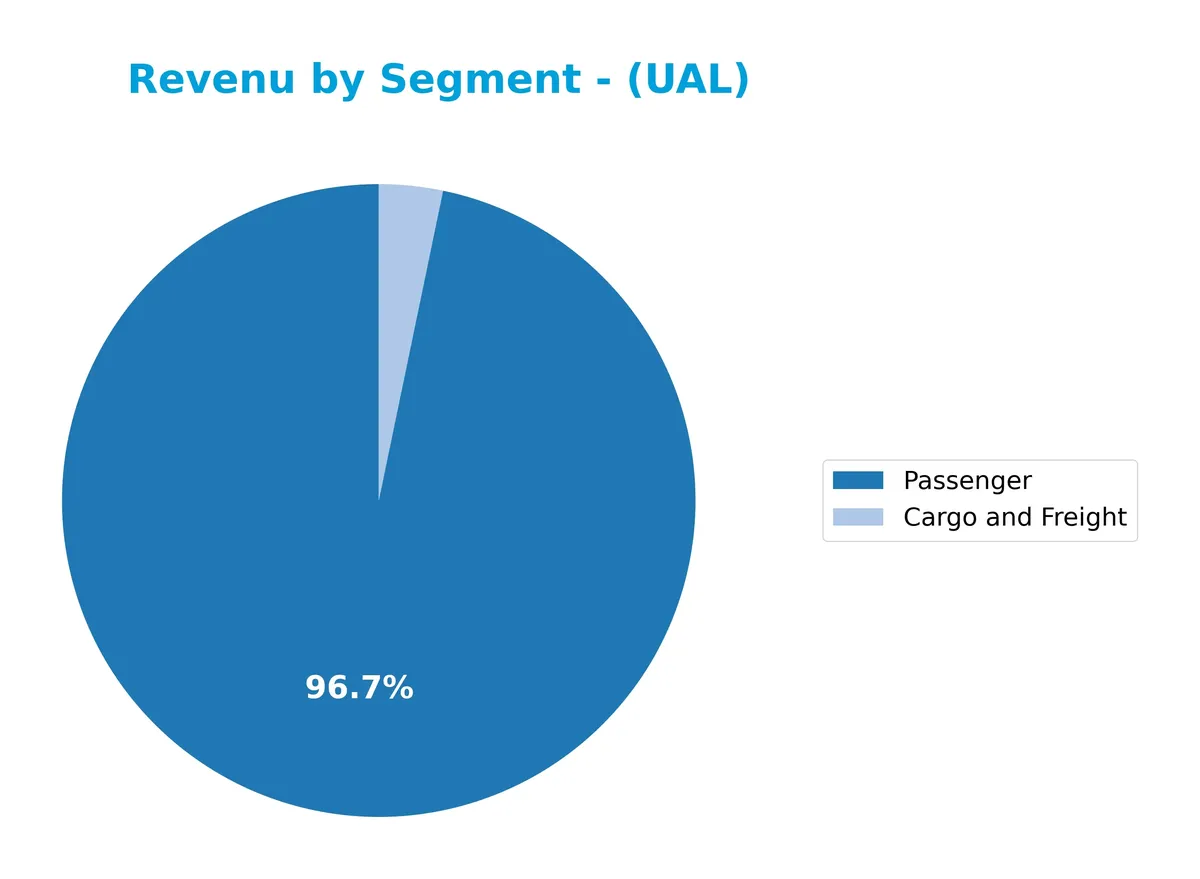
Passenger revenue dominates United Airlines’ business, reaching $51.8B in 2024, up from $49.0B in 2023. Cargo and freight contribute $1.74B, a smaller but steady portion. The passenger segment shows strong recovery and growth since the pandemic lows in 2020, reflecting robust demand. Cargo revenue fluctuates more, indicating sensitivity to logistics trends. The business remains highly concentrated in passenger transport, posing potential risk if travel demand weakens.
Key Products & Brands
United Airlines generates revenue primarily through its passenger and cargo services, detailed as follows:
| Product | Description |
|---|---|
| Passenger | Air transportation services for people across North America, Asia, Europe, Africa, Pacific, Middle East, and Latin America. |
| Cargo and Freight | Transportation of goods via mainline and regional fleets, supporting global logistics needs. |
United Airlines relies chiefly on passenger transport, contributing over $51B in 2024, with cargo and freight providing additional revenue of $1.7B. This mix underscores its dual focus on passenger travel and freight logistics.
Main Competitors
The sector includes 3 competitors, with the table listing the top 3 leaders by market capitalization:
| Competitor | Market Cap. |
|---|---|
| Delta Air Lines, Inc. | 45B |
| United Airlines Holdings, Inc. | 36.6B |
| Southwest Airlines Co. | 21.4B |
United Airlines Holdings, Inc. ranks 2nd among 3 competitors. Its market cap is 78% of the top player, Delta Air Lines. United stands above the average market cap of the top 10 but below the median for the sector. It has a 27% lead over the next competitor above it.
Comparisons with competitors
Check out how we compare the company to its competitors:
Does UAL have a competitive advantage?
United Airlines Holdings, Inc. currently does not demonstrate a clear competitive advantage, as its ROIC remains below WACC, indicating value is being shed. However, the company’s ROIC has shown strong growth, signaling improving profitability.
Looking ahead, United benefits from expanding international revenues, notably in Atlantic and Pacific markets, with opportunities to leverage its extensive network and diversified services. Continued margin improvements and fleet optimization may further enhance its competitive positioning.
SWOT Analysis
This analysis highlights United Airlines Holdings, Inc.’s key strategic factors impacting its competitive position and future growth.
Strengths
- strong revenue growth over 5 years
- improving profitability metrics
- extensive global network
Weaknesses
- low current and quick ratios indicate liquidity risk
- high debt-to-equity ratio
- negative Altman Z-score signals financial distress
Opportunities
- expanding international routes
- rising demand for air travel post-pandemic
- potential to improve operational efficiency
Threats
- volatile fuel prices
- intense competition in the airline industry
- economic downturns impacting travel demand
United Airlines shows solid growth and improving profitability but must address liquidity and leverage concerns. Its global reach offers expansion potential, yet industry risks require vigilant capital management.
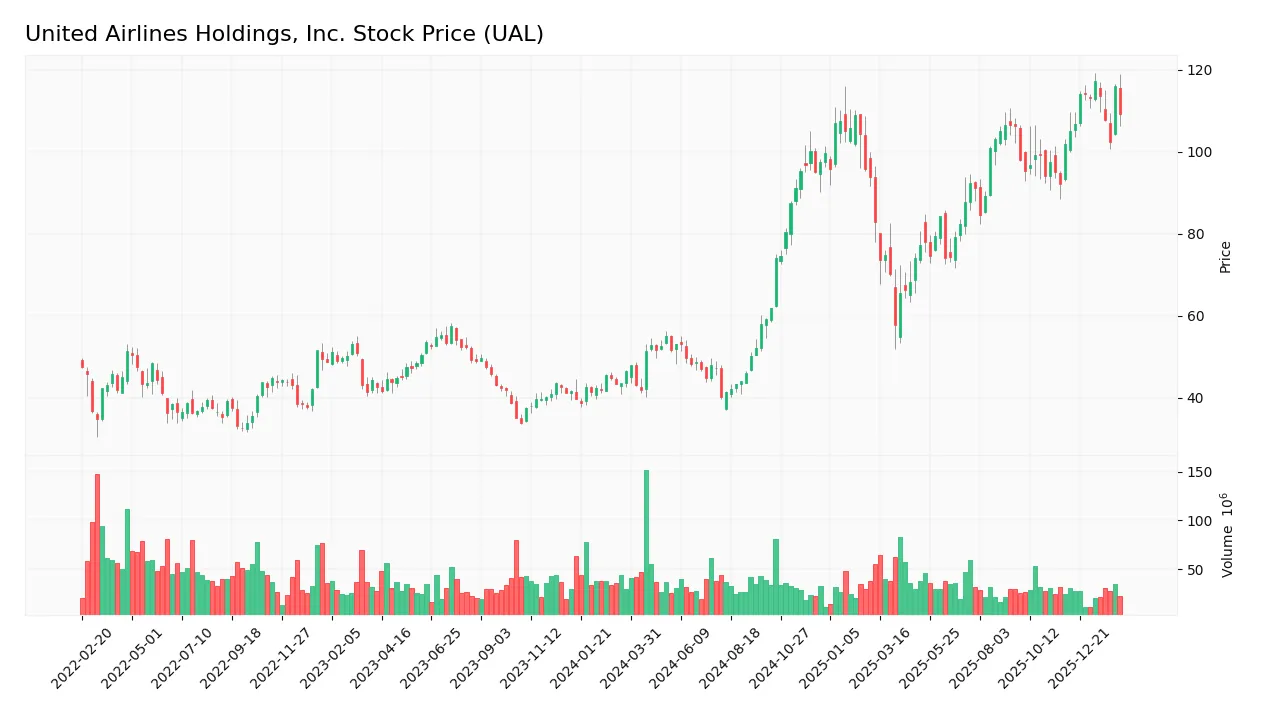
Stock Price Action Analysis
The weekly stock chart below illustrates United Airlines Holdings, Inc.’s price movements over the past 100 weeks, highlighting key fluctuations and trend shifts:
Trend Analysis
Over the past 12 months, UAL’s stock rose 135.21%, confirming a bullish trend with decelerating momentum. The price ranged from a low of 40.19 to a high of 117.32. Volatility remains elevated with a standard deviation of 23.58%, reflecting notable price swings amid the strong upward move.
Volume Analysis
Trading volume shows a decreasing trend despite buyer dominance at 63.31% overall. In the recent three months, buyers controlled 60.94% of activity, with volumes declining. This suggests cautious investor participation, favoring accumulation but with tempered enthusiasm.
Target Prices
Analysts present a firm target price consensus for United Airlines Holdings, Inc. reflecting moderate optimism.
| Target Low | Target High | Consensus |
|---|---|---|
| 110 | 150 | 136.5 |
The target prices indicate expectations for a solid upside, with a consensus suggesting a potential 10-20% gain from current levels.

Don’t Let Luck Decide Your Entry Point
Optimize your entry points with our advanced ProRealTime indicators. You’ll get efficient buy signals with precise price targets for maximum performance. Start outperforming now!
Analyst & Consumer Opinions
This section examines United Airlines Holdings, Inc.’s recent analyst ratings alongside consumer feedback and satisfaction metrics.
Stock Grades
Here is the latest verified grading summary for United Airlines Holdings, Inc. from leading financial firms:
| Grading Company | Action | New Grade | Date |
|---|---|---|---|
| Argus Research | Maintain | Buy | 2026-01-22 |
| UBS | Maintain | Buy | 2026-01-22 |
| TD Cowen | Maintain | Buy | 2026-01-22 |
| Goldman Sachs | Maintain | Buy | 2026-01-13 |
| Barclays | Maintain | Overweight | 2026-01-12 |
| Susquehanna | Maintain | Positive | 2026-01-09 |
| TD Cowen | Maintain | Buy | 2026-01-07 |
| Citigroup | Maintain | Buy | 2026-01-07 |
| UBS | Maintain | Buy | 2026-01-06 |
| B of A Securities | Maintain | Buy | 2026-01-06 |
The consensus among top-tier analysts remains positive, with a strong bias toward Buy ratings. Notably, all firms maintained their previous ratings, indicating steady confidence in the stock’s outlook.
Consumer Opinions
United Airlines Holdings, Inc. elicits strong emotions from travelers, reflecting both loyalty and frustration.
| Positive Reviews | Negative Reviews |
|---|---|
| Friendly and helpful flight attendants | Frequent delays and cancellations |
| Competitive pricing on domestic routes | Poor customer service responsiveness |
| Modernized fleet with improved in-flight amenities | Overbooked flights leading to inconveniences |
Overall, United Airlines impresses with attentive staff and competitive fares. However, operational inconsistencies and service delays remain persistent challenges that investors should watch closely.
Risk Analysis
Below is a summary table highlighting key risks United Airlines faces, focusing on likelihood and potential impact:
| Category | Description | Probability | Impact |
|---|---|---|---|
| Financial Health | Altman Z-Score in distress zone signals bankruptcy risk | High | High |
| Liquidity | Low current ratio (0.65) and quick ratio (0.59) indicate weak short-term liquidity | High | Medium |
| Leverage | Debt-to-equity ratio of 2.39 reflects high financial leverage | Medium | High |
| Market Volatility | Beta of 1.26 suggests stock price is more volatile than market | Medium | Medium |
| Dividend Policy | No dividend yield may deter income-focused investors | Medium | Low |
The most pressing risk is financial distress, with an Altman Z-Score of 1.36 placing United Airlines in the distress zone. Combined with poor liquidity ratios and heavy leverage, this raises red flags about short-term solvency. Market volatility also adds uncertainty amid global economic fluctuations. Investors must weigh these risks carefully.
Should You Buy United Airlines Holdings, Inc.?
United Airlines appears to be improving profitability with growing ROIC but lacks a durable competitive moat. Despite significant leverage and a low current ratio, its overall rating of A- suggests a cautiously favorable value creation profile amid financial distress signals.
Strength & Efficiency Pillars
United Airlines Holdings, Inc. posts a solid net margin of 5.68% and a favorable return on equity of 21.94%, signaling operational competence. Its ROIC stands at 6.55%, slightly above the WACC of 6.18%, positioning the company as a modest value creator. This margin efficiency, combined with a growing ROIC trend, reflects improving profitability despite sector headwinds. Historically, airlines face volatile cycles, but these metrics suggest United is enhancing capital returns in a challenging environment.
Weaknesses and Drawbacks
The company resides in the Altman Z-Score distress zone with a low score of 1.36, signaling significant bankruptcy risk. This financial distress overshadows operational gains and heightens solvency concerns. Additionally, leverage is notably high with a debt-to-equity ratio of 2.39, paired with weak liquidity ratios—current ratio at 0.65 and quick ratio at 0.59—indicating potential short-term cash flow strain. Such structural imbalances elevate the risk profile considerably.
Our Final Verdict about United Airlines Holdings, Inc.
Despite operational margins and improving ROIC, United Airlines faces a critical solvency risk due to its distressed Altman Z-Score. This risk renders the investment highly speculative and potentially unsuitable for conservative capital. Investors might consider waiting for clear financial stabilization before increasing exposure, as the current profile suggests elevated risk despite positive growth signals.
Disclaimer: This content is for informational purposes only and does not constitute financial, investment, or other professional advice. Investing in financial markets involves a significant risk of loss, and past performance is not indicative of future results.
Additional Resources
- Wealthfront Advisers LLC Buys 9,039 Shares of United Airlines Holdings Inc $UAL – MarketBeat (Feb 12, 2026)
- Why United Airlines (UAL) is a Top Momentum Stock for the Long-Term – Yahoo Finance (Feb 10, 2026)
- United Airlines price gathers positive momentum – Forecast today – 12-02-2026 – Economies.com (Feb 12, 2026)
- Book United or JetBlue flights in one place, with cash or miles – Stock Titan (Feb 10, 2026)
- United Airlines Surge 9%: Why Analysts Expect $140 in 2026 – TIKR.com (Feb 09, 2026)
For more information about United Airlines Holdings, Inc., please visit the official website: united.com