Home > Analyses > Industrials > Union Pacific Corporation
Union Pacific drives the backbone of American commerce, linking coast to coast through an expansive rail network. It commands the U.S. railroad sector with unmatched scale, transporting everything from grain to finished automobiles. Known for operational efficiency and innovation, Union Pacific shapes supply chains critical to daily life. As market dynamics evolve, I ask: does Union Pacific’s robust infrastructure and industry moat still justify its premium valuation and growth outlook?

Table of contents
Business Model & Company Overview
Union Pacific Corporation, founded in 1862 and headquartered in Omaha, Nebraska, commands a dominant position in the U.S. railroad sector. Through its subsidiary, Union Pacific Railroad Company, it operates an extensive rail network spanning 32,452 route miles. This infrastructure connects key Pacific and Gulf Coast ports to the Midwest and East, forming a cohesive logistics ecosystem that supports diverse industries from agriculture to automotive.
The company’s revenue engine balances freight transportation across multiple commodity groups, including grain, petroleum, chemicals, and finished goods. Its strategic footprint covers vital corridors in the Americas, linking major economic hubs. Union Pacific’s economic moat lies in its vast infrastructure and integrated service offerings, which shape the future of U.S. freight transportation with enduring competitive advantages.
Financial Performance & Fundamental Metrics
I analyze Union Pacific Corporation’s income statement, key financial ratios, and dividend payout policy to assess its core profitability and shareholder value.
Income Statement
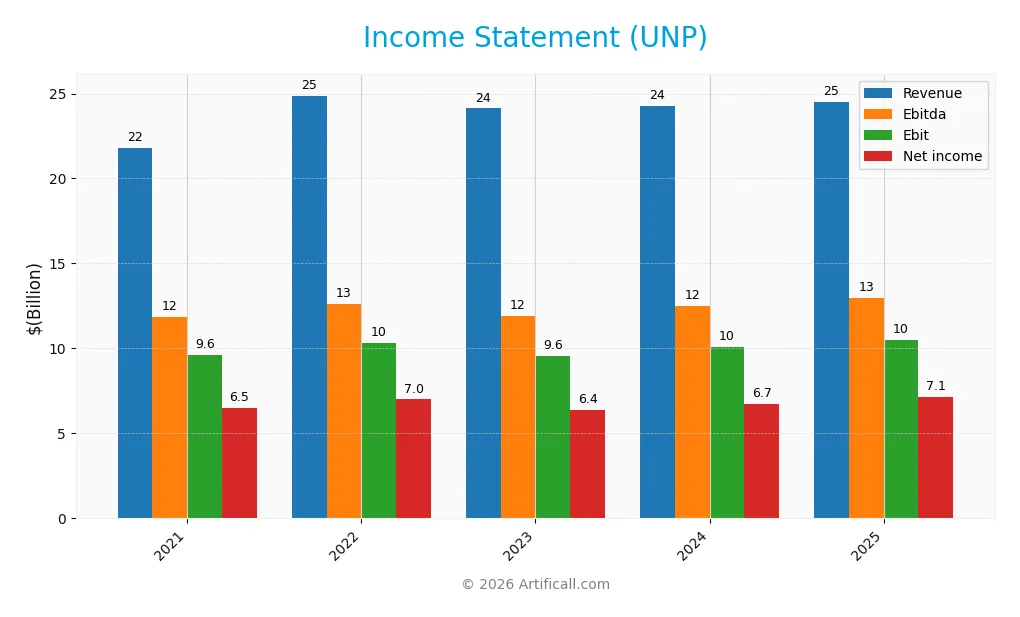
The table below summarizes Union Pacific Corporation’s key income statement items for fiscal years 2021 through 2025, reflecting revenue growth and profitability trends over time.
| 2021 | 2022 | 2023 | 2024 | 2025 | |
|---|---|---|---|---|---|
| Revenue | 21.8B | 24.9B | 24.1B | 24.3B | 24.5B |
| Cost of Revenue | 11.3B | 13.7B | 13.6B | 13.2B | 10.0B |
| Operating Expenses | 1.2B | 1.3B | 1.4B | 1.3B | 4.7B |
| Gross Profit | 10.5B | 11.2B | 10.5B | 11.0B | 14.6B |
| EBITDA | 11.8B | 12.6B | 11.9B | 12.5B | 12.9B |
| EBIT | 9.6B | 10.3B | 9.6B | 10.1B | 10.5B |
| Interest Expense | 1.2B | 1.3B | 1.3B | 1.3B | 1.3B |
| Net Income | 6.5B | 7.0B | 6.4B | 6.7B | 7.1B |
| EPS | 9.98 | 11.24 | 10.47 | 11.10 | 12.01 |
| Filing Date | 2022-02-04 | 2023-02-10 | 2024-02-09 | 2025-02-07 | 2026-01-27 |
Income Statement Evolution
From 2021 to 2025, Union Pacific’s revenue rose 12.4%, showing steady expansion. Net income grew 9.4% over the same period, reflecting solid profitability. Gross margin held strong around 59%, supporting a favorable EBIT margin near 43%. However, net margin contracted slightly by 2.7%, indicating some margin pressure despite top-line growth.
Is the Income Statement Favorable?
In 2025, fundamentals remain generally favorable. Revenue increased modestly by 1.1%, while gross profit surged 31.8%, highlighting improved cost efficiency. EBIT grew 4.1%, maintaining a robust margin of 42.7%. Interest expense is neutral at 5.3% of revenue, and net margin expanded slightly to 29.1%. EPS growth of 7.9% signals effective capital allocation and operational strength.
Financial Ratios
The table below summarizes key financial ratios for Union Pacific Corporation from 2021 to 2025, offering a snapshot of profitability, valuation, liquidity, leverage, efficiency, and dividend metrics:
| Ratios | 2021 | 2022 | 2023 | 2024 | 2025 |
|---|---|---|---|---|---|
| Net Margin | 30.0% | 28.1% | 26.4% | 27.8% | 29.1% |
| ROE | 46.1% | 57.5% | 43.1% | 39.9% | 38.7% |
| ROIC | 11.9% | 12.4% | 11.0% | 11.6% | 11.7% |
| P/E | 25.3 | 18.4 | 23.5 | 20.5 | 19.2 |
| P/B | 11.6 | 10.6 | 10.1 | 8.2 | 7.4 |
| Current Ratio | 0.62 | 0.72 | 0.81 | 0.77 | 0.91 |
| Quick Ratio | 0.51 | 0.58 | 0.67 | 0.62 | 0.91 |
| D/E | 2.22 | 2.87 | 2.31 | 1.92 | 1.72 |
| Debt-to-Assets | 49.6% | 53.4% | 50.9% | 47.9% | 45.6% |
| Interest Coverage | 8.07 | 7.80 | 6.78 | 7.65 | 7.52 |
| Asset Turnover | 0.34 | 0.38 | 0.36 | 0.36 | 0.35 |
| Fixed Asset Turnover | 0.39 | 0.44 | 0.41 | 0.41 | 0.41 |
| Dividend Yield | 1.70% | 2.45% | 2.12% | 2.32% | 2.35% |
Evolution of Financial Ratios
Union Pacific’s Return on Equity (ROE) has shown volatility, peaking near 57.5% in 2022 and settling at 38.6% in 2025, indicating strong but fluctuating profitability. The Current Ratio improved from 0.62 in 2021 to 0.91 in 2025, yet remains below 1, signaling persistent liquidity constraints. Debt-to-Equity declined from 2.87 in 2022 to 1.72 in 2025, reflecting gradual deleveraging.
Are the Financial Ratios Favorable?
Profitability ratios are largely favorable, with a 29.1% net margin and 11.7% ROIC exceeding the 7.5% WACC, signaling value creation. Liquidity ratios show mixed signals: a below-1 current ratio is unfavorable, while the quick ratio is neutral. Leverage remains high with a 1.72 debt-to-equity ratio. Market multiples reveal a neutral P/E but an unfavorable P/B of 7.42. Overall, the ratios are slightly favorable amid efficiency and leverage concerns.
Shareholder Return Policy
Union Pacific maintains a consistent dividend payout ratio around 45%, with dividends per share rising steadily to $5.44 in 2025. The annual dividend yield hovers near 2.35%, supported by free cash flow coverage, complemented by share buybacks that enhance shareholder value.
This balanced approach reflects a sustainable distribution policy. The payout ratio appears prudent, avoiding excessive leverage despite moderate debt levels. Combined dividend payments and buybacks align with long-term value creation, mitigating risks of unsustainable cash outflows in a capital-intensive sector.
Score analysis
Here is a radar chart depicting key valuation and financial performance scores for Union Pacific Corporation:
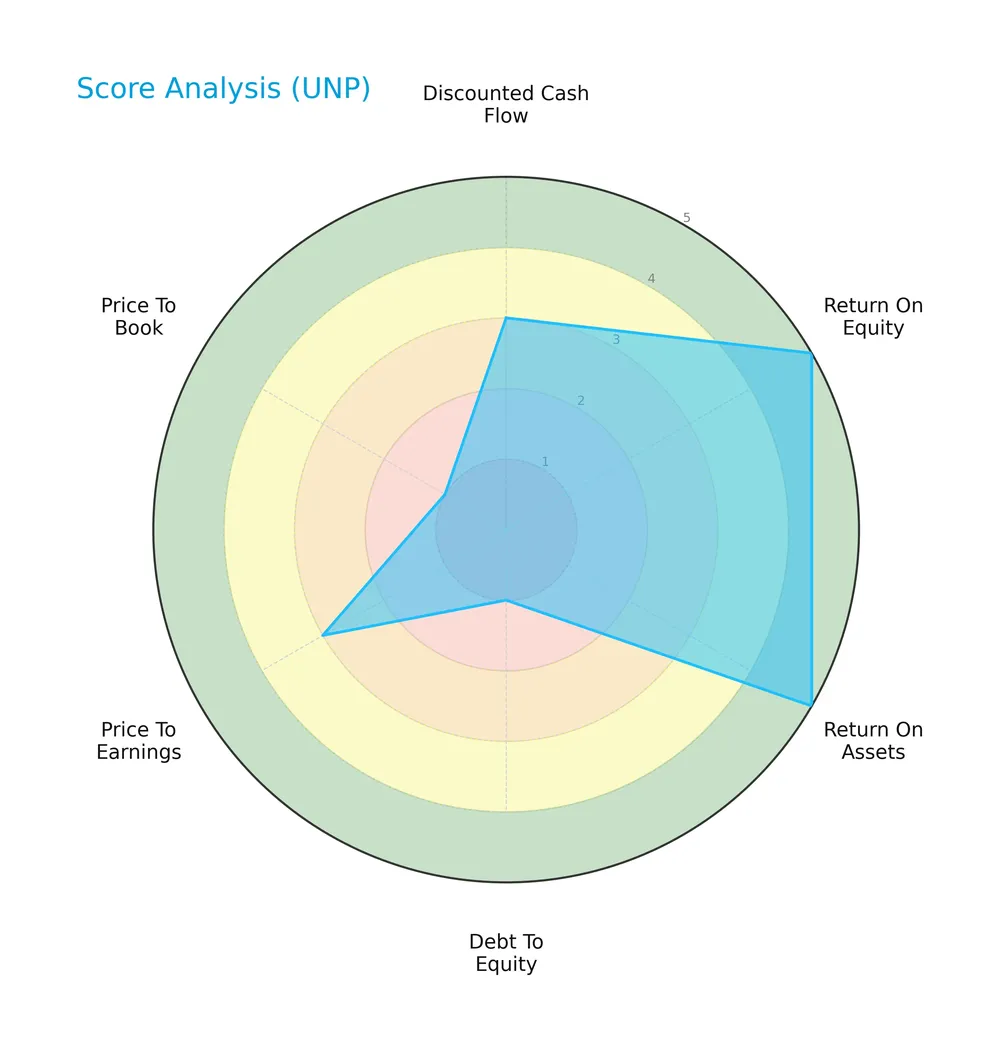
Union Pacific scores very favorably on return on equity and return on assets, reflecting operational efficiency. However, the debt-to-equity and price-to-book scores are very unfavorable, indicating leverage concerns and possible undervaluation or balance sheet weaknesses. Other metrics show moderate performance.
Analysis of the company’s bankruptcy risk
The Altman Z-Score places Union Pacific in the grey zone, suggesting a moderate risk of financial distress and potential bankruptcy:

Is the company in good financial health?
The Piotroski Score diagram illustrates Union Pacific’s solid financial strength:

With a Piotroski Score of 7, Union Pacific demonstrates strong financial health, signaling good profitability, liquidity, and operational efficiency relative to typical benchmarks.
Competitive Landscape & Sector Positioning
This analysis explores Union Pacific Corporation’s strategic positioning within the railroad sector, focusing on its business structure and market stance. I will assess whether Union Pacific holds a competitive advantage over its main rivals.
Strategic Positioning
Union Pacific maintains a concentrated geographic focus on the US, generating over 88% of 2023 revenues domestically, with Mexico as a smaller secondary market. Its product portfolio spans multiple freight categories, including bulk, industrial, and premium segments, reflecting moderate diversification within rail transportation.
Revenue by Segment
The pie chart illustrates Union Pacific Corporation’s revenue distribution by segment for the full fiscal year 2024, highlighting the company’s core business areas and their relative contributions.
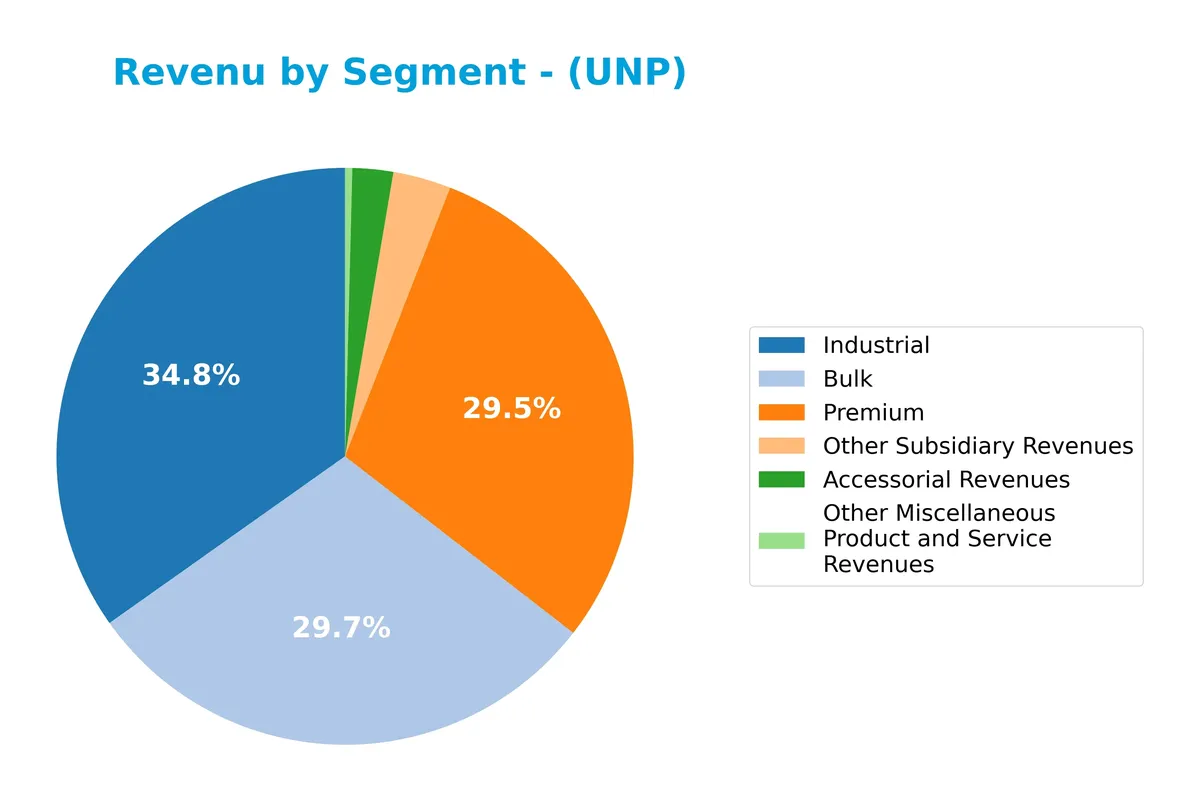
In 2024, Industrial leads with $8.44B, followed closely by Bulk at $7.21B and Premium at $7.16B. Accessorial and Other Subsidiary Revenues remain smaller but stable. The steady growth in Industrial and Premium segments reflects solid demand, while Bulk shows a slight decline, signaling moderate shifts in Union Pacific’s revenue concentration and potential exposure to commodity cycles.
Key Products & Brands
Union Pacific Corporation’s revenue streams reflect its diverse rail transportation offerings as follows:
| Product | Description |
|---|---|
| Bulk | Transportation of bulk commodities such as coal, grain, and other raw materials. |
| Industrial | Rail services for industrial goods including chemicals, construction products, and metals. |
| Premium | Premium transportation services, including intermodal containers and finished automobiles. |
| Accessorial Revenues | Additional fees from services beyond base transportation, such as handling and storage. |
| Other Subsidiary Revenues | Income from subsidiary operations not classified under main product categories. |
| Other Miscellaneous Product and Service Revenues | Various smaller revenue sources related to rail services and logistics. |
Union Pacific’s product portfolio centers on bulk and industrial freight, supported by premium services and accessorial fees. This mix leverages its extensive rail network connecting key U.S. markets.
Main Competitors
There are 4 competitors in total. The table lists the top 4 leaders by market capitalization:
| Competitor | Market Cap. |
|---|---|
| Union Pacific Corporation | 138B |
| CSX Corporation | 68B |
| Norfolk Southern Corporation | 65B |
| Westinghouse Air Brake Technologies Corporation | 37B |
Union Pacific Corporation ranks 1st among its 4 main competitors. Its market cap is 9% above the next largest rival, CSX Corporation. The company stands well above both the average market cap of the top 10 in its sector and the median market cap for railroads. The gap to the closest competitor below is significant, underscoring Union Pacific’s dominant scale.
Comparisons with competitors
Check out how we compare the company to its competitors:
Does UNP have a competitive advantage?
Union Pacific Corporation presents a competitive advantage by consistently generating returns on invested capital (ROIC) above its weighted average cost of capital (WACC), indicating value creation. However, the company shows a declining ROIC trend, signaling caution despite its favorable position.
Looking ahead, Union Pacific’s extensive rail network connecting key U.S. and Gulf ports supports steady transport demand across multiple sectors. Growth opportunities may arise from expanding intermodal services and increasing trade volumes with Mexico, enhancing future revenue streams.
SWOT Analysis
This SWOT analysis highlights Union Pacific Corporation’s core competitive position and strategic challenges.
Strengths
- strong market position in US railroads
- high ROE of 38.65%
- solid net margin of 29.12%
Weaknesses
- declining ROIC trend
- weak current ratio at 0.91
- high price-to-book ratio at 7.42
Opportunities
- expanding intermodal services
- growing US-Mexico trade volumes
- technology adoption in logistics
Threats
- economic slowdown impacting freight demand
- regulatory risks in transportation
- competition from trucking and other modes
Union Pacific’s strengths in profitability and market reach provide a solid foundation. However, liquidity issues and profitability erosion warrant caution. The company must leverage growth in intermodal transport and cross-border trade to offset external pressures.
Stock Price Action Analysis
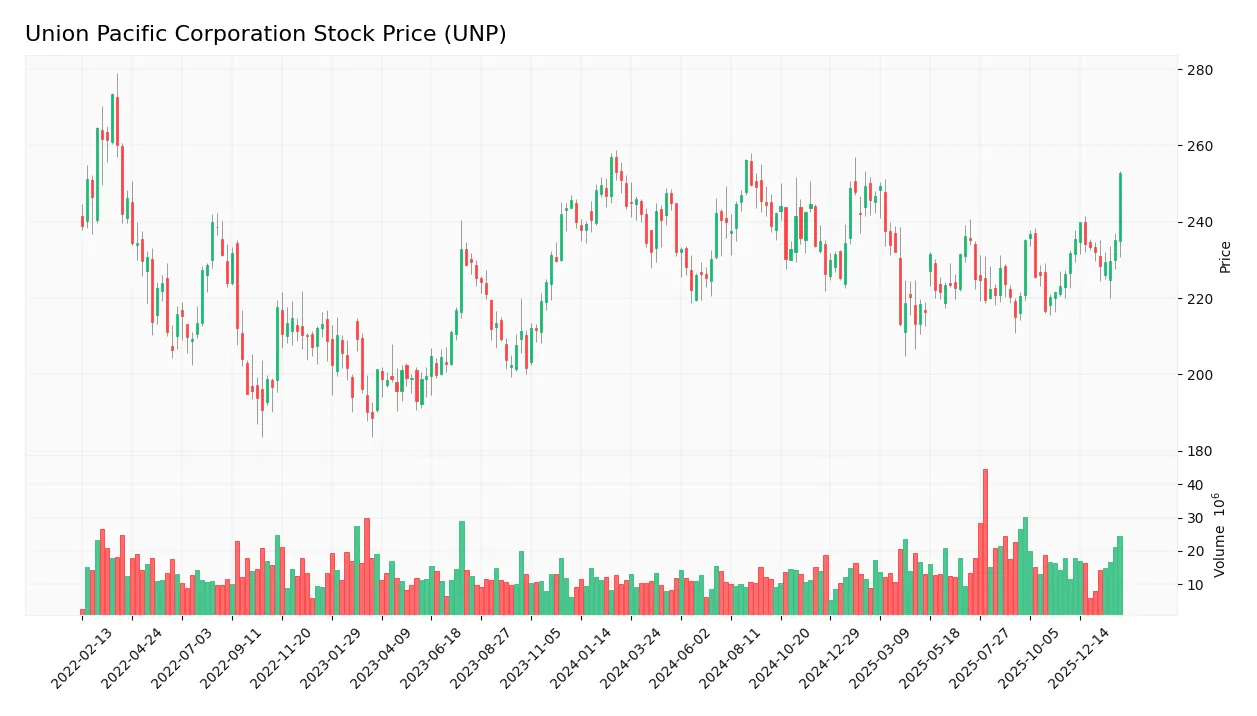
The weekly stock price chart illustrates Union Pacific Corporation’s price movements over the last 12 months, highlighting key levels and volatility patterns:
Trend Analysis
Over the past 12 months, UNP’s stock price increased by 3.48%, indicating a bullish trend with acceleration. The price ranged between 213.26 and 256.09, showing moderate volatility with a 10.1 standard deviation, confirming strong upward momentum.
Volume Analysis
Trading volume shows an increasing trend with 1.67B shares traded overall. Buyer volume dominates at 52%, intensifying to 76% in the recent period. This strongly buyer-driven activity signals rising investor confidence and robust market participation.
Target Prices
Analysts show a bullish consensus on Union Pacific Corporation’s stock price.
| Target Low | Target High | Consensus |
|---|---|---|
| 227 | 285 | 260.5 |
The target range reflects confidence in UNP’s growth potential, with a consensus price indicating a solid upside from current levels.

Don’t Let Luck Decide Your Entry Point
Optimize your entry points with our advanced ProRealTime indicators. You’ll get efficient buy signals with precise price targets for maximum performance. Start outperforming now!
Analyst & Consumer Opinions
This section examines the latest analyst ratings and consumer feedback regarding Union Pacific Corporation’s market performance and reputation.
Stock Grades
Here are the latest verified analyst grades for Union Pacific Corporation from leading financial institutions:
| Grading Company | Action | New Grade | Date |
|---|---|---|---|
| JP Morgan | Maintain | Neutral | 2026-01-28 |
| Citigroup | Maintain | Buy | 2026-01-28 |
| JP Morgan | Maintain | Neutral | 2026-01-12 |
| BMO Capital | Downgrade | Market Perform | 2026-01-07 |
| Barclays | Maintain | Overweight | 2025-12-16 |
| Deutsche Bank | Downgrade | Hold | 2025-12-11 |
| BMO Capital | Maintain | Outperform | 2025-10-24 |
| TD Cowen | Maintain | Buy | 2025-10-24 |
| JP Morgan | Maintain | Neutral | 2025-10-24 |
| Citigroup | Maintain | Buy | 2025-10-24 |
The grade trend for Union Pacific shows a tilt toward cautious optimism, with multiple Buy and Overweight ratings but some recent downgrades to Hold and Market Perform. Overall, the consensus remains positive, reflecting moderate confidence amid mixed signals.
Consumer Opinions
Union Pacific Corporation enjoys a solid reputation among its customers, reflecting its critical role in North American freight transportation.
| Positive Reviews | Negative Reviews |
|---|---|
| Reliable and timely freight delivery across major routes | Occasional delays during peak seasons |
| Strong network coverage supports diverse industries | Customer service response time can be slow |
| Efficient handling of large volumes with minimal damage | Pricing can be higher compared to some competitors |
Overall, consumers consistently praise Union Pacific’s extensive network and reliability. However, recurring concerns include seasonal delays and customer service responsiveness, signaling areas for operational improvement.
Risk Analysis
Below is a table summarizing key risks Union Pacific Corporation faces, including their likelihood and potential impact:
| Category | Description | Probability | Impact |
|---|---|---|---|
| Leverage Risk | Elevated debt-to-equity ratio (1.72) increases financial vulnerability. | High | High |
| Liquidity Risk | Current ratio below 1 (0.91) signals tight short-term liquidity. | Medium | Medium |
| Valuation Risk | High price-to-book ratio (7.42) suggests potential overvaluation. | Medium | Medium |
| Operational Risk | Asset turnover below industry benchmarks (0.35) indicates efficiency issues. | Medium | Medium |
| Market Volatility | Beta near 1 (0.987) implies stock moves closely with market swings. | Medium | Medium |
| Bankruptcy Risk | Altman Z-score in grey zone (2.52) shows moderate risk of financial distress. | Low-Medium | High |
Leverage and liquidity risks stand out as primary concerns. The company’s debt load is relatively high, raising interest and refinancing risks despite strong interest coverage. Liquidity constraints could pressure operations during downturns. While profitability metrics remain robust, valuation appears stretched versus peers, warranting caution. The Altman Z-score signals moderate financial risk, underscoring the need for careful capital allocation monitoring.
Should You Buy Union Pacific Corporation?
Union Pacific appears to be a robust operator with a durable competitive moat, though its declining ROIC signals caution. Despite a manageable leverage profile, valuation metrics seem stretched. The company’s overall B+ rating suggests a very favorable yet balanced investment profile.
Strength & Efficiency Pillars
Union Pacific Corporation exhibits robust profitability, with a net margin of 29.12% and a return on equity (ROE) of 38.65%. Its return on invested capital (ROIC) stands at 11.7%, comfortably exceeding the weighted average cost of capital (WACC) of 7.5%. This differential confirms the company as a clear value creator. Despite a slight decline in ROIC trends, operational efficiency remains strong, supported by favorable gross and EBIT margins of 59.38% and 42.74%, respectively.
Weaknesses and Drawbacks
The company’s Altman Z-Score of 2.52 places it in the Grey Zone, signaling moderate bankruptcy risk and warranting caution. Leverage is elevated, with a debt-to-equity ratio of 1.72 and a current ratio below 1 at 0.91, indicating tight liquidity. The price-to-book ratio is high at 7.42, suggesting premium valuation that may limit upside. Additionally, subpar asset turnover metrics (0.35) hint at inefficiencies in asset utilization, posing potential headwinds.
Our Final Verdict about Union Pacific Corporation
Union Pacific’s fundamental profile could appear attractive due to strong profitability and value creation. However, the Grey Zone Altman Z-Score and high leverage introduce solvency concerns that may warrant prudence. Despite a bullish overall trend and strong recent buyer dominance (76.13%), investors might consider a cautious stance, as financial risk and valuation pressures suggest a wait-and-see approach for a more favorable entry point.
Disclaimer: This content is for informational purposes only and does not constitute financial, investment, or other professional advice. Investing in financial markets involves a significant risk of loss, and past performance is not indicative of future results.
Additional Resources
- Wells Trecaso Financial Group LLC Sells 9,252 Shares of Union Pacific Corporation $UNP – MarketBeat (Feb 06, 2026)
- Union Pacific (UNP) Declares $1.38 Quarterly Dividend – GuruFocus (Feb 06, 2026)
- 127 years of payouts: Union Pacific sets $1.38 quarterly dividend – stocktitan.net (Feb 05, 2026)
- BMO Cuts Union Pacific (UNP) Target Amid Merger Concerns – Yahoo Finance (Jan 20, 2026)
- Union Pacific Faces Union Pushback As Norfolk Southern Deal Clouds Outlook – Sahm (Feb 03, 2026)
For more information about Union Pacific Corporation, please visit the official website: up.com