Home > Analyses > Consumer Defensive > Unilever PLC
Unilever shapes daily life through its vast portfolio of trusted household and personal care brands. From Dove’s skincare to Ben & Jerry’s ice cream, it defines quality and innovation in fast-moving consumer goods. The company commands global market influence with a diversified product mix spanning beauty, foods, and home care. As 2026 unfolds, I question whether Unilever’s solid fundamentals still justify its premium valuation and growth prospects in a competitive sector.
Table of contents
Business Model & Company Overview
Unilever PLC, founded in 1894 and headquartered in London, stands as a global leader in the Household & Personal Products sector. Its diverse portfolio spans Beauty & Personal Care, Foods & Refreshment, and Home Care, forming a cohesive ecosystem of trusted brands like Dove, Knorr, and Ben & Jerry’s. This broad product mix underpins Unilever’s dominant market position and reflects its core mission to enhance everyday life worldwide.
The company’s revenue engine balances recurring sales from consumables with strategic exposure across the Americas, Europe, and Asia. Its blend of food products, personal care items, and cleaning solutions generates steady cash flow, supported by strong brand loyalty. Unilever’s enduring competitive advantage lies in its expansive global footprint and ability to innovate within fast-moving consumer goods, securing a resilient economic moat in a highly competitive industry.
Financial Performance & Fundamental Metrics
I will analyze Unilever PLC’s income statement, key financial ratios, and dividend payout policy to evaluate its core financial health and shareholder returns.
Income Statement
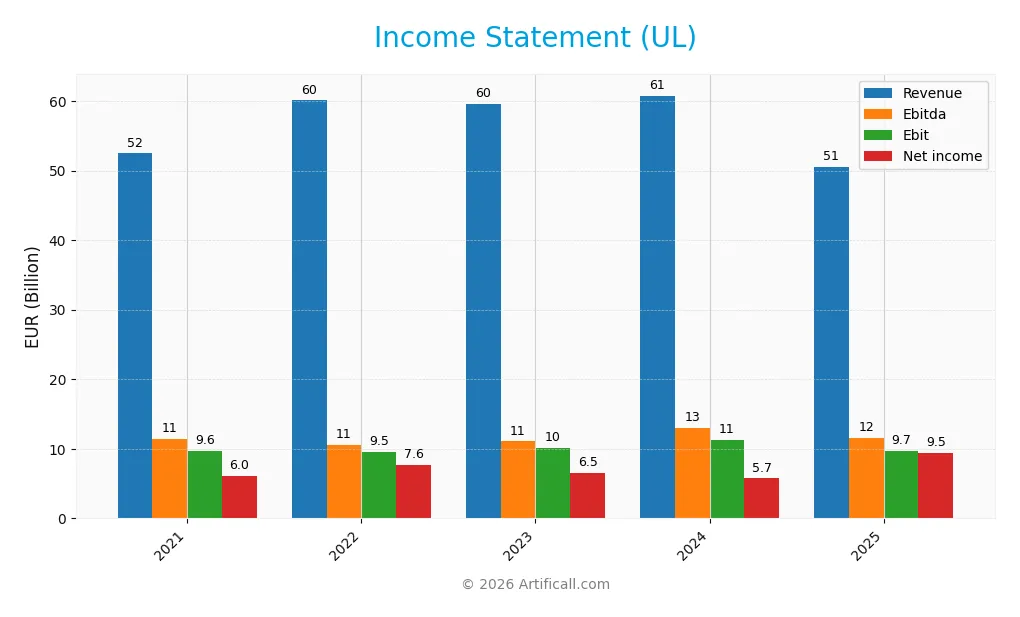
This table summarizes Unilever PLC’s key income statement figures for the fiscal years 2021 through 2025, reported in euros.
| 2021 | 2022 | 2023 | 2024 | 2025 | |
|---|---|---|---|---|---|
| Revenue | 52.4B | 60.1B | 59.6B | 60.8B | 50.5B |
| Cost of Revenue | 30.3B | 35.9B | 34.4B | 0 | 26.8B |
| Operating Expenses | 13.5B | 13.4B | 15.4B | 51.4B | 13.6B |
| Gross Profit | 22.2B | 24.2B | 25.2B | 60.8B | 50.5B |
| EBITDA | 11.4B | 10.6B | 11.1B | 13.0B | 11.5B |
| EBIT | 9.6B | 9.5B | 10.1B | 11.3B | 9.7B |
| Interest Expense | 498M | 789M | 1.08B | 1.12B | 984M |
| Net Income | 6.0B | 7.6B | 6.5B | 5.7B | 9.5B |
| EPS | 2.33 | 3.00 | 2.58 | 2.30 | 2.68 |
| Filing Date | 2022-03-09 | 2023-03-13 | 2024-03-14 | 2025-03-13 | 2026-03-12 |
Income Statement Evolution
Between 2021 and 2025, Unilever’s revenue declined by 3.7%, reflecting a slowdown in top-line growth. Despite this, net income surged 56.5%, driven by a 62.6% expansion in net margin. The gross margin held steady at 100%, while EBIT margin remained favorable at 19.2%, indicating improved profitability amid shrinking revenue.
Is the Income Statement Favorable?
In 2025, Unilever reported revenue of 50.5B EUR, down 16.9% from 2024, yet net income climbed 64.9% to 9.5B EUR. The net margin of 18.8% and EBIT margin near 19.2% remain strong. Interest expense at 1.95% of revenue is manageable. Overall, the income statement fundamentals appear favorable, supported by solid margin expansion despite revenue pressure.
Financial Ratios
The following table summarizes Unilever PLC’s key financial ratios for the fiscal years 2021 through 2025, providing an overview of profitability, liquidity, leverage, and valuation metrics:
| Ratios | 2021 | 2022 | 2023 | 2024 | 2025 |
|---|---|---|---|---|---|
| Net Margin | 11.5% | 12.7% | 10.9% | 9.5% | 18.7% |
| ROE | 35.4% | 40.2% | 35.8% | 28.7% | 61.0% |
| ROIC | 11.7% | 14.8% | 13.2% | 11.1% | 12.6% |
| P/E | 23.0 | 17.7 | 19.3 | 26.9 | 12.8 |
| P/B | 8.1 | 7.1 | 6.9 | 7.7 | 7.8 |
| Current Ratio | 0.70 | 0.75 | 0.76 | 0.76 | 0.79 |
| Quick Ratio | 0.51 | 0.52 | 0.54 | 0.56 | 0.60 |
| D/E | 1.73 | 1.50 | 1.58 | 1.53 | 1.91 |
| Debt-to-Assets | 39.5% | 36.5% | 38.0% | 38.4% | 42.0% |
| Interest Coverage | 17.5x | 13.6x | 9.1x | 8.4x | 9.2x |
| Asset Turnover | 0.70 | 0.77 | 0.79 | 0.76 | 0.72 |
| Fixed Asset Turnover | 5.1 | 5.6 | 5.6 | 5.2 | 5.6 |
| Dividend Yield | 3.2% | 3.2% | 3.5% | 2.8% | 3.5% |
Evolution of Financial Ratios
Unilever’s Return on Equity (ROE) surged sharply to 61.0% in 2025, reflecting a significant profit boost. The Current Ratio showed modest improvement but remained below 1.0, indicating persistent liquidity constraints. Debt-to-Equity Ratio increased to 1.91, signaling higher leverage and potential risk in capital structure stability.
Are the Financial Ratios Fovorable?
In 2025, profitability measures like net margin (18.75%) and ROE (61.0%) are notably favorable, outpacing sector averages. Liquidity ratios, including a current ratio of 0.79 and quick ratio of 0.60, remain unfavorable, suggesting tight short-term financial flexibility. Leverage appears elevated with a debt-to-equity of 1.91. Market valuation metrics are mixed; P/E is attractive at 12.84, but the price-to-book ratio is high at 7.83. Overall, 57% of ratios favorably support the company’s financial health.
Shareholder Return Policy
Unilever PLC maintains a consistent dividend policy with a payout ratio near 45% in 2025 and a dividend yield of approximately 3.5%. Dividends are well covered by free cash flow, supported by a dividend and capex coverage ratio above 1.3.
The company also engages in share buybacks, complementing dividend payments. This balanced approach suggests a sustainable shareholder return framework that aligns with long-term value creation, assuming stable cash generation continues.
Score analysis
Here is a radar chart presenting Unilever PLC’s key financial scores for a comprehensive view of its valuation and profitability metrics:
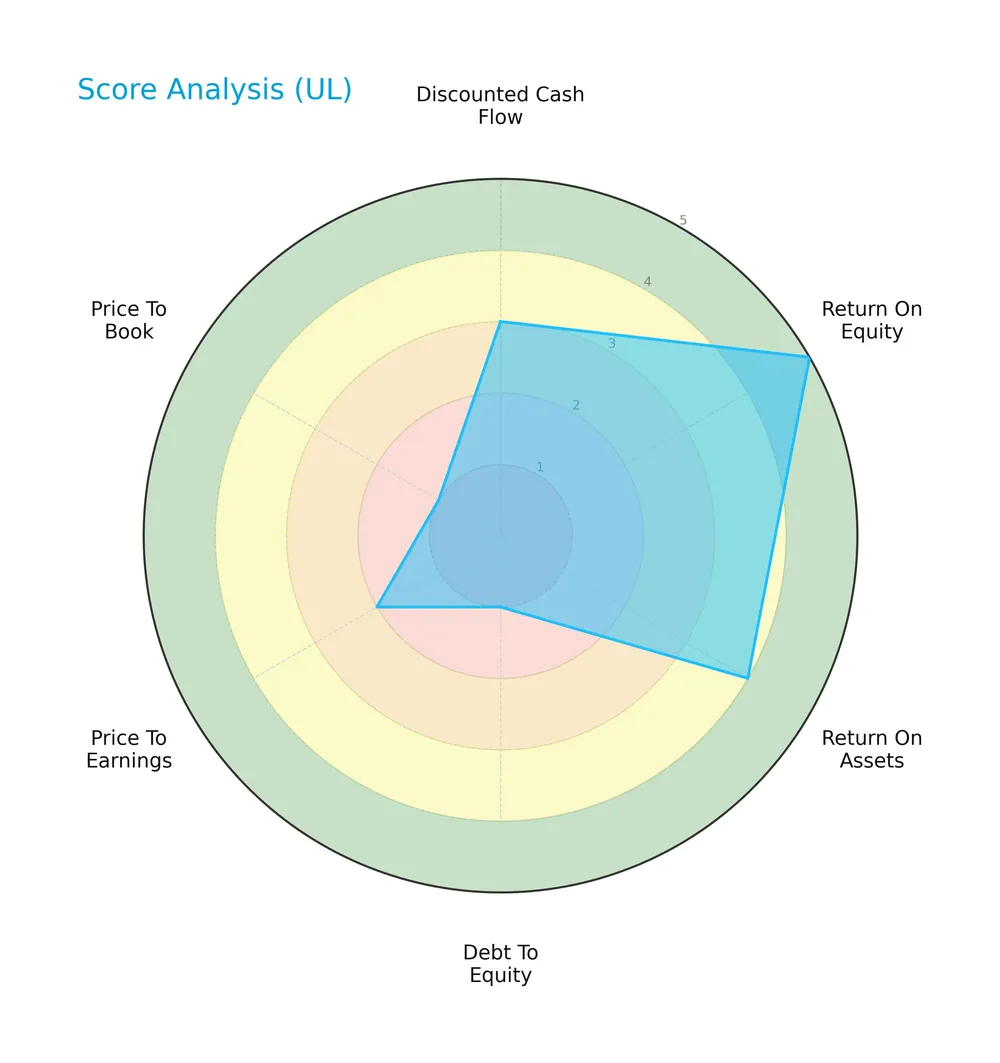
Unilever shows strong return on equity (5) and return on assets (4), indicating efficient use of capital. However, its debt-to-equity (1), price-to-earnings (2), and price-to-book (1) scores reveal valuation and leverage concerns.
Analysis of the company’s bankruptcy risk
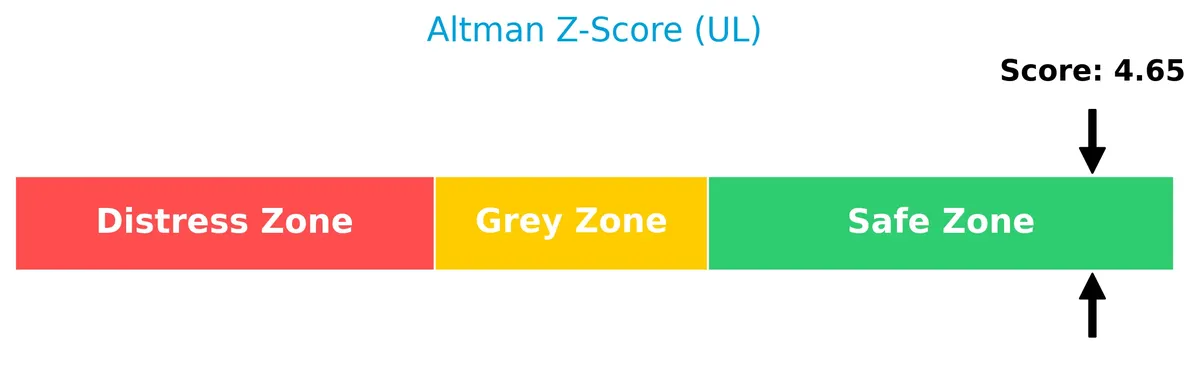
The Altman Z-Score places Unilever comfortably in the safe zone, signaling low bankruptcy risk and solid financial stability:
Is the company in good financial health?
The Piotroski Score highlights Unilever’s strong financial health based on profitability, leverage, and efficiency criteria:
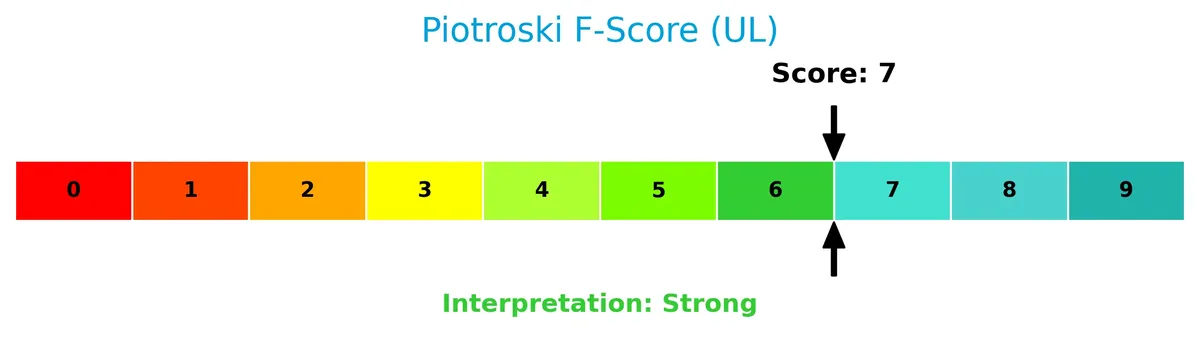
A score of 7 suggests the company maintains robust fundamentals, reflecting well-managed operations and prudent capital allocation.
Competitive Landscape & Sector Positioning
This analysis examines Unilever PLC’s strategic positioning, revenue segments, key products, and main competitors. I will assess whether Unilever holds a competitive advantage over its peers in the consumer defensive sector.
Strategic Positioning
Unilever PLC maintains a diversified portfolio across Beauty & Personal Care, Foods & Refreshment, and Home Care. It generates significant revenue globally, with Asia Pacific and Africa leading at €22.4B in 2025, followed by the Americas at €18.6B and Europe at €9.5B.
Key Products & Brands
Unilever PLC’s portfolio spans multiple consumer goods categories, including personal care, food, and home care products:
| Product | Description |
|---|---|
| Beauty & Personal Care | Skin care, hair care, deodorants, and skin cleansing products |
| Foods & Refreshment | Ice cream, soups, bouillons, seasonings, mayonnaise, ketchups, and tea |
| Home Care | Fabric solutions and various cleaning products |
| Brands | Domestos, OMO, Seventh Generation, Ben & Jerry’s, Knorr, Magnum, Wall’s, Bango, The Vegetarian Butcher, Axe, Cif, Comfort, Dove, Lifebuoy, Lux, Rexona, Sunsilk, Equilibra, OLLY, Liquid I.V., SmartyPants, Onnit, Hellmann’s, Vaseline |
Unilever’s diverse brand lineup covers essential household and personal products, supported by strong global recognition across multiple consumer segments.
Main Competitors
There are 17 competitors in total, with the table listing the top 10 leaders by market capitalization:
| Competitor | Market Cap. |
|---|---|
| The Procter & Gamble Company | 331B |
| Unilever PLC | 143B |
| Colgate-Palmolive Company | 63B |
| The Estée Lauder Companies Inc. | 38B |
| Kimberly-Clark Corporation | 34B |
| Kenvue Inc. | 33B |
| Church & Dwight Co., Inc. | 20B |
| The Clorox Company | 12B |
| e.l.f. Beauty, Inc. | 4.3B |
| Inter Parfums, Inc. | 2.7B |
Unilever PLC ranks 2nd among 17 competitors with a market cap 39% of the leader, Procter & Gamble. Unilever stands well above both the average market cap of the top 10 competitors (68B) and the median market cap of the sector (4.3B). It also enjoys a substantial 155% lead over the next closest competitor.
Does Unilever PLC have a competitive advantage?
Unilever PLC demonstrates a very favorable competitive advantage, consistently creating value with a ROIC exceeding its WACC by 7.7%. Its growing ROIC trend confirms sustainable profitability and efficient capital use.
Looking ahead, Unilever’s broad product portfolio across Beauty, Foods, and Home Care segments supports expansion opportunities. Continued innovation and geographic diversification in Asia Pacific and Africa markets offer potential growth drivers.
Comparisons with competitors
Check out how we compare the company to its competitors:
SWOT Analysis
This analysis identifies Unilever PLC’s key internal strengths and weaknesses alongside external opportunities and threats shaping its strategic direction.
Strengths
- strong global brand portfolio
- favorable ROIC vs. WACC indicating value creation
- resilient net margin of 18.75%
Weaknesses
- declining revenue growth over recent years
- low current and quick ratios signaling liquidity pressure
- high debt-to-equity ratio at 1.91
Opportunities
- expanding in emerging markets like Asia Pacific
- rising consumer demand for sustainable products
- leveraging digital marketing to boost sales
Threats
- intense competition in consumer goods sector
- raw material cost inflation
- currency fluctuations impacting international revenue
Unilever’s robust profitability and competitive moat support long-term value. However, revenue declines and liquidity concerns require cautious capital allocation. Growth focus on emerging markets and sustainability can drive future gains amid sector headwinds.
Stock Price Action Analysis
The weekly stock chart captures Unilever PLC’s price movements over the past 12 months, revealing key support and resistance levels:
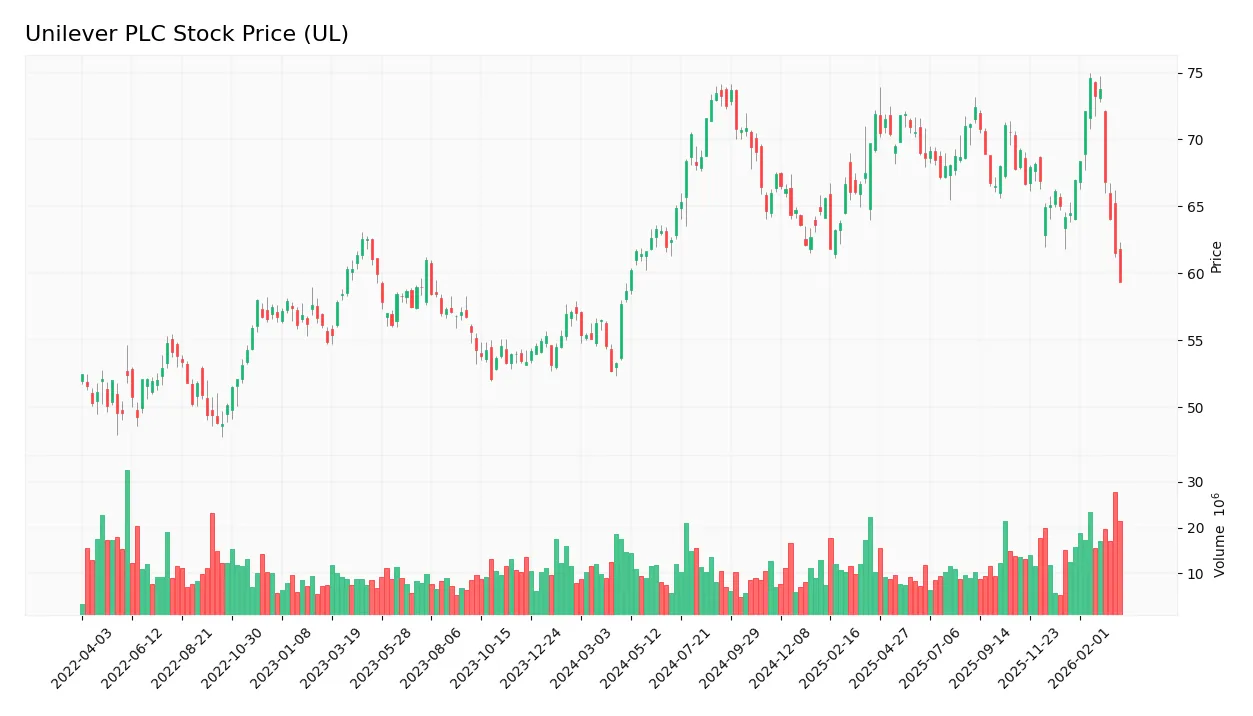
Trend Analysis
Over the past 12 months, Unilever’s stock price increased by 1.14%, indicating a bullish trend with deceleration. The price ranged between 58.7 and 74.59, with volatility measured by a 3.62 standard deviation. Recent months show a sharper decline of 7.52%, signaling a short-term negative slope.
Volume Analysis
Trading volume is increasing overall, with buyers accounting for 57% of total volume, suggesting buyer-driven interest over the year. However, in the last three months, sellers slightly dominate at 52.65%, reflecting a neutral buyer sentiment and balanced market participation during the recent downtrend.
Target Prices
Analysts set a target consensus at $65.55 for Unilever PLC, reflecting moderate upside potential.
| Target Low | Target High | Consensus |
|---|---|---|
| 60.1 | 71 | 65.55 |
The target range from $60.1 to $71 indicates cautious optimism about Unilever’s near-term performance.
Analyst & Consumer Opinions
This section examines analyst ratings and consumer feedback to provide a balanced view of Unilever PLC’s market perception.

Don’t Let Luck Decide Your Entry Point
Optimize your entry points with our advanced ProRealTime indicators. You’ll get efficient buy signals with precise price targets for maximum performance. Start outperforming now!
Stock Grades
Here is a summary of recent verified stock grades for Unilever PLC from recognized analysts:
| Grading Company | Action | New Grade | Date |
|---|---|---|---|
| Erste Group | Downgrade | Hold | 2024-11-19 |
| B of A Securities | Upgrade | Buy | 2024-08-22 |
| JP Morgan | Upgrade | Overweight | 2024-05-23 |
| Argus Research | Maintain | Buy | 2024-05-08 |
| Morgan Stanley | Downgrade | Underweight | 2024-02-27 |
| Bernstein | Upgrade | Market Perform | 2022-03-14 |
| Bernstein | Upgrade | Market Perform | 2022-03-13 |
| Bernstein | Upgrade | Market Perform | 2021-11-01 |
| Bernstein | Upgrade | Market Perform | 2021-10-31 |
| Deutsche Bank | Downgrade | Hold | 2021-09-16 |
The grading trend shows mixed sentiment with several upgrades from Bernstein and JP Morgan balanced by downgrades from Erste Group and Morgan Stanley. The consensus rating remains a Hold, reflecting moderate caution among analysts.
Consumer Opinions
Unilever PLC enjoys a generally favorable reputation among consumers, reflecting its strong brand presence and commitment to quality.
| Positive Reviews | Negative Reviews |
|---|---|
| Products deliver consistent quality. | Some products are priced higher than peers. |
| Wide variety of sustainable options. | Packaging complaints, especially waste. |
| Trusted global brand with strong heritage. | Occasional supply chain delays reported. |
Overall, consumers praise Unilever’s consistent quality and sustainability efforts. However, pricing and packaging issues emerge repeatedly as areas for improvement.
Risk Analysis
Below is a summary table outlining key risks for Unilever PLC, their likelihood, and potential impact on investment returns:
| Category | Description | Probability | Impact |
|---|---|---|---|
| Liquidity Risk | Current ratio at 0.79 signals tight short-term liquidity, a red flag. | Medium | Medium |
| Leverage Risk | High debt-to-equity (1.91) elevates financial leverage risk. | High | High |
| Valuation Risk | Price-to-book ratio of 7.83 suggests potential overvaluation. | Medium | Medium |
| Market Risk | Low beta (0.26) limits volatility but may reduce upside in rallies. | Low | Low |
| Operational Risk | Diverse product portfolio mitigates but supply chain disruptions remain possible. | Medium | Medium |
Leverage risk stands out as the most pressing concern due to Unilever’s elevated debt relative to equity. Its liquidity ratios compound worries, indicating less buffer against short-term shocks. Despite solid profitability and a safe Altman Z-score, investors should monitor debt levels closely.
Should You Buy Unilever PLC?
Unilever PLC appears to be a robust value creator with a very favorable moat supported by growing ROIC well above WACC. Despite a very unfavorable leverage profile, its overall B rating suggests moderate operational efficiency balanced by financial risks.
Strength & Efficiency Pillars
Unilever PLC demonstrates solid operational efficiency, with a net margin of 18.75% and a return on equity (ROE) of 61.0%. Its return on invested capital (ROIC) stands at 12.57%, surpassing the weighted average cost of capital (WACC) at 4.84%, confirming the company as a clear value creator. The strong interest coverage ratio of 9.85x further supports its ability to service debt comfortably. These metrics reflect a sustainable competitive advantage and improving profitability.
Weaknesses and Drawbacks
While Unilever’s Altman Z-Score of 4.65 places it safely in the “Safe Zone,” certain financial risks persist. The price-to-book ratio at 7.83 signals a potentially overvalued equity base, which may limit upside. Leverage is a concern, with a debt-to-equity ratio of 1.91 and a current ratio of 0.79, indicating tight short-term liquidity. Recent market activity shows buyer dominance weakening to 47.35%, hinting at near-term pressure and cautious investor sentiment.
Our Final Verdict about Unilever PLC
Unilever PLC’s long-term fundamentals appear robust, supported by strong profitability and value creation. Despite a bullish overall trend, recent seller dominance and moderate valuation concerns suggest a cautious, wait-and-see stance. The firm’s financial health is stable, but investors might prefer a more attractive entry point amid current market dynamics. The profile may appeal to those seeking exposure to a resilient consumer staple with a modest risk profile.
Disclaimer: This content is for informational purposes only and does not constitute financial, investment, or other professional advice. Investing in financial markets involves a significant risk of loss, and past performance is not indicative of future results.
Additional Resources
- Unilever weighs RMT-structured deal with McCormick to give shareholders stake in new entity (UL) – Seeking Alpha (Mar 27, 2026)
- Unilever (UL) reportedly explores food business spin-off and combination with McCormick – MSN (Mar 25, 2026)
- Cullen Investment Group LTD. Buys Shares of 77,933 Unilever PLC $UL – MarketBeat (Mar 26, 2026)
- If You Invested $1,000 in Unilever (UL) – Stock Titan (Mar 21, 2026)
- Baker Chad R Has $3.13 Million Holdings in Unilever PLC $UL – MarketBeat (Mar 27, 2026)
For more information about Unilever PLC, please visit the official website: unilever.com