Home > Analyses > Consumer Cyclical > Ulta Beauty, Inc.
Ulta Beauty transforms daily routines by blending beauty retail with personalized salon experiences. It commands the specialty retail space through a vast product range and exclusive private labels, fueling strong customer loyalty. Known for innovation and quality, Ulta continually adapts to evolving beauty trends. As market dynamics shift, I question whether Ulta’s robust fundamentals still support its premium valuation and growth aspirations in 2026.
Table of contents
Business Model & Company Overview
Ulta Beauty, Inc., founded in 1990 and headquartered in Bolingbrook, Illinois, stands as a dominant specialty retailer in the U.S. beauty market. With 1,308 stores across all 50 states, Ulta offers a cohesive ecosystem of cosmetics, skincare, haircare, and salon services. Its integrated approach combines retail products and in-store experiences, positioning Ulta uniquely within the consumer cyclical sector.
Ulta’s revenue engine balances retail sales of branded and private-label beauty products with recurring salon services. It leverages a strong digital platform alongside physical stores to engage customers nationwide. The company’s footprint primarily spans the Americas, with potential for international expansion. Ulta’s competitive advantage lies in its seamless blend of product and service offerings, creating a robust economic moat shaping the future of beauty retail.
Financial Performance & Fundamental Metrics
I analyze Ulta Beauty’s income statement, key financial ratios, and dividend payout policy to assess its core financial health and shareholder value creation.
Income Statement
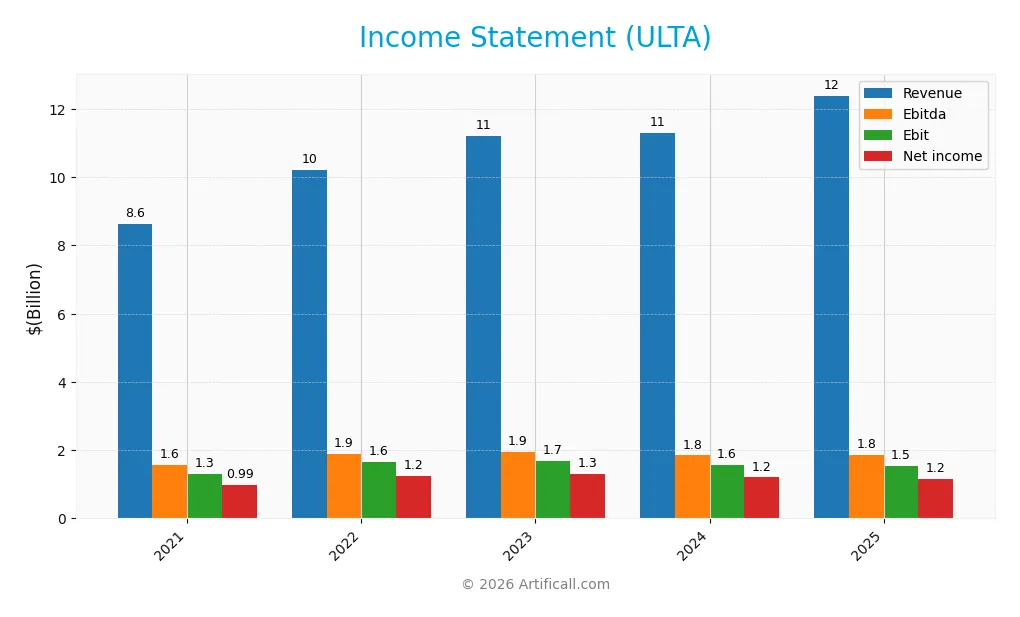
Below is Ulta Beauty, Inc.’s income statement for fiscal years 2021 through 2025, providing a clear view of its revenue, expenses, and profitability trends.
| 2021 | 2022 | 2023 | 2024 | 2025 | |
|---|---|---|---|---|---|
| Revenue | 8.6B | 10.2B | 11.2B | 11.3B | 12.4B |
| Cost of Revenue | 5.3B | 6.2B | 6.8B | 6.9B | 7.5B |
| Operating Expenses | 2.1B | 2.4B | 2.7B | 2.8B | 3.3B |
| Gross Profit | 3.4B | 4.0B | 4.4B | 4.4B | 4.8B |
| EBITDA | 1.6B | 1.9B | 1.9B | 1.8B | 1.8B |
| EBIT | 1.3B | 1.6B | 1.7B | 1.6B | 1.5B |
| Interest Expense | 1.7M | 0 | 0 | 0 | 1.8M |
| Net Income | 986M | 1.2B | 1.3B | 1.2B | 1.2B |
| EPS | 18.09 | 24.17 | 26.18 | 25.44 | 25.72 |
| Filing Date | 2022-03-25 | 2023-03-24 | 2024-03-26 | 2025-03-27 | 2026-03-26 |
Income Statement Evolution
Ulta Beauty’s revenue rose 44% from 2021 to 2025, signaling solid top-line growth. Net income increased 17% over the same period, but net margins shrank by 18.5%. Gross margin remained stable around 39%, while EBIT margin softened slightly. Recent year growth showed revenue and gross profit gains above 9%, but EBIT and net margin contracted, hinting at margin pressure.
Is the Income Statement Favorable?
The 2025 income statement reveals favorable fundamentals overall. Revenue growth of 9.7% outpaced operating expenses, though EBIT declined 2%, reflecting margin compression. Net margin at 9.3% remains healthy, supported by minimal interest expense. EPS growth was flat, indicating stable profitability per share despite margin headwinds. The income statement quality scores 64% favorable metrics, affirming a generally positive financial position.
Financial Ratios
The following table presents key financial ratios for Ulta Beauty, Inc. over the fiscal years 2021 to 2025, reflecting profitability, valuation, liquidity, leverage, and efficiency metrics:
| Ratios | 2021 | 2022 | 2023 | 2024 | 2025 |
|---|---|---|---|---|---|
| Net Margin | 11.4% | 12.2% | 11.5% | 10.6% | 9.3% |
| ROE | 64.2% | 63.4% | 56.6% | 48.3% | 41.1% |
| ROIC | 27.3% | 31.4% | 29.6% | 26.6% | 22.8% |
| P/E | 20.1 | 21.3 | 19.2 | 16.2 | 25.2 |
| P/B | 12.9 | 13.5 | 10.9 | 7.8 | 10.4 |
| Current Ratio | 1.46 | 1.61 | 1.71 | 1.70 | 1.41 |
| Quick Ratio | 0.50 | 0.66 | 0.66 | 0.60 | 0.43 |
| D/E | 1.20 | 0.97 | 0.84 | 0.77 | 0.78 |
| Debt-to-Assets | 38.8% | 35.4% | 33.5% | 32.0% | 31.2% |
| Interest Coverage | 752 | 0 | 0 | 0 | 867 |
| Asset Turnover | 1.81 | 1.90 | 1.96 | 1.88 | 1.77 |
| Fixed Asset Turnover | 3.60 | 3.97 | 4.07 | 3.96 | 3.82 |
| Dividend Yield | 0% | 0% | 0% | 0% | 0% |
Evolution of Financial Ratios
Ulta Beauty’s Return on Equity (ROE) declined from 64.21% in 2021 to 41.14% in 2025, signaling reduced profitability over time. The Current Ratio fell from 1.46 to 1.41, indicating slightly diminished short-term liquidity. The Debt-to-Equity Ratio improved from 1.20 to 0.78, reflecting a moderate reduction in leverage and enhanced financial stability.
Are the Financial Ratios Favorable?
In 2025, Ulta’s profitability metrics such as ROE (41.14%) and ROIC (22.76%) outperform typical sector benchmarks, showing strong return on capital. Liquidity is neutral with a Current Ratio of 1.41 but a weak Quick Ratio at 0.43. Leverage remains moderate with a Debt-to-Equity of 0.78. Valuation ratios like P/E (25.17) and P/B (10.35) are unfavorable, reflecting premium market pricing. Overall, ratios are slightly favorable but caution is warranted on valuation and liquidity.
Shareholder Return Policy
Ulta Beauty, Inc. does not pay dividends, reflecting a strategic choice likely aimed at reinvestment or growth. The company engages in share buybacks, which can return capital to shareholders without fixed obligations.
This approach aligns with sustainable long-term value creation, assuming buybacks are disciplined and funded by strong free cash flow. Absence of dividends reduces distribution risk but requires careful capital allocation to maintain shareholder trust.
Score analysis
The radar chart below illustrates Ulta Beauty’s key financial scores, highlighting strengths and weaknesses across valuation and profitability metrics:
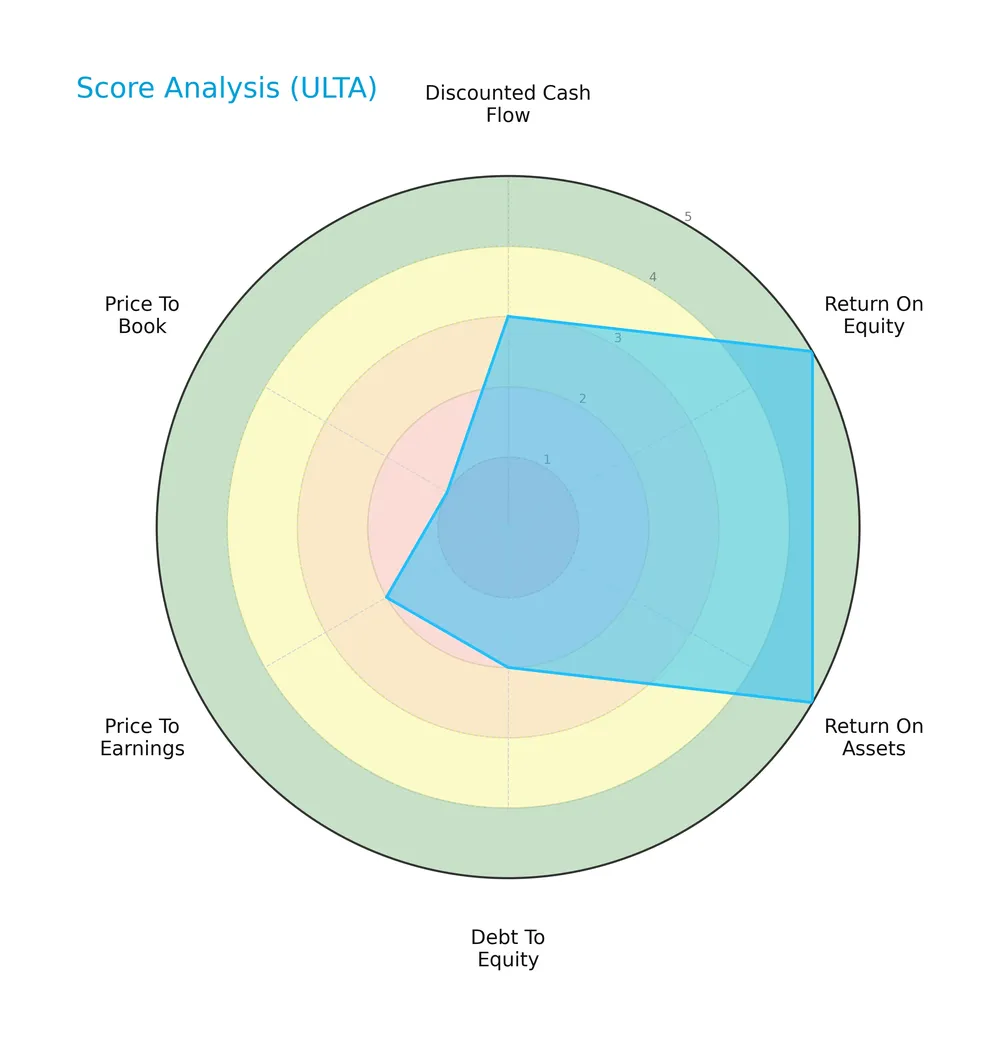
Ulta’s return on equity and assets scores stand very favorable at 5 each, signaling efficient capital use. However, debt-to-equity, price-to-earnings, and price-to-book scores fall into unfavorable to very unfavorable zones, reflecting valuation concerns and leverage risks. The discounted cash flow score is moderate at 3.
Analysis of the company’s bankruptcy risk
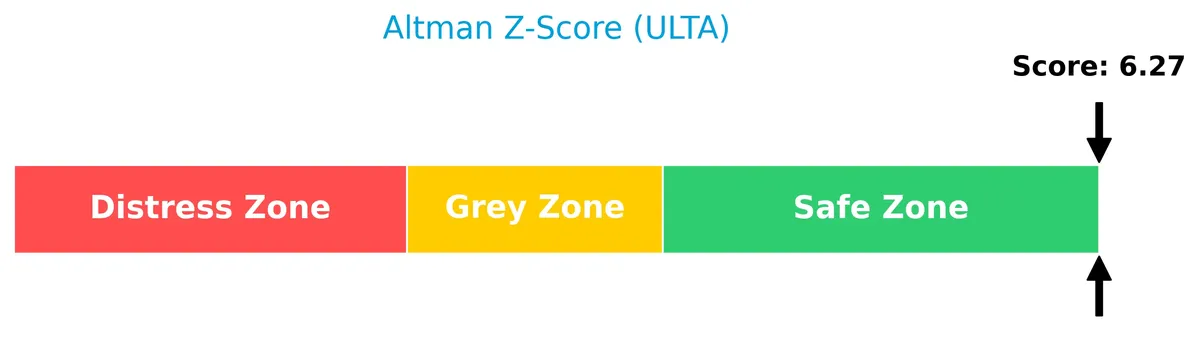
Ulta Beauty’s Altman Z-Score places it well within the safe zone, indicating a low risk of bankruptcy and stable financial health:
Is the company in good financial health?
The Piotroski Score diagram summarizes Ulta’s current financial strength based on nine key criteria:
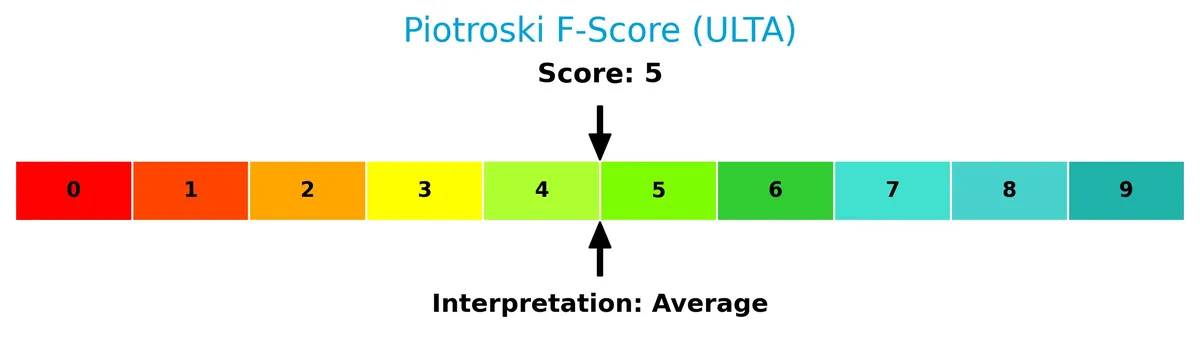
With a score of 5, Ulta’s financial health rates as average. This suggests moderate operational efficiency and profitability but leaves room for improvement to reach strong financial robustness.
Competitive Landscape & Sector Positioning
This analysis explores Ulta Beauty’s strategic positioning, revenue segments, key products, and main competitors within the specialty retail sector. I will assess whether Ulta Beauty maintains a competitive advantage over its peers.
Strategic Positioning
Ulta Beauty focuses on a concentrated U.S. market with 1,308 stores nationwide. It offers a diversified product portfolio including cosmetics, skincare, and salon services, supported by growing e-commerce. This multi-channel approach balances physical retail with digital expansion.
Revenue by Segment
This pie chart presents Ulta Beauty, Inc.’s revenue distribution by segment for fiscal year 2025, highlighting Gift Card Breakage as the sole reported segment.
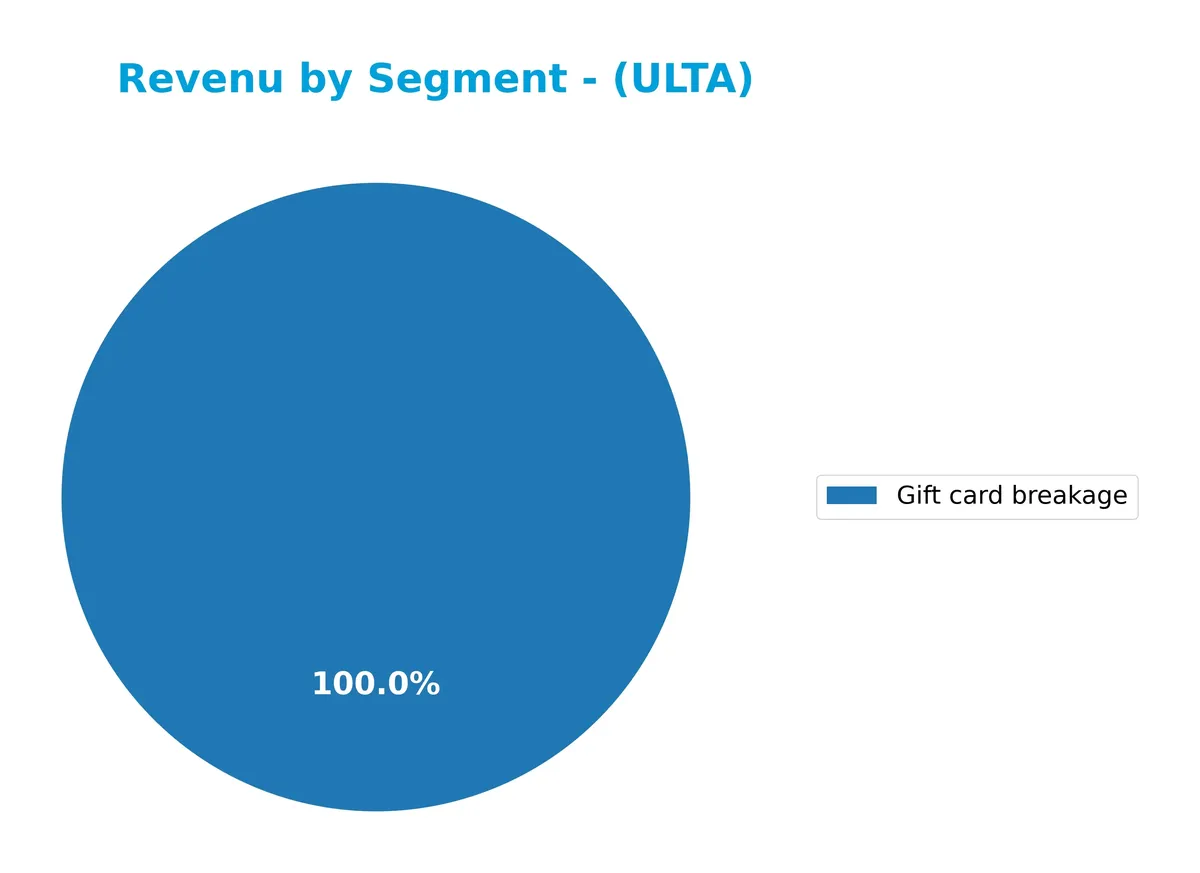
Ulta’s revenue in 2025 is driven entirely by Gift Card Breakage, totaling 27M. Historically, the company diversified across product sales, e-commerce, and salon services. However, recent data shows a narrow concentration risk in this segment alone, signaling a potential shift or reporting gap. I note that Gift Card Breakage has steadily increased from 15M in 2021, reflecting improved breakage recognition or changes in customer purchasing behavior.
Key Products & Brands
Ulta Beauty’s portfolio includes retail products, salon services, and private label brands:
| Product | Description |
|---|---|
| Cosmetics | Makeup products sold through 1,308 stores and online, including Ulta Beauty Collection items. |
| Fragrances | A variety of perfumes and colognes offered in stores and online. |
| Skincare & Haircare | Products for skin and hair health, including professional salon brands. |
| Bath & Body Products | Personal care items such as lotions and body washes. |
| Salon Styling Tools | Tools used for hair styling available to consumers and professionals. |
| Salon Services | Hair, skin, makeup, brow, and nail services performed in-store. |
| Private Label Products | Ulta-branded cosmetics, skincare, bath products, and gifts. |
| E-Commerce Sales | Online sales channel comprising a growing share of total revenue. |
| Gift Card Breakage | Revenue recognized from unredeemed gift card balances. |
Ulta Beauty blends product sales with in-store salon services, supported by strong e-commerce growth. Its private label brands complement national brands, enhancing customer loyalty. Gift card breakage contributes a modest but steady revenue stream.
Main Competitors
The Consumer Cyclical Specialty Retail sector includes 10 main competitors; the table below shows the top 10 leaders by market capitalization:
| Competitor | Market Cap. |
|---|---|
| Amazon.com, Inc. | 2.42T |
| Alibaba Group Holding Limited | 340B |
| PDD Holdings Inc. | 159B |
| MercadoLibre, Inc. | 102B |
| eBay Inc. | 39.4B |
| Ulta Beauty, Inc. | 27.8B |
| Tractor Supply Company | 26.9B |
| Williams-Sonoma, Inc. | 23.0B |
| Genuine Parts Company | 17.2B |
| Best Buy Co., Inc. | 14.5B |
Ulta Beauty ranks 6th among its top 10 competitors, with a market cap just 0.95% of the leader, Amazon. The company sits below both the average market cap of 317B and the sector median of 33.6B. Notably, Ulta’s market cap is 72% higher than its closest rival above, indicating a solid gap separating it from higher-tier peers.
Comparisons with competitors
Check out how we compare the company to its competitors:
Does ULTA have a competitive advantage?
Ulta Beauty presents a competitive advantage by creating value with a ROIC exceeding its WACC by over 15%, signaling efficient capital use and profitability. However, its ROIC trend shows a decline, indicating diminishing profitability over recent years.
Looking ahead, Ulta’s extensive product portfolio and nationwide retail presence position it well to capitalize on expanding beauty services and private label growth. Future opportunities may arise from innovation in salon services and digital channels, supporting revenue expansion in evolving markets.
SWOT Analysis
This SWOT analysis highlights Ulta Beauty’s strategic position by evaluating internal strengths and weaknesses alongside external opportunities and threats.
Strengths
- Strong brand presence in U.S. specialty retail
- High ROIC of 22.8% well above WACC
- Robust return on equity at 41.1%
Weaknesses
- Declining ROIC trend signals eroding profitability
- High P/E of 25.2 and P/B of 10.4 suggest overvaluation
- Low quick ratio of 0.43 raises liquidity concerns
Opportunities
- Expansion of e-commerce and mobile platforms
- Growth in private label product lines
- Increasing demand for personalized beauty services
Threats
- Intense competition from online and physical retailers
- Economic sensitivity of discretionary spending
- Rising operating expenses impacting margins
Ulta Beauty maintains solid profitability and value creation but faces margin pressure and valuation risks. The company must leverage digital growth and private brands while managing liquidity and cost control to sustain its competitive edge.
Stock Price Action Analysis
The weekly chart below displays Ulta Beauty, Inc.’s stock price movement over the past 100 weeks, highlighting key fluctuations and trend patterns:
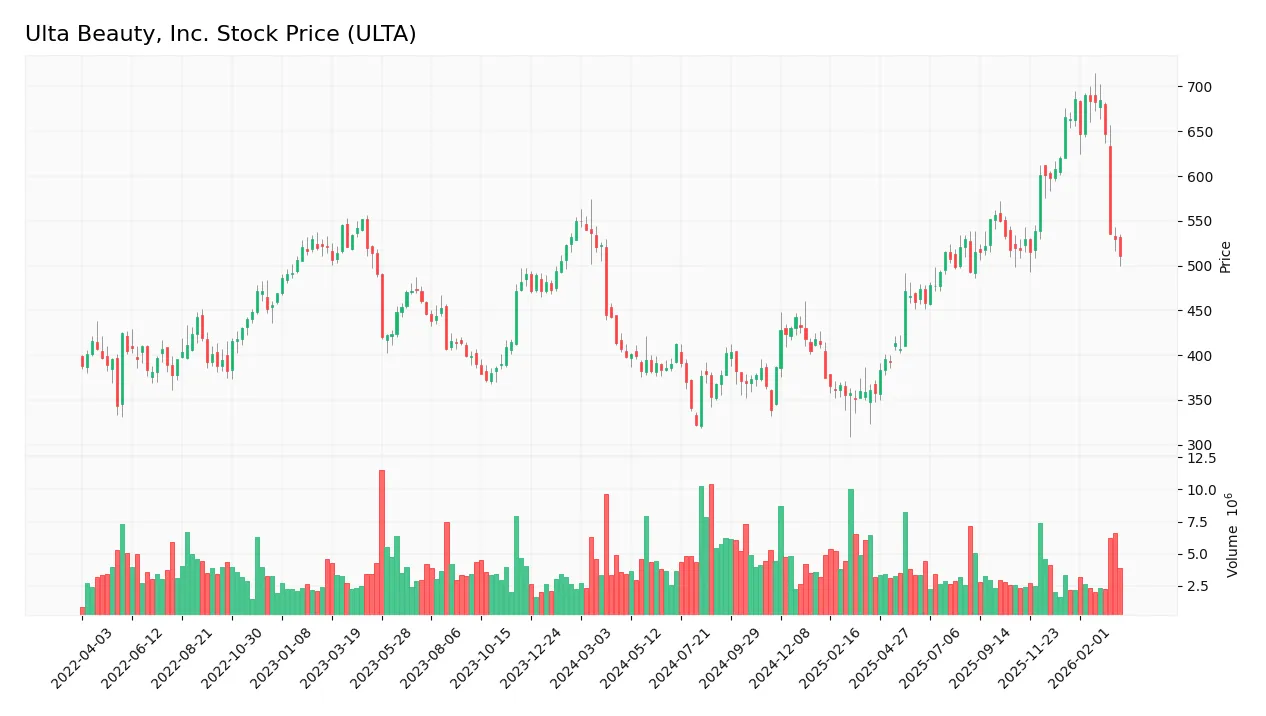
Trend Analysis
Over the past 100 weeks, ULTA’s stock rose 28.42%, signaling a bullish trend with notable highs near 690.37 and lows around 322.17. Despite this growth, the trend shows deceleration. Recent weeks (Jan–Mar 2026) reversed sharply, dropping 23.39%, confirming a negative short-term slope.
Volume Analysis
In the last three months, trading volume decreased amid a seller-dominant market, with sellers accounting for 73%. This decline in activity alongside selling pressure suggests weakening investor participation and cautious sentiment toward ULTA shares.
Target Prices
Analysts set a solid target consensus for Ulta Beauty, Inc., reflecting confidence in the stock’s growth potential.
| Target Low | Target High | Consensus |
|---|---|---|
| 640 | 810 | 715.07 |
The target range suggests upside potential from current levels, with consensus clustering near 715, indicating bullish sentiment among analysts.

Don’t Let Luck Decide Your Entry Point
Optimize your entry points with our advanced ProRealTime indicators. You’ll get efficient buy signals with precise price targets for maximum performance. Start outperforming now!
Analyst & Consumer Opinions
This section reviews Ulta Beauty, Inc.’s analyst ratings and consumer feedback to gauge market sentiment and brand perception.
Stock Grades
Here are the latest verified stock grades for Ulta Beauty, Inc. from leading financial institutions as of March 2026:
| Grading Company | Action | New Grade | Date |
|---|---|---|---|
| Morgan Stanley | Maintain | Overweight | 2026-03-13 |
| Wells Fargo | Maintain | Underweight | 2026-03-13 |
| TD Cowen | Maintain | Buy | 2026-03-13 |
| JP Morgan | Maintain | Overweight | 2026-03-13 |
| Telsey Advisory Group | Maintain | Outperform | 2026-03-13 |
| Piper Sandler | Maintain | Overweight | 2026-03-13 |
| Canaccord Genuity | Maintain | Buy | 2026-03-13 |
| Oppenheimer | Maintain | Outperform | 2026-03-13 |
| Evercore ISI Group | Maintain | Outperform | 2026-03-11 |
| Canaccord Genuity | Maintain | Buy | 2026-03-10 |
The consensus shows a strong tilt toward positive ratings, with most firms maintaining buy or outperform stances. However, Wells Fargo’s underweight rating indicates some caution remains within the analyst community.
Consumer Opinions
Ulta Beauty, Inc. consistently sparks strong reactions from its customers, reflecting both its market appeal and areas for improvement.
| Positive Reviews | Negative Reviews |
|---|---|
| Wide product variety with top beauty brands | Long checkout lines during peak hours |
| Friendly and knowledgeable staff | Inconsistent stock levels for popular items |
| Loyalty program offers excellent rewards and discounts | Some customers report issues with online order accuracy |
Overall, consumers praise Ulta’s diverse product selection and rewarding loyalty program. However, operational challenges like checkout delays and inventory gaps remain common frustrations.
Risk Analysis
Below is a summary table of key risks facing Ulta Beauty, Inc., highlighting their likelihood and potential impact:
| Category | Description | Probability | Impact |
|---|---|---|---|
| Valuation Risk | High P/B (10.35) and P/E (25.17) ratios indicate overvaluation | High | Medium |
| Liquidity Risk | Low quick ratio (0.43) signals weak short-term liquidity | Medium | Medium |
| Leverage Risk | Moderate debt-to-equity (0.78) and debt-to-assets (31.18%) | Medium | Low |
| Market Volatility | Beta of 0.847 suggests less volatility than market but still sensitive | Medium | Medium |
| Dividend Policy | No dividend yield could deter income-focused investors | Low | Low |
| Competitive Risk | Intense specialty retail competition and changing consumer preferences | Medium | High |
Ulta’s strongest risk stems from its elevated valuation multiples, which may limit upside in a market downturn. The weak quick ratio flags potential short-term liquidity stress amid economic uncertainty. Competitive pressures remain significant as consumers shift spending habits. However, a robust Altman Z-Score (6.27) places Ulta in a safe financial zone, reducing bankruptcy risk. I advise cautious optimism with a watchful eye on valuation and liquidity trends.
Should You Buy Ulta Beauty, Inc.?
Ulta Beauty appears to be delivering robust value creation with a durable competitive moat, although its declining ROIC suggests caution. Despite a manageable leverage profile, some valuation metrics are unfavorable. The overall B+ rating suggests a very favorable yet nuanced investment profile.
Strength & Efficiency Pillars
Ulta Beauty, Inc. exhibits solid operational efficiency with a gross margin of 39.1% and an EBIT margin of 12.5%. Its return on equity stands at a robust 41.14%, while the return on invested capital (ROIC) at 22.76% significantly exceeds the weighted average cost of capital (WACC) of 7.63%. This gap confirms Ulta as a clear value creator. Interest expense remains negligible at 0.01%, underscoring effective capital cost management. These metrics illustrate Ulta’s strong profitability and disciplined capital allocation.
Weaknesses and Drawbacks
Despite operational strengths, Ulta’s valuation metrics raise caution. The price-to-earnings ratio at 25.17 and an elevated price-to-book ratio of 10.35 suggest the stock trades at a premium, potentially limiting upside. The quick ratio of 0.43 signals liquidity concerns, pointing to limited short-term asset coverage of current liabilities. Additionally, seller dominance at 27.03% in the recent period exerts downward pressure on the share price. These factors warrant vigilance amid market volatility and valuation risks.
Our Final Verdict about Ulta Beauty, Inc.
Ulta Beauty’s fundamentals appear attractive with strong profitability and value creation. However, recent market pressure and elevated valuation ratios suggest a cautious stance. Despite a bullish long-term trend, the seller dominance in the near term indicates that investors might consider a wait-and-see approach for a more favorable entry point. The company’s financial health is solid, but valuation and short-term technicals temper immediate enthusiasm.
Disclaimer: This content is for informational purposes only and does not constitute financial, investment, or other professional advice. Investing in financial markets involves a significant risk of loss, and past performance is not indicative of future results.
Additional Resources
- Dakota Wealth Management Acquires 4,539 Shares of Ulta Beauty Inc. $ULTA – MarketBeat (Mar 28, 2026)
- Ulta Beauty (NASDAQ: ULTA) details growth plans, loyalty strength and risks – Stock Titan (Mar 26, 2026)
- Generate Investment Management Ltd Acquires New Holdings in Ulta Beauty Inc. $ULTA – MarketBeat (Mar 28, 2026)
- With 13 New Brands, Ulta Beauty Wants to Dominate in Korean Hair Care – WWD (Mar 26, 2026)
- Jim Cramer Highlights Ulta Beauty For Its Strong High End Sales Despite A Recent Earnings Miss – Yahoo Finance (Mar 25, 2026)
For more information about Ulta Beauty, Inc., please visit the official website: ulta.com