Home > Analyses > Technology > UiPath Inc.
UiPath transforms the way businesses operate by automating repetitive tasks with intelligent software robots. Its end-to-end automation platform leads the RPA industry, blending AI with user-friendly tools that empower companies to streamline workflows efficiently. Known for innovation and robust integration capabilities, UiPath serves sectors from banking to healthcare with scalable solutions. As automation adoption accelerates, I examine whether UiPath’s fundamentals support its current valuation and growth trajectory in a competitive tech landscape.

Table of contents
Business Model & Company Overview
UiPath Inc., founded in 2005 and headquartered in New York City, dominates the robotic process automation (RPA) sector with its end-to-end automation platform. Its cohesive ecosystem integrates AI, low-code tools, and centralized portals to help enterprises automate workflows efficiently. UiPath’s software suite supports diverse industries including banking, healthcare, and government, creating a unified mission to transform business processes worldwide.
The company’s revenue engine balances software licenses with recurring maintenance, support, and professional services, driving consistent value creation. UiPath operates strategically across the Americas, Europe, and Asia, leveraging native connectors and immersive automation modes. Its competitive advantage lies in a broad platform that orchestrates human-robot collaboration, securing a durable economic moat in automation’s future landscape.
Financial Performance & Fundamental Metrics
I analyze UiPath Inc.’s income statement, key financial ratios, and dividend payout policy to assess its core profitability and shareholder returns in 2026.
Income Statement
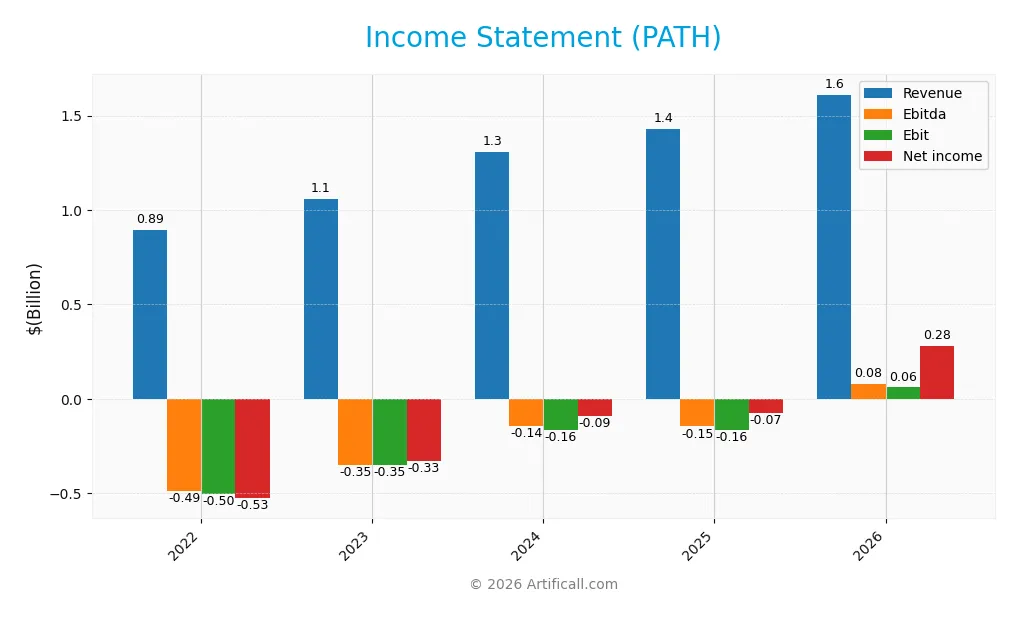
The table below summarizes UiPath Inc.’s annual income statement figures from 2022 to 2026, highlighting key profitability and expense metrics.
| 2022 | 2023 | 2024 | 2025 | 2026 | |
|---|---|---|---|---|---|
| Revenue | 892M | 1.06B | 1.31B | 1.43B | 1.61B |
| Cost of Revenue | 169M | 180M | 196M | 247M | 274M |
| Operating Expenses | 1.22B | 1.23B | 1.28B | 1.35B | 1.28B |
| Gross Profit | 723M | 879M | 1.11B | 1.18B | 1.34B |
| EBITDA | -486M | -348M | -142M | -145M | 78M |
| EBIT | -501M | -348M | -165M | -163M | 61M |
| Interest Expense | 0 | 0 | 0 | 0 | 0 |
| Net Income | -526M | -328M | -90M | -74M | 282M |
| EPS | -0.97 | -0.60 | -0.16 | -0.13 | 0.52 |
| Filing Date | 2022-04-04 | 2023-03-24 | 2024-03-27 | 2025-03-24 | 2026-03-25 |
Income Statement Evolution
UiPath’s revenue grew steadily from 892M in 2022 to 1.61B in 2026, reflecting an 80.5% increase over five years. Net income turned positive in 2026 at 282M after consecutive losses, boosting net margin to 17.5%. Gross margin remained strong and stable near 83%, while EBIT margin improved moderately to 3.8%, signaling margin expansion alongside growth.
Is the Income Statement Favorable?
In 2026, UiPath reported 1.61B revenue with 1.34B gross profit, maintaining a robust gross margin of 82.98%. Operating expenses rose in line with revenue, supporting a positive EBIT of 61M. Interest expenses were nil, contributing favorably. Net income of 282M and EPS of 0.52 indicate strong fundamentals. Overall, the income statement presents a favorable financial position with substantial margin and profit improvements.
Financial Ratios
The table below presents key financial ratios for UiPath Inc. over the fiscal years 2022 to 2026, illustrating profitability, liquidity, valuation, leverage, and efficiency metrics:
| Ratios | 2022 | 2023 | 2024 | 2025 | 2026 |
|---|---|---|---|---|---|
| Net Margin | -58.9% | -31.0% | -6.9% | -5.2% | 17.5% |
| ROE | -27.3% | -17.1% | -4.5% | -4.0% | 13.6% |
| ROIC | -24.5% | -16.5% | -7.3% | -7.4% | 2.7% |
| P/E | -37.6x | -25.6x | -144.2x | -108.0x | 24.0x |
| P/B | 10.3x | 4.4x | 6.4x | 4.3x | 3.3x |
| Current Ratio | 4.32 | 3.74 | 3.63 | 2.93 | 2.48 |
| Quick Ratio | 4.32 | 3.74 | 3.63 | 2.93 | 2.48 |
| D/E | 0.027 | 0.033 | 0.033 | 0.042 | 0.034 |
| Debt-to-Assets | 2.0% | 2.3% | 2.3% | 2.7% | 2.2% |
| Interest Coverage | 0 | 0 | 0 | 0 | 0 |
| Asset Turnover | 0.35 | 0.39 | 0.44 | 0.50 | 0.51 |
| Fixed Asset Turnover | 13.5 | 13.1 | 16.3 | 14.4 | 14.6 |
| Dividend Yield | 0% | 0% | 0% | 0% | 0% |
Evolution of Financial Ratios
UiPath’s Return on Equity (ROE) improved from negative territory in 2022-2025 to a neutral 13.56% in 2026. The Current Ratio steadily declined from 4.32 in 2022 to 2.48 in 2026, reflecting a contraction in liquidity but remaining solid. Debt-to-Equity remained low and stable around 0.03, signaling conservative leverage. Profitability shifted from deep losses to a favorable net margin of 17.53%.
Are the Financial Ratios Favorable?
In 2026, UiPath shows a balanced financial profile. Profitability is favorable with a strong net margin, though ROIC at 2.68% trails its WACC of 9.14%, marking an efficiency concern. Liquidity ratios (Current and Quick) are robust. Leverage is minimal and well-covered by infinite interest coverage. Market multiples like P/E and P/B appear neutral to unfavorable, reflecting moderate valuation caution. Overall, ratios lean slightly favorable with notable risks.
Shareholder Return Policy
UiPath Inc. (PATH) does not pay dividends, reflecting its reinvestment strategy during a high-growth phase. The company focuses on expanding operations and enhancing R&D, supported by a strong free cash flow and no reported share buyback programs.
This approach aligns with long-term shareholder value creation by prioritizing capital allocation towards growth opportunities. However, investors should monitor if the lack of direct returns continues as PATH matures and profitability stabilizes.
Score analysis
The radar chart below illustrates UiPath Inc.’s key financial scores across valuation, profitability, and leverage metrics:
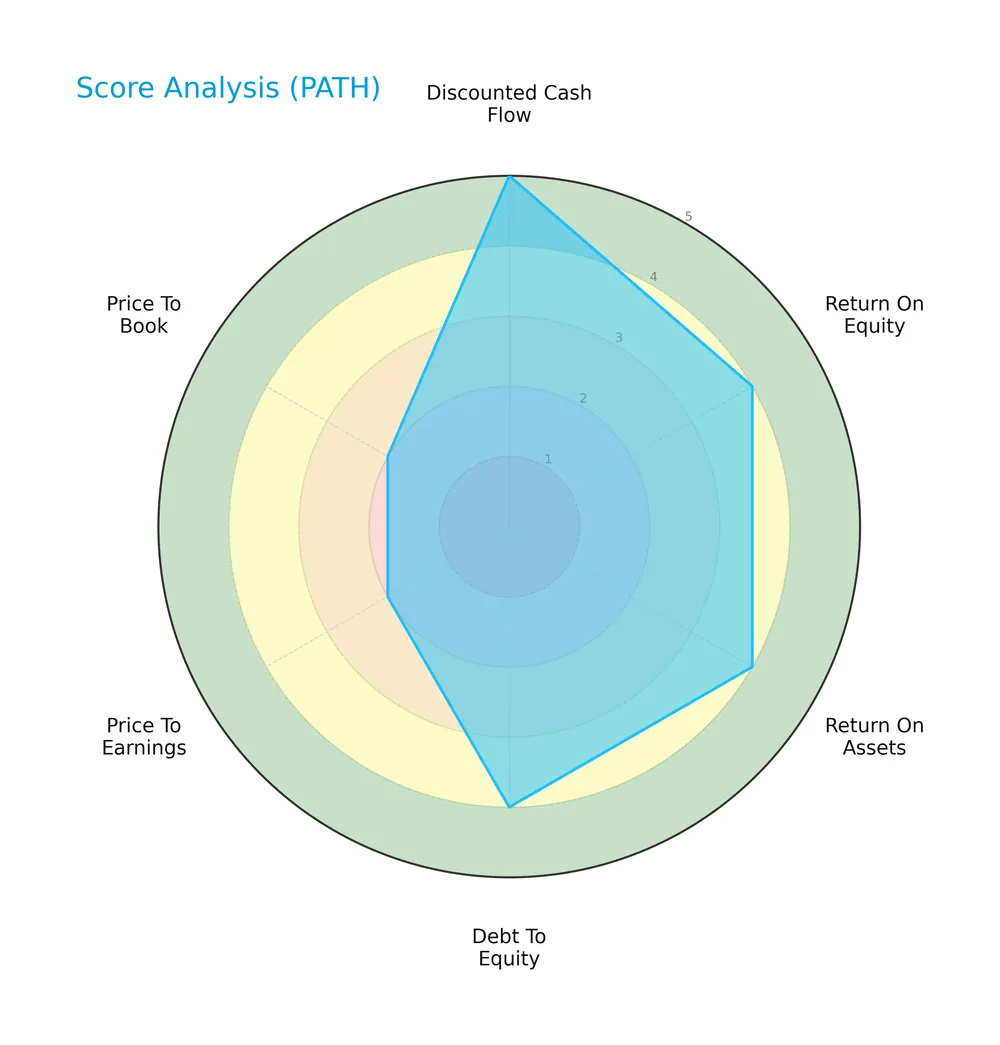
UiPath scores very favorably on discounted cash flow (5) and solidly on return on equity (4), return on assets (4), and debt to equity (4). Valuation metrics, price to earnings (2) and price to book (2), appear less attractive, indicating market pricing concerns.
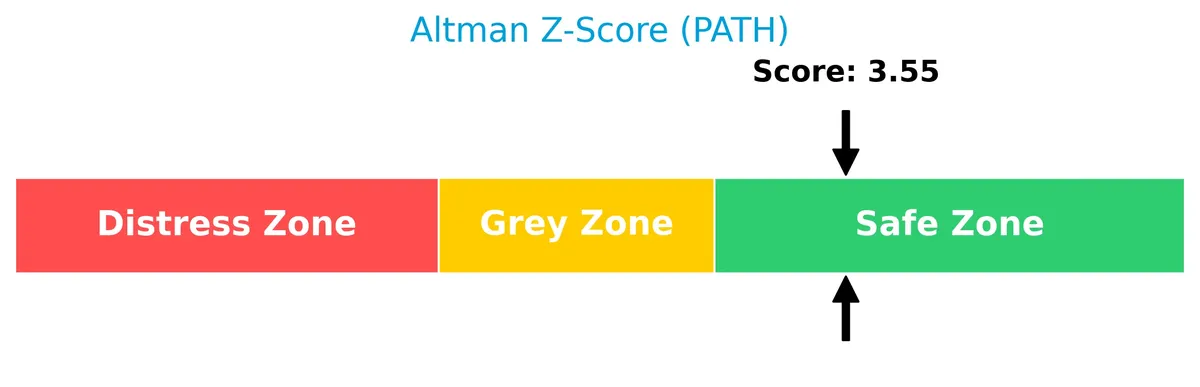
Analysis of the company’s bankruptcy risk
UiPath’s Altman Z-Score places it firmly in the safe zone, indicating a low risk of bankruptcy and solid financial stability:
Is the company in good financial health?
The Piotroski diagram highlights UiPath’s strong financial health based on nine fundamental criteria:
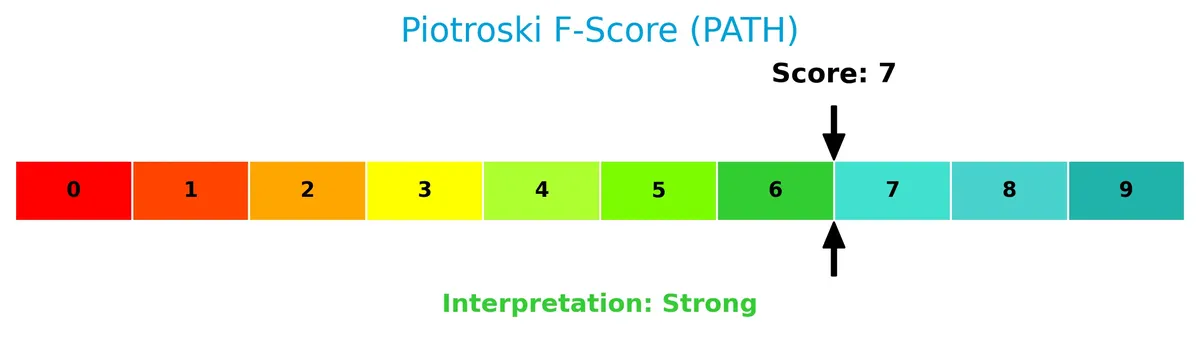
With a Piotroski Score of 7, UiPath demonstrates robust profitability, liquidity, and efficiency, signaling strong underlying financial fundamentals.
Competitive Landscape & Sector Positioning
This analysis explores UiPath Inc.’s strategic positioning, revenue segments, key products, and main competitors. I will assess whether UiPath holds a competitive advantage within the software infrastructure sector.
Strategic Positioning
UiPath concentrates on robotic process automation software, diversifying revenue across license (606M), subscription (954M), and professional services (108M) in 2026. Geographically, it balances exposure with 799M from Americas, 528M from EMEA, and 284M from Asia Pacific.
Revenue by Segment
This pie chart illustrates UiPath Inc.’s revenue breakdown by segment for fiscal year 2026, highlighting the relative contributions of License, Subscription Services, and Professional Services.
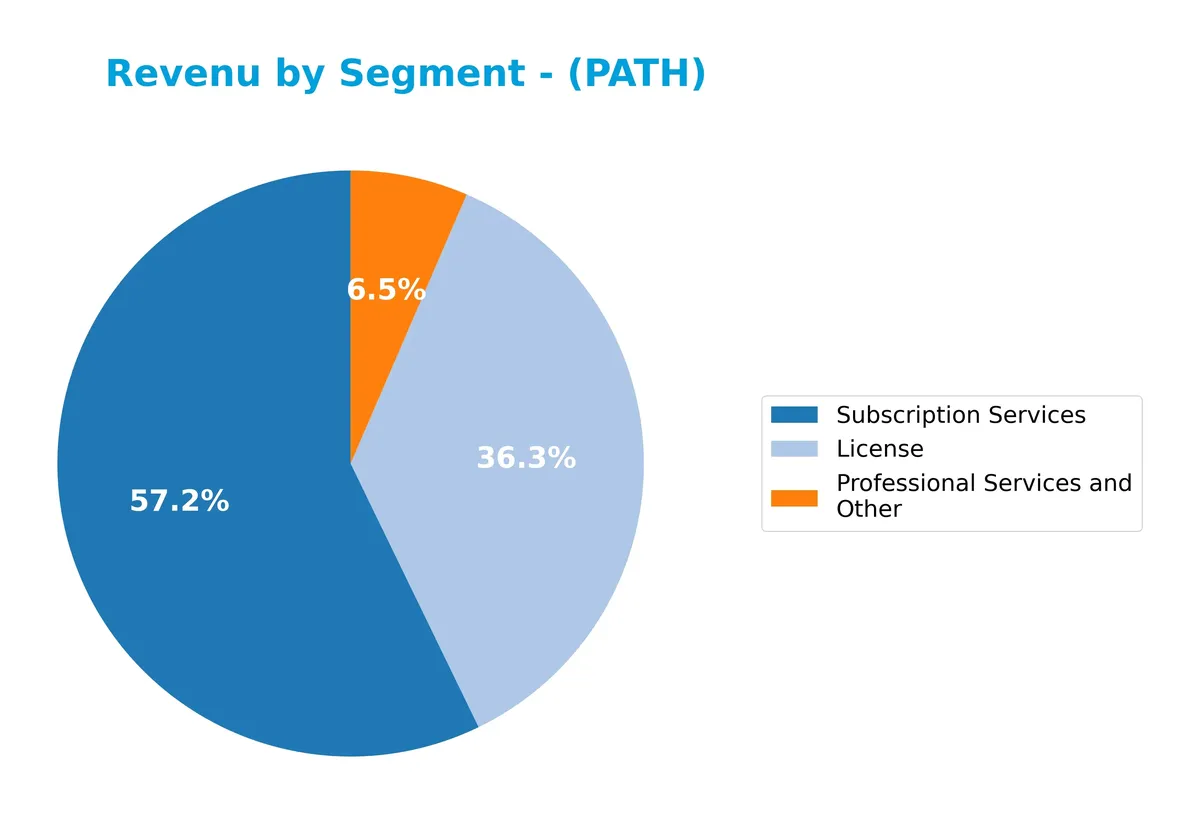
Subscription Services dominate UiPath’s revenue at 954M in 2026, showing strong acceleration from 370M in 2022. License revenue also grew steadily to 606M, confirming its role as a significant driver. Professional Services, though smaller at 108M, nearly doubled from 41M in 2022, indicating expanding client engagement. The trend favors recurring revenue, reducing concentration risk and supporting long-term growth resilience.
Key Products & Brands
UiPath’s revenue stems primarily from its automation software licenses, subscription services, and professional offerings:
| Product | Description |
|---|---|
| License | One-time fees for robotic process automation software enabling enterprise automation deployment. |
| Subscription Services | Recurring revenue from cloud-based automation platforms and ongoing access to software updates. |
| Professional Services and Other | Training, implementation, and support services to facilitate platform adoption and maximize client value. |
UiPath generates most revenue from subscription services, reflecting a shift to recurring income. Licensing fees remain significant, complemented by growing professional services. This mix suits evolving enterprise automation needs.
Main Competitors
UiPath Inc. faces competition from a total of 32 companies, with the table below highlighting the top 10 leaders by market capitalization:
| Competitor | Market Cap. |
|---|---|
| Microsoft Corporation | 3.52T |
| Oracle Corporation | 553B |
| Palantir Technologies Inc. | 383B |
| Adobe Inc. | 140B |
| Palo Alto Networks, Inc. | 120B |
| CrowdStrike Holdings, Inc. | 113B |
| Synopsys, Inc. | 92B |
| Cloudflare, Inc. | 69B |
| Fortinet, Inc. | 59B |
| Block, Inc. | 40B |
UiPath ranks 24th among 32 competitors, holding a market cap just 0.16% of the leader, Microsoft. The company sits well below both the average market cap of the top 10 (508B) and the sector median (19B). Its market capitalization is 114% lower than the next closest competitor above, highlighting a significant gap in scale.
Comparisons with competitors
Check out how we compare the company to its competitors:
Does UiPath Inc. have a competitive advantage?
UiPath currently lacks a strong economic moat, as its ROIC remains below WACC, indicating value destruction despite improving profitability. The company’s gross margin of 83% and net margin of 17.5% are favorable but not sufficient to establish a durable competitive edge.
Looking ahead, UiPath’s expansion across the Americas, EMEA, and Asia Pacific markets, combined with its integrated AI-powered automation platform, offers growth potential. Continued innovation in low-code RPA solutions and enterprise automation tools may enhance its position in the software infrastructure sector.
SWOT Analysis
This SWOT analysis highlights UiPath Inc.’s core competitive factors and strategic challenges to inform investment decisions.
Strengths
- Strong revenue growth of 80.5% over 5 years
- High gross margin at 83%
- Robust net margin improvement to 17.5%
Weaknesses
- ROIC below WACC indicates value destruction
- Price-to-book ratio at 3.25 suggests premium valuation
- No dividend yield limits income investor appeal
Opportunities
- Expansion in Americas with $799M revenue
- Growing automation demand in healthcare and finance
- Leveraging AI to enhance RPA platform capabilities
Threats
- Intense competition in software infrastructure
- Rapid tech changes could outdate products
- Economic downturns may reduce IT spending
UiPath’s strengths in margin expansion and revenue growth offset its current capital inefficiency. The company must convert its growing profitability into sustained value creation to defend against competitive and macroeconomic risks.
Stock Price Action Analysis
The weekly stock chart for UiPath Inc. (PATH) illustrates price movement and volume trends over the past 12 months:
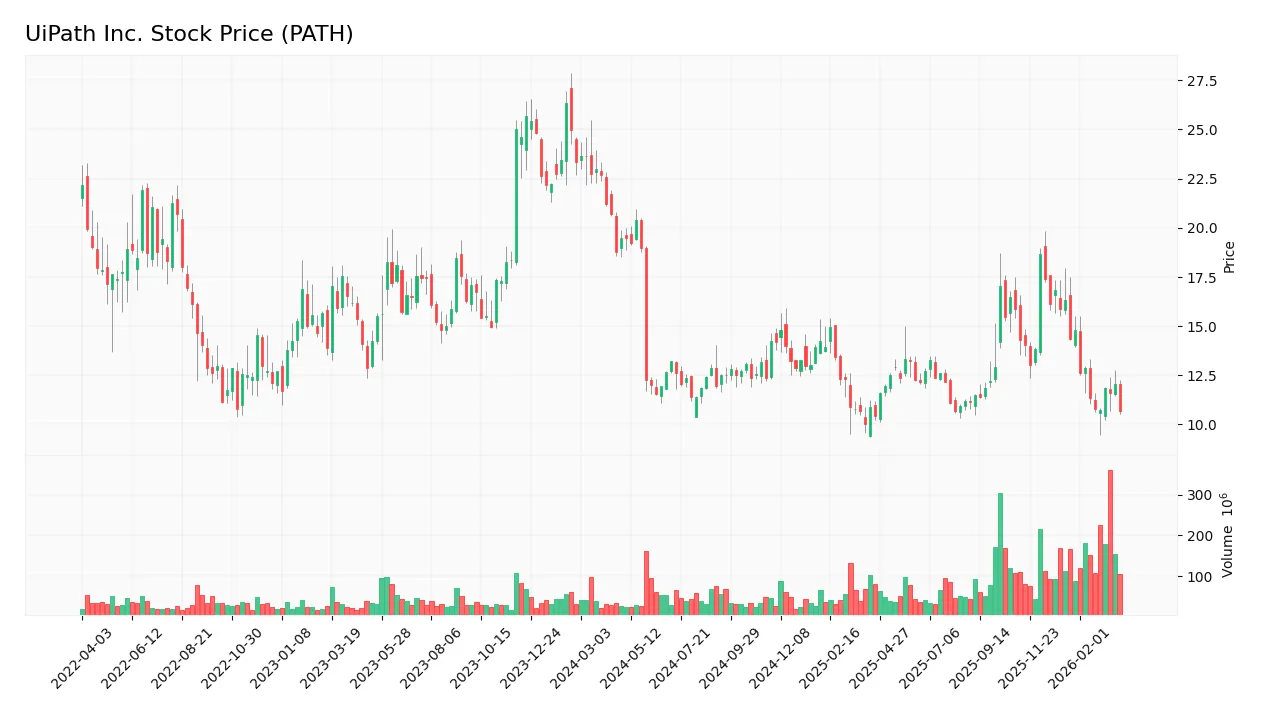
Trend Analysis
Over the past year, PATH’s stock declined by 45.12%, indicating a clear bearish trend with deceleration. The price ranged from a high of 20.41 to a low of 10.04. Volatility remained moderate, with a standard deviation of 2.09.
Volume Analysis
Over the last three months, trading volume increased but remained seller-driven, with sellers accounting for 63.49% of activity. This suggests persistent bearish sentiment and cautious market participation among investors.
Target Prices
Analysts present a moderate target consensus for UiPath Inc., reflecting cautious optimism.
| Target Low | Target High | Consensus |
|---|---|---|
| 13 | 19 | 15.82 |
The target range suggests analysts expect modest upside potential, balancing growth prospects with sector volatility.

Don’t Let Luck Decide Your Entry Point
Optimize your entry points with our advanced ProRealTime indicators. You’ll get efficient buy signals with precise price targets for maximum performance. Start outperforming now!
Analyst & Consumer Opinions
This section reviews analyst ratings and consumer feedback for UiPath Inc. (PATH) to gauge market sentiment.
Stock Grades
The latest grades for UiPath Inc. reflect a mix of cautious optimism and steady assessments from key analysts:
| Grading Company | Action | New Grade | Date |
|---|---|---|---|
| BMO Capital | Maintain | Market Perform | 2026-03-16 |
| Needham | Upgrade | Buy | 2026-03-12 |
| B of A Securities | Maintain | Underperform | 2026-03-12 |
| Wells Fargo | Maintain | Equal Weight | 2026-03-12 |
| Truist Securities | Maintain | Hold | 2026-03-12 |
| Canaccord Genuity | Maintain | Buy | 2026-03-12 |
| TD Cowen | Maintain | Hold | 2026-03-12 |
| Morgan Stanley | Maintain | Equal Weight | 2026-03-12 |
| Mizuho | Maintain | Neutral | 2026-03-12 |
| UBS | Maintain | Neutral | 2026-03-12 |
Most analysts maintain neutral or hold ratings, with a minority upgrading to buy. The consensus remains cautious, reflecting a balanced market view on UiPath’s near-term prospects.
Consumer Opinions
Consumers express mixed feelings about UiPath Inc., reflecting both enthusiasm and frustration.
| Positive Reviews | Negative Reviews |
|---|---|
| Intuitive interface simplifies complex automation. | Occasional bugs disrupt workflow during peak hours. |
| Strong customer support responds promptly. | Pricing model feels steep for small businesses. |
| Regular updates improve functionality and security. | Steep learning curve for non-technical users. |
Overall, users praise UiPath’s powerful automation and responsive support. However, pricing and usability challenges recur as common pain points, signaling areas for improvement.
Risk Analysis
Below is a table summarizing key risks facing UiPath Inc. in 2026, highlighting their likelihood and potential impact:
| Category | Description | Probability | Impact |
|---|---|---|---|
| Market Volatility | Beta of 1.09 indicates moderate stock price sensitivity to market swings. | Medium | Medium |
| Valuation Risk | Unfavorable P/B of 3.25 suggests stock may be overvalued relative to book value. | Medium | Medium |
| Profitability Risk | ROIC at 2.68% falls below WACC of 9.14%, signaling potential capital allocation inefficiency. | High | High |
| Dividend Policy | Zero dividend yield may deter income-focused investors. | High | Low |
| Competitive Pressure | Rapid innovation demands continual investment in RPA platform to maintain moat. | High | High |
I see the biggest concerns in UiPath’s low ROIC versus its cost of capital. This gap hints at inefficient capital use, risking shareholder value erosion if unaddressed. Market volatility and competitive pressure remain relevant as the automation software sector evolves rapidly. The favorable liquidity and low debt profile mitigate financial distress risk, supported by a robust Altman Z-score of 3.55 signaling a safe zone. Investors should weigh these factors carefully.
Should You Buy UiPath Inc.?
UiPath appears to be improving profitability with growing ROIC despite a slightly unfavorable moat, suggesting some value destruction. Its leverage profile seems manageable, supported by a strong Altman Z-score and an A- overall rating, reflecting favorable financial health.
Strength & Efficiency Pillars
UiPath Inc. delivers solid operational performance with a net margin of 17.53% and a gross margin of 82.98%, underscoring efficient cost management. Return on equity stands at a modest 13.56%, reflecting moderate shareholder profitability. However, the company’s ROIC at 2.68% falls below its WACC of 9.14%, indicating that UiPath currently destroys value despite improving profitability. The Altman Z-Score of 3.55 places the firm comfortably in the safe zone, signaling sound solvency.
Weaknesses and Drawbacks
UiPath faces valuation challenges with an unfavorable price-to-book ratio of 3.25, suggesting the stock is priced at a premium relative to its book value. The price-to-earnings ratio of 24.0 is neutral but leans toward the higher side compared to sector averages, possibly reflecting elevated expectations. Despite a strong current ratio of 2.48 and minimal debt-to-equity at 0.03, the stock’s recent market trend is bearish, with sellers dominating at 36.51%, which may pressure near-term price performance.
Our Final Verdict about UiPath Inc.
UiPath’s fundamentals suggest a company with operational strengths but limited value creation. The safe Altman Z-Score supports solvency confidence, yet the bearish stock trend and seller dominance caution investors. Despite long-term financial health, recent market pressure suggests a wait-and-see approach for a better entry point. The profile might appear attractive for investors focused on improving profitability but remains vulnerable to valuation and technical headwinds.
Disclaimer: This content is for informational purposes only and does not constitute financial, investment, or other professional advice. Investing in financial markets involves a significant risk of loss, and past performance is not indicative of future results.
Additional Resources
- Investors Heavily Search UiPath, Inc. (PATH): Here is What You Need to Know – Yahoo Finance (Mar 27, 2026)
- UiPath Announces New Agentic Solution to Accelerate Procurement Cycles – UiPath (Mar 25, 2026)
- Vanguard amends 13G; reports 0 shares in UiPath (NYSE: PATH) – Stock Titan (Mar 27, 2026)
- UiPath Inc (PATH) Shares Gap Down to $10.975 on Mar 24 – GuruFocus (Mar 24, 2026)
- PATH Stock Price, Quote & Chart | UIPATH INC – CLASS A (NYSE:PATH) – ChartMill (Mar 23, 2026)
For more information about UiPath Inc., please visit the official website: uipath.com