Home > Analyses > Technology > UiPath Inc.
UiPath Inc. revolutionizes the way businesses operate by automating complex workflows, seamlessly blending artificial intelligence with robotic process automation. As a dominant force in the infrastructure software industry, UiPath’s platform empowers organizations across banking, healthcare, and government sectors to boost efficiency and reduce human error. Renowned for innovation and a robust suite of low-code tools, the company continues to shape the future of work. Yet, the key question remains: does UiPath’s current valuation fully capture its growth potential in an increasingly automated world?

Table of contents
Business Model & Company Overview
UiPath Inc., founded in 2005 and headquartered in New York City, stands as a leader in the Software – Infrastructure sector, specializing in robotic process automation (RPA). Its core mission revolves around delivering an integrated automation platform that blends AI, low-code development, and process mining to streamline enterprise workflows. The company’s ecosystem enables users to build, manage, and optimize automations across diverse industries including banking, healthcare, and government.
The company’s revenue engine is powered by a balanced mix of software licenses, recurring maintenance, and professional services such as training and implementation. UiPath commands a strategic presence in the Americas, Europe, and Asia, notably in the United States, Romania, and Japan. Its centralized portal and scalable automation tools create a strong economic moat, positioning UiPath at the forefront of the automation revolution shaping the future of enterprise efficiency.
Financial Performance & Fundamental Metrics
This section provides a fundamental analysis of UiPath Inc., examining its income statement, key financial ratios, and dividend payout policy.
Income Statement
This table summarizes UiPath Inc.’s key income statement figures for fiscal years 2021 to 2025, showing revenue, expenses, profits, and earnings per share.
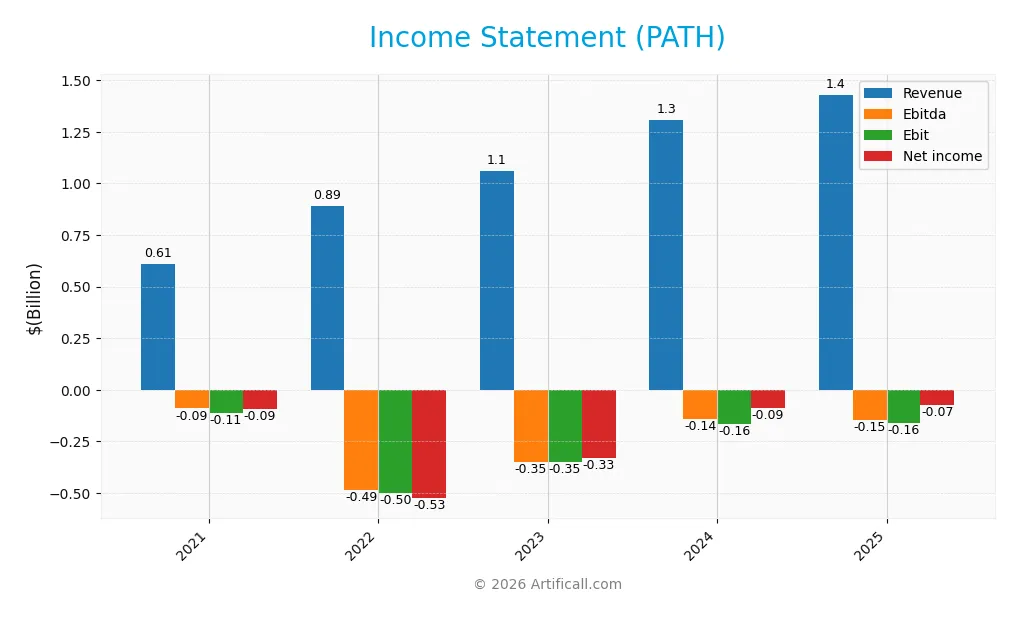
| 2021 | 2022 | 2023 | 2024 | 2025 | |
|---|---|---|---|---|---|
| Revenue | 608M | 892M | 1.06B | 1.31B | 1.43B |
| Cost of Revenue | 66M | 169M | 180M | 196M | 247M |
| Operating Expenses | 652M | 1.22B | 1.23B | 1.28B | 1.35B |
| Gross Profit | 542M | 723M | 879M | 1.11B | 1.18B |
| EBITDA | -91M | -486M | -348M | -142M | -145M |
| EBIT | -110M | -501M | -348M | -165M | -163M |
| Interest Expense | 0 | 0 | 0 | 0 | 0 |
| Net Income | -92M | -526M | -328M | -90M | -74M |
| EPS | -0.18 | -0.97 | -0.60 | -0.16 | -0.13 |
| Filing Date | 2021-01-31 | 2022-04-04 | 2023-03-24 | 2024-03-27 | 2025-03-24 |
Income Statement Evolution
UiPath Inc. experienced robust revenue growth of 9.3% in the past year and 135.28% over the 2021-2025 period, supported by a favorable gross margin at 82.73%. Despite this, the company’s net income remained negative, though it improved by 20.24% overall and net margin grew by 66.1%, signaling margin enhancement amid rising operating expenses aligned with revenue growth.
Is the Income Statement Favorable?
The 2025 income statement shows favorable fundamentals highlighted by a strong gross margin and zero interest expense, supporting operational efficiency. Although EBIT and net margins remain negative at -11.37% and -5.15% respectively, their recent improvements along with a 24.98% net margin growth indicate progress. Overall, 78.57% of income statement metrics are favorable, reflecting positive momentum despite current profitability challenges.
Financial Ratios
The following table presents key financial ratios for UiPath Inc. over the last five fiscal years, providing a clear overview of the company’s profitability, valuation, liquidity, leverage, and efficiency metrics:
| Ratios | 2021 | 2022 | 2023 | 2024 | 2025 |
|---|---|---|---|---|---|
| Net Margin | -15% | -59% | -31% | -7% | -5% |
| ROE | -22% | -27% | -17% | -4% | -4% |
| ROIC | -21% | -24% | -16% | -7% | -7% |
| P/E | -388 | -38 | -26 | -144 | -108 |
| P/B | 86 | 10 | 4.4 | 6.4 | 4.3 |
| Current Ratio | 2.0 | 4.3 | 3.7 | 3.6 | 2.9 |
| Quick Ratio | 2.0 | 4.3 | 3.7 | 3.6 | 2.9 |
| D/E | 0.05 | 0.03 | 0.03 | 0.03 | 0.04 |
| Debt-to-Assets | 2.3% | 2.0% | 2.3% | 2.3% | 2.7% |
| Interest Coverage | 0 | 0 | 0 | 0 | 0 |
| Asset Turnover | 0.70 | 0.35 | 0.39 | 0.44 | 0.50 |
| Fixed Asset Turnover | 19 | 13 | 13 | 16 | 14 |
| Dividend Yield | 0% | 0% | 0% | 0% | 0% |
Evolution of Financial Ratios
Between 2021 and 2025, UiPath Inc. (PATH) experienced a general decline in Return on Equity (ROE), with values remaining negative and slightly improving to -3.99% in 2025. The Current Ratio showed a downward trend from 4.32 in 2022 to 2.93 in 2025, indicating reduced but still strong liquidity. The Debt-to-Equity Ratio remained low and stable around 0.04, reflecting minimal leverage. Profitability remained negative, with a net profit margin of -5.15% in 2025.
Are the Financial Ratios Favorable?
In 2025, profitability ratios such as net margin (-5.15%) and ROE (-3.99%) were unfavorable, while liquidity ratios like the current and quick ratios at 2.93 were favorable. Leverage was low with a debt-to-equity ratio of 0.04, also favorable. Efficiency ratios showed mixed signals: asset turnover was unfavorable at 0.5, whereas fixed asset turnover was favorable at 14.41. Market valuation ratios like price-to-earnings were favorable despite a negative value, but price-to-book was unfavorable at 4.31. Overall, the financial ratios were slightly unfavorable.
Shareholder Return Policy
UiPath Inc. does not pay dividends, reflecting its ongoing net losses and prioritization of reinvestment in growth and operations. The company maintains positive free cash flow coverage, but no dividend payout or yield is reported, consistent with its high-growth phase and operational focus.
Despite the absence of dividends, UiPath does not currently engage in share buybacks. This strategy aligns with sustaining capital for expansion and innovation, supporting potential long-term shareholder value creation amid continued profitability challenges.
Score analysis
The following radar chart illustrates key financial scores assessing UiPath Inc.’s valuation, profitability, and leverage metrics:
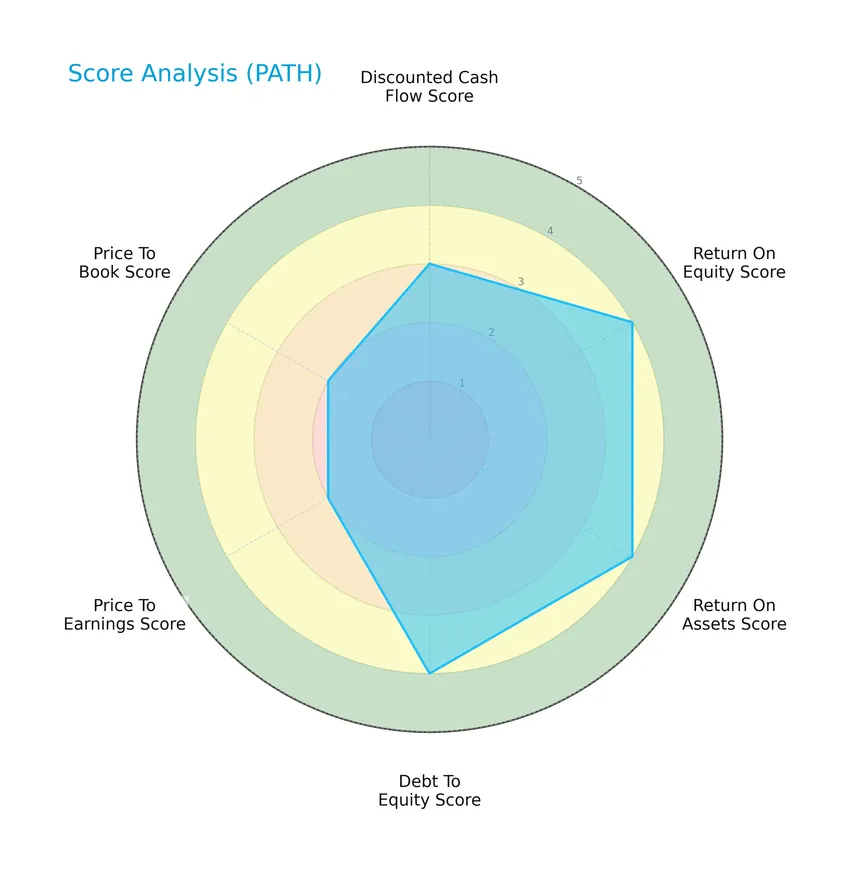
UiPath Inc. shows favorable scores in return on equity, return on assets, and debt to equity, each rated 4, indicating strong profitability and sound leverage. Discounted cash flow holds a moderate score of 3, while valuation metrics price to earnings and price to book are moderate at 2, reflecting some valuation caution.
Analysis of the company’s bankruptcy risk
The Altman Z-Score places UiPath Inc. well within the safe zone, indicating a low likelihood of bankruptcy and solid financial stability:

Is the company in good financial health?
The Piotroski Score diagram provides insight into UiPath Inc.’s financial strength through nine fundamental criteria:

With a Piotroski Score of 7, UiPath Inc. demonstrates strong financial health, suggesting solid profitability, efficiency, and balance sheet quality relative to typical benchmarks.
Competitive Landscape & Sector Positioning
This sector analysis will explore UiPath Inc.’s strategic positioning, revenue breakdown, key products, main competitors, competitive advantages, and SWOT analysis. I will assess whether UiPath holds a competitive advantage within the software infrastructure industry.
Strategic Positioning
UiPath Inc. concentrates on robotic process automation with a diversified product portfolio including licenses, subscription services, and professional services. Geographically, it has a balanced presence across Americas (695M in 2025), EMEA (458M), and Asia Pacific (277M), supporting growth in multiple regions.
Revenue by Segment
This pie chart presents UiPath Inc.’s revenue distribution by segment for fiscal year 2025, illustrating the contribution of License, Professional Services and Other, and Subscription Services.
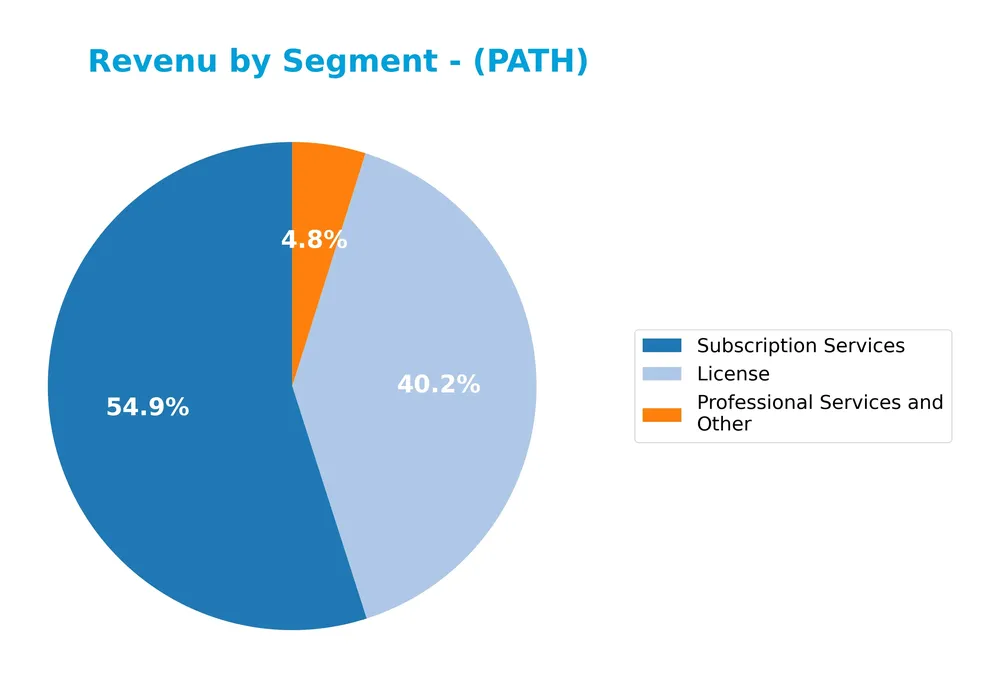
In 2025, UiPath’s revenue is primarily driven by Subscription Services at 802M and License sales at 587M, with Professional Services contributing a smaller 71M. Subscription revenue shows a strong acceleration from 650M in 2024, indicating growing demand for recurring services, while License revenue slightly declined from 621M. The business is increasingly concentrated in Subscription Services, reflecting a strategic shift towards a more stable, subscription-based model.
Key Products & Brands
The following table summarizes UiPath Inc.’s main products and services offered to its clients:
| Product | Description |
|---|---|
| License | Software licenses for UiPath’s end-to-end automation platform that enables robotic process automation (RPA) solutions. |
| Subscription Services | Recurring subscription access to UiPath’s automation platform, including tools for building, managing, and running automations. |
| Professional Services and Other | Services including training, implementation, maintenance, and support to facilitate adoption and effective use of the UiPath automation platform. |
UiPath’s product portfolio centers on its automation platform, combining software licenses, subscription services, and professional support to serve enterprises in banking, healthcare, financial services, and government sectors.
Main Competitors
UiPath Inc. faces competition from a total of 32 companies, with the table below listing the top 10 leaders by market capitalization:
| Competitor | Market Cap. |
|---|---|
| Microsoft Corporation | 3.52T |
| Oracle Corporation | 553B |
| Palantir Technologies Inc. | 383B |
| Adobe Inc. | 140B |
| Palo Alto Networks, Inc. | 120B |
| CrowdStrike Holdings, Inc. | 113B |
| Synopsys, Inc. | 92B |
| Cloudflare, Inc. | 69B |
| Fortinet, Inc. | 59B |
| Block, Inc. | 40B |
UiPath Inc. ranks 24th among its 32 competitors, with a market cap just 0.23% that of the sector leader, Microsoft Corporation. The company’s scale is significantly below both the average market cap of the top 10 competitors (508B) and the sector median (18.8B). UiPath is positioned 54.71% below its next closest competitor above, indicating a substantial gap in market capitalization.
Comparisons with competitors
Check out how we compare the company to its competitors:
Does UiPath have a competitive advantage?
UiPath Inc. currently does not present a clear competitive advantage, as its return on invested capital (ROIC) is below its weighted average cost of capital (WACC), indicating value destruction despite a growing ROIC trend. The company operates in the software infrastructure sector with favorable revenue growth and gross margins but still reports negative net and EBIT margins.
Looking ahead, UiPath’s platform integrates AI with robotic process automation, offering low-code development and centralized management tools, serving key markets in the Americas, EMEA, and Asia Pacific. Continued expansion in these regions and further adoption of automation solutions could provide future growth opportunities.
SWOT Analysis
This SWOT analysis highlights UiPath Inc.’s key internal and external factors to inform strategic investment decisions.
Strengths
- strong revenue growth of 135% over 5 years
- high gross margin at 82.7%
- diversified global presence with growth in Americas, EMEA, Asia Pacific
Weaknesses
- negative EBIT margin at -11.4%
- net loss with -5.15% margin
- moderate asset turnover at 0.5 indicating efficiency challenges
Opportunities
- expanding demand for RPA and AI automation
- growing enterprise adoption of low-code platforms
- potential to increase market share in financial and healthcare sectors
Threats
- increasing competition in automation software
- rapid technology changes require continuous innovation
- economic downturns impacting IT budgets
UiPath shows robust growth and strong market positioning but faces profitability challenges and efficiency constraints. Strategic focus on innovation and cost control is crucial to capitalize on automation demand while mitigating competitive and economic risks.
Stock Price Action Analysis
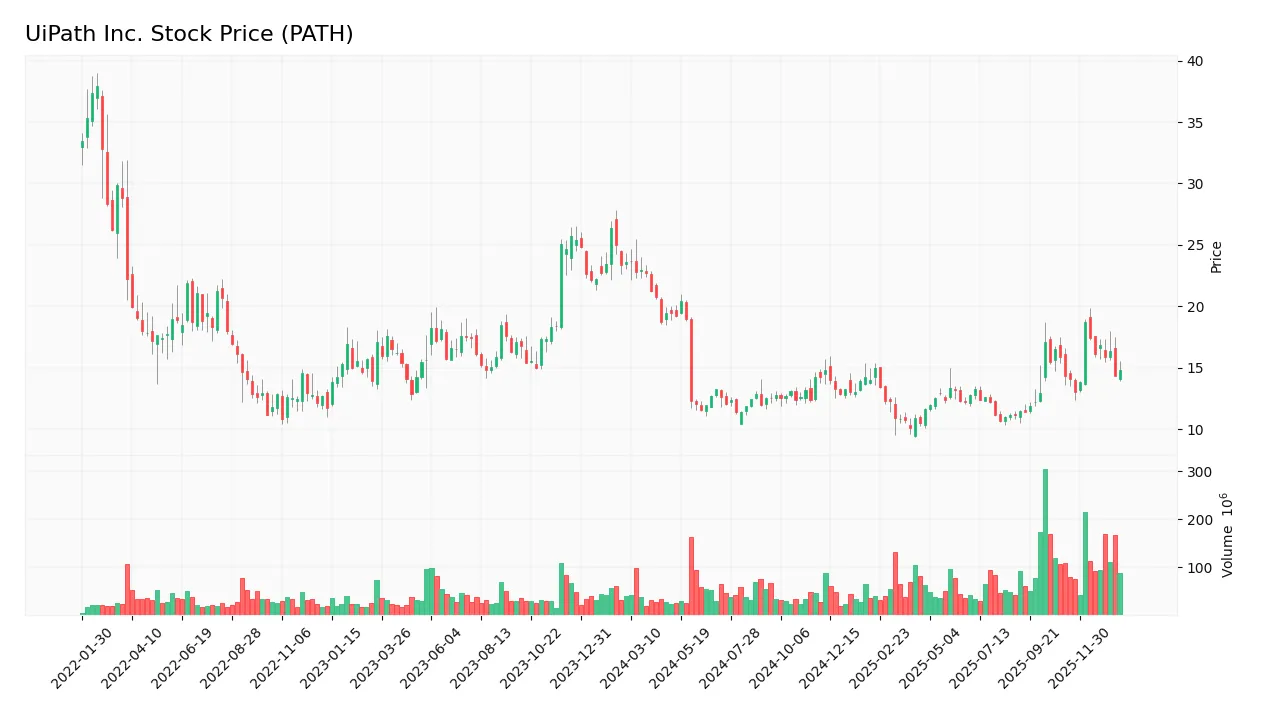
The following weekly stock chart illustrates UiPath Inc.’s price movements over the past 12 months, highlighting key price fluctuations and trend patterns:
Trend Analysis
Over the past 12 months, UiPath Inc.’s stock price declined by 37.37%, indicating a bearish trend with accelerating downward momentum. The stock ranged between a high of 23.66 and a low of 10.04, with notable volatility reflected in a 3.2 standard deviation. However, a slight positive reversal of 3.5% occurred from November 2025 to January 2026.
Volume Analysis
In the last three months, trading volume has been increasing but shows slight seller dominance with buyers accounting for 40.55%. This seller-driven volume suggests cautious investor sentiment and heightened market participation amid recent price stabilization.
Target Prices
The consensus target prices for UiPath Inc. indicate moderate upside potential.
| Target High | Target Low | Consensus |
|---|---|---|
| 19 | 14 | 16.6 |
Analysts expect UiPath’s stock to trade between $14 and $19, with a consensus target around $16.6, reflecting cautious optimism about its growth prospects.
Don’t Let Luck Decide Your Entry Point
Optimize your entry points with our advanced ProRealTime indicators. You’ll get efficient buy signals with precise price targets for maximum performance. Start outperforming now!
Analyst & Consumer Opinions
This section examines the latest grades and consumer feedback regarding UiPath Inc. (PATH) to inform investors.
Stock Grades
Here are the latest stock grades from recognized financial institutions for UiPath Inc., illustrating current analyst sentiment:
| Grading Company | Action | New Grade | Date |
|---|---|---|---|
| Barclays | Maintain | Equal Weight | 2026-01-12 |
| RBC Capital | Maintain | Sector Perform | 2026-01-05 |
| RBC Capital | Maintain | Sector Perform | 2025-12-10 |
| Morgan Stanley | Maintain | Equal Weight | 2025-12-09 |
| DA Davidson | Maintain | Neutral | 2025-12-05 |
| Barclays | Maintain | Equal Weight | 2025-12-04 |
| Needham | Maintain | Hold | 2025-12-04 |
| BMO Capital | Maintain | Market Perform | 2025-12-04 |
| RBC Capital | Maintain | Sector Perform | 2025-12-04 |
| Evercore ISI Group | Maintain | In Line | 2025-12-04 |
The consensus indicates a stable outlook with most analysts maintaining neutral or hold ratings, reflecting cautious confidence without significant upgrades or downgrades across the board.
Consumer Opinions
Consumers of UiPath Inc. (PATH) generally appreciate the company’s innovative automation solutions, though some express concerns about usability and customer support.
| Positive Reviews | Negative Reviews |
|---|---|
| “UiPath’s automation tools significantly boost our operational efficiency.” | “The learning curve is steep for new users, making onboarding difficult.” |
| “Excellent integration capabilities with existing software ecosystems.” | “Customer support response times can be slow during critical issues.” |
| “Regular updates and new features keep the platform competitive.” | “Pricing is high for small to mid-sized enterprises.” |
Overall, users praise UiPath’s cutting-edge automation and integration strengths, but recurring issues with usability and support highlight areas for improvement.
Risk Analysis
Below is a table summarizing the key risks associated with investing in UiPath Inc. (PATH), categorized by type and their assessed probability and impact:
| Category | Description | Probability | Impact |
|---|---|---|---|
| Financial Risk | Negative net margin (-5.15%) and return on equity (-3.99%) indicate ongoing profitability issues. | Medium | High |
| Market Volatility | Beta of 1.08 suggests stock price moves slightly more than the market, increasing price risk. | High | Medium |
| Valuation Risk | Unfavorable price-to-book ratio (4.31) may reflect overvaluation relative to assets. | Medium | Medium |
| Liquidity Risk | Strong current and quick ratios (~2.93) mitigate liquidity concerns. | Low | Low |
| Debt Risk | Very low debt-to-equity (0.04) and debt-to-assets (2.72%) reduce financial leverage risk. | Low | Low |
| Dividend Risk | No dividend yield presents risk for income-focused investors. | High | Low |
| Operational Risk | Asset turnover (0.5) is low, potentially indicating inefficient use of assets. | Medium | Medium |
| Bankruptcy Risk | Altman Z-Score (4.88) places the company safely away from distress or bankruptcy risk. | Low | High |
The most likely and impactful risks stem from UiPath’s continued lack of profitability and market volatility. Despite a strong Altman Z-Score signaling financial stability, negative returns and valuation concerns require cautious monitoring. The company’s solid liquidity and low debt levels provide some risk mitigation but do not offset operational inefficiencies and absent dividend income.
Should You Buy UiPath Inc.?
UiPath Inc. appears to be navigating a challenging profitability landscape with improving operational returns but currently shedding value relative to its cost of capital. Despite a slightly unfavorable moat and moderate leverage profile, the company’s financial health could be seen as resilient, supported by a very favorable B+ rating.
Strength & Efficiency Pillars
UiPath Inc. exhibits a robust financial foundation, underscored by an Altman Z-Score of 4.88, placing it firmly in the safe zone, and a strong Piotroski score of 7, reflecting solid operational health. The company benefits from a high gross margin of 82.73% and favorable debt metrics, including a debt-to-equity ratio of 0.04 and a current ratio of 2.93, signaling sound liquidity. However, its return metrics indicate challenges, with ROIC at -7.41% trailing the WACC of 8.88%, marking the company as a value destroyer despite improving profitability trends.
Weaknesses and Drawbacks
Profitability remains a concern as UiPath’s net margin of -5.15% and ROE of -3.99% are unfavorable, highlighting ongoing operational losses. The valuation presents mixed signals: a negative P/E of -108.04 is favorable due to losses distorting the ratio, yet a high price-to-book ratio of 4.31 suggests the market prices a significant premium, adding valuation risk. Seller dominance at 59.45% in the recent period combined with a bearish overall stock trend and a 37.37% price decline pose short-term headwinds for investors.
Our Verdict about UiPath Inc.
The long-term fundamental profile of UiPath appears moderately unfavorable due to persistent negative returns and value destruction despite improving operational efficiency and strong financial stability. Given the bearish overall trend and seller dominance in the recent period, the investment case suggests caution. Despite the company’s improving profitability and solid financial health, recent market pressure might suggest a wait-and-see approach for a more attractive entry point.
Disclaimer: This content is for informational purposes only and does not constitute financial, investment, or other professional advice. Investing in financial markets involves a significant risk of loss, and past performance is not indicative of future results.
Additional Resources
- Is Trending Stock UiPath, Inc. (PATH) a Buy Now? – Yahoo Finance (Jan 23, 2026)
- Barclays is bullish on UiPath, Inc. (PATH) amid stable IT spending outlook – MSN (Jan 22, 2026)
- Why Is UiPath (PATH) Stock Soaring Today – Finviz (Jan 22, 2026)
- UiPath Inc (PATH) Shares Up 4.68% on Jan 22 – GuruFocus (Jan 22, 2026)
- UiPath, Inc. $PATH Shares Sold by Sumitomo Mitsui Trust Group Inc. – MarketBeat (Jan 20, 2026)
For more information about UiPath Inc., please visit the official website: uipath.com


