Home > Analyses > Real Estate > UDR, Inc.
UDR, Inc. transforms how tens of thousands live by managing vibrant multifamily communities across key U.S. markets. As a top-tier REIT, it excels in acquiring, developing, and redeveloping residential properties with an unwavering focus on quality and resident satisfaction. With nearly five decades of consistent value creation, UDR commands respect for its operational discipline and innovation. The pressing question now: does its solid track record still justify its current market valuation and growth prospects?
Table of contents
Business Model & Company Overview
UDR, Inc. is a premier multifamily real estate investment trust headquartered in Highlands Ranch, Colorado. Founded in 1980, it commands a leading position in the U.S. residential REIT sector. UDR manages a vast ecosystem of 51,649 apartment homes, blending development, redevelopment, and asset management to create vibrant living communities that deliver superior resident experiences and investor returns.
The company’s revenue engine balances steady rental income from a diversified portfolio with strategic property development and redevelopment projects. UDR’s footprint spans targeted U.S. markets, leveraging deep local knowledge and operational expertise. Its economic moat lies in its proven ability to sustain long-term value through disciplined asset management and a strong brand that shapes the multifamily housing landscape.
Financial Performance & Fundamental Metrics
I will analyze UDR, Inc.’s income statement, key financial ratios, and dividend payout policy to assess its underlying financial health and shareholder value.
Income Statement
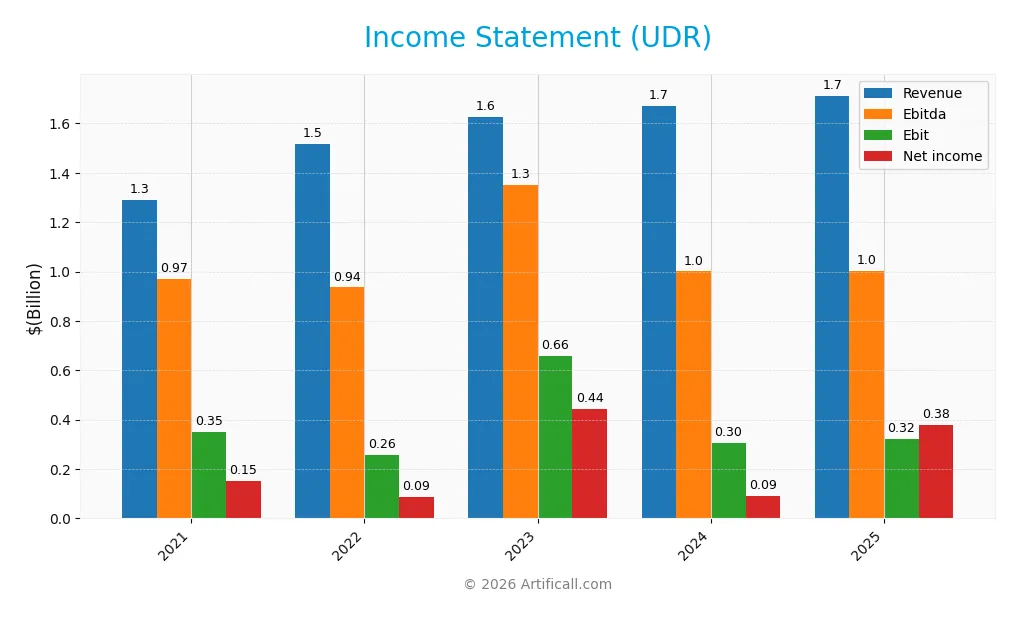
The table below summarizes UDR, Inc.’s key income statement metrics from 2021 to 2025, illustrating revenue trends and profitability dynamics in dollars (USD).
| 2021 | 2022 | 2023 | 2024 | 2025 | |
|---|---|---|---|---|---|
| Revenue | 1.29B | 1.52B | 1.63B | 1.67B | 1.71B |
| Cost of Revenue | 1.06B | 1.19B | 1.23B | 1.25B | 1.27B |
| Operating Expenses | -39.9M | 80.2M | -242.5M | 132.4M | 115.8M |
| Gross Profit | 228M | 331M | 393M | 417M | 438M |
| EBITDA | 969M | 935M | 1.35B | 1.00B | 1.00B |
| EBIT | 349M | 256M | 657M | 305M | 322M |
| Interest Expense | 186M | 163M | 181M | 208M | 0 |
| Net Income | 150M | 87M | 444M | 85M | 378M |
| EPS | 0.49 | 0.26 | 1.34 | 0.26 | 1.13 |
| Filing Date | 2022-02-15 | 2023-02-13 | 2024-02-20 | 2025-02-18 | 2026-02-17 |
Income Statement Evolution
UDR’s revenue rose steadily from 1.29B in 2021 to 1.71B in 2025, marking a 32.7% growth overall. Net income expanded even faster, climbing from 150M to 378M, reflecting a 151.8% increase. Margins improved notably, with gross margin at 25.6% and net margin more than doubling, signaling enhanced profitability and operational efficiency.
Is the Income Statement Favorable?
The 2025 income statement shows strong fundamentals. Gross profit grew 5.1% year-over-year despite slower revenue growth of 2.4%. Operating expenses remained well-controlled relative to revenue. The EBIT margin stands at a favorable 18.8%, and net margin surged to 22.1%. EPS growth of 335% confirms improved shareholder returns, supporting a generally favorable assessment.
Financial Ratios
The following table summarizes key financial ratios for UDR, Inc. over the past five fiscal years, reflecting profitability, liquidity, leverage, and valuation metrics:
| Ratios | 2021 | 2022 | 2023 | 2024 | 2025 |
|---|---|---|---|---|---|
| Net Margin | 11.6% | 5.7% | 27.3% | 5.4% | 22.1% |
| ROE | 4.4% | 2.1% | 11.1% | 2.6% | 11.5% |
| ROIC | 2.6% | 2.4% | 5.8% | 2.7% | 29.4% |
| P/E | 120.1 | 143.3 | 28.3 | 159.6 | 32.1 |
| P/B | 5.23 | 3.04 | 3.15 | 4.15 | 3.68 |
| Current Ratio | 0.09 | 0.11 | 0.31 | 0.39 | 3.31 |
| Quick Ratio | 0.09 | 0.11 | 0.31 | 0.39 | 3.31 |
| D/E | 1.63 | 1.39 | 1.50 | 1.75 | 1.88 |
| Debt-to-Assets | 52.0% | 51.4% | 52.6% | 55.1% | 58.3% |
| Interest Coverage | 1.44 | 1.54 | 3.51 | 1.37 | 0.00 |
| Asset Turnover | 0.12 | 0.14 | 0.14 | 0.15 | 0.16 |
| Fixed Asset Turnover | 6.54 | 7.82 | 8.54 | 8.94 | 9.13 |
| Dividend Yield | 2.43% | 3.92% | 4.33% | 3.94% | 4.68% |
Evolution of Financial Ratios
UDR’s Return on Equity (ROE) showed moderate improvement, rising to 11.5% in 2025, reflecting stable profitability. The Current Ratio increased sharply to 3.31, indicating improved liquidity but possibly excessive short-term assets. The Debt-to-Equity Ratio climbed to 1.88, signaling higher leverage compared to prior years, suggesting more reliance on debt financing.
Are the Financial Ratios Fovorable?
Profitability metrics like net margin (22.1%) and ROIC (29.4%) are favorable, supported by a WACC of 5.8%. Liquidity is mixed; a high Current Ratio contrasts with a favorable Quick Ratio. Leverage ratios, including debt-to-equity (1.88) and debt-to-assets (58.3%), are unfavorable, raising solvency concerns. Market valuation ratios (PE 32.1, PB 3.68) appear stretched. Overall, ratios are slightly favorable with balanced strengths and risks.
Shareholder Return Policy
UDR, Inc. maintains a consistent dividend policy with a payout ratio near 1.5 and a dividend yield around 4.7% in 2025. The dividend per share has steadily increased, supported by free cash flow coverage, while share buybacks also contribute to shareholder returns.
The payout appears sustainable, balancing distributions and capital allocation amid leverage levels above industry norms. This policy supports long-term value creation, though investors should monitor debt ratios and dividend coverage for potential risks.
Score analysis
The following radar chart presents UDR, Inc.’s key financial scores to assess its valuation and profitability metrics:
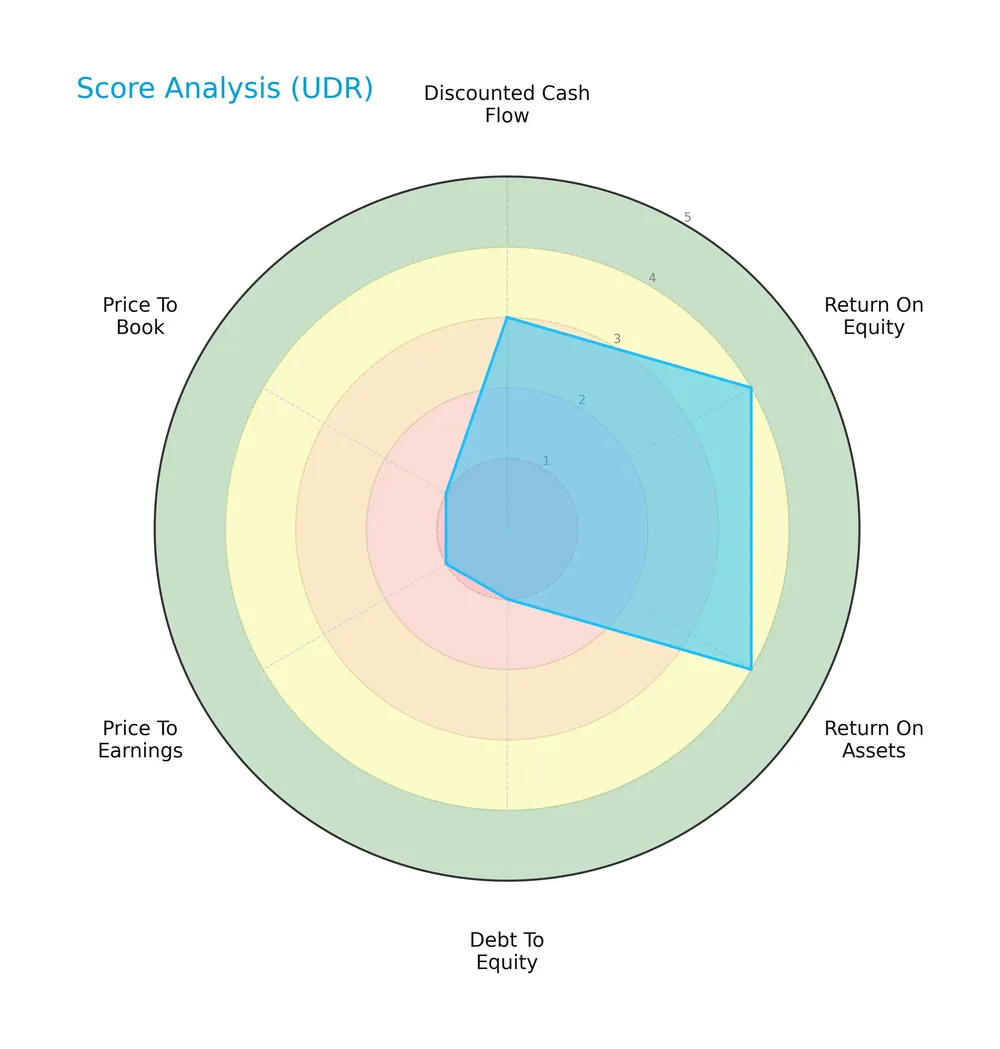
UDR shows strong profitability with favorable ROE and ROA scores of 4 each. However, valuation metrics like PE and PB scores are very unfavorable at 1. The company’s debt-to-equity ratio also scores poorly, indicating high leverage risk. The discounted cash flow score is moderate at 3, reflecting mixed signals on intrinsic value.
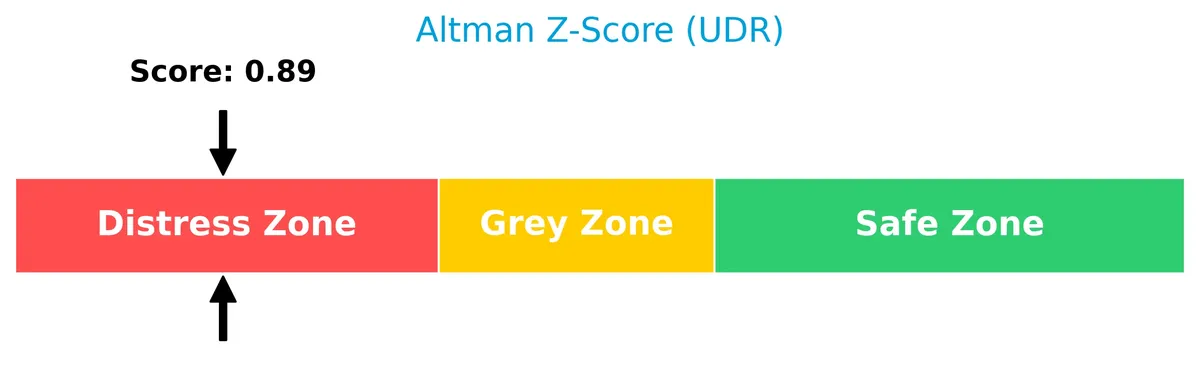
Analysis of the company’s bankruptcy risk
UDR’s Altman Z-Score places it in the distress zone, signaling a significant risk of financial distress and potential bankruptcy:
Is the company in good financial health?
The Piotroski Score diagram illustrates UDR’s strong financial health based on profitability, liquidity, and efficiency:
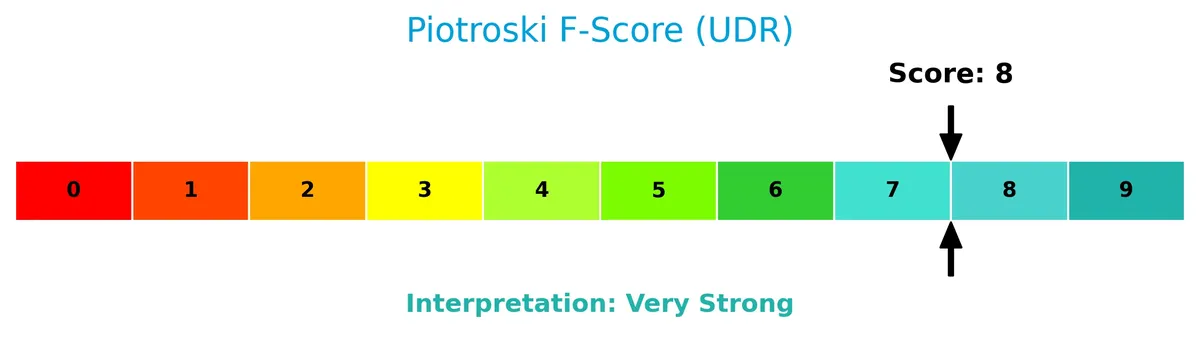
With a Piotroski Score of 8, UDR ranks very strong. This suggests solid fundamentals despite other risk indicators, reflecting robust operational performance and financial strength.
Competitive Landscape & Sector Positioning
This section analyzes UDR, Inc.’s strategic positioning within the residential REIT sector. It reviews revenue segmentation, key products, and principal competitors. I will assess whether UDR holds a competitive advantage over its peers.
Strategic Positioning
UDR, Inc. concentrates on residential multifamily real estate within the U.S., focusing on targeted regional markets like Western and Mid-Atlantic. The company’s product offering centers on managing and developing apartment communities, reflecting a specialized portfolio rather than broad diversification.
Revenue by Segment
This pie chart illustrates UDR, Inc.’s revenue distribution by segment for the fiscal year 2023, highlighting the evolution of their business focus over recent years.
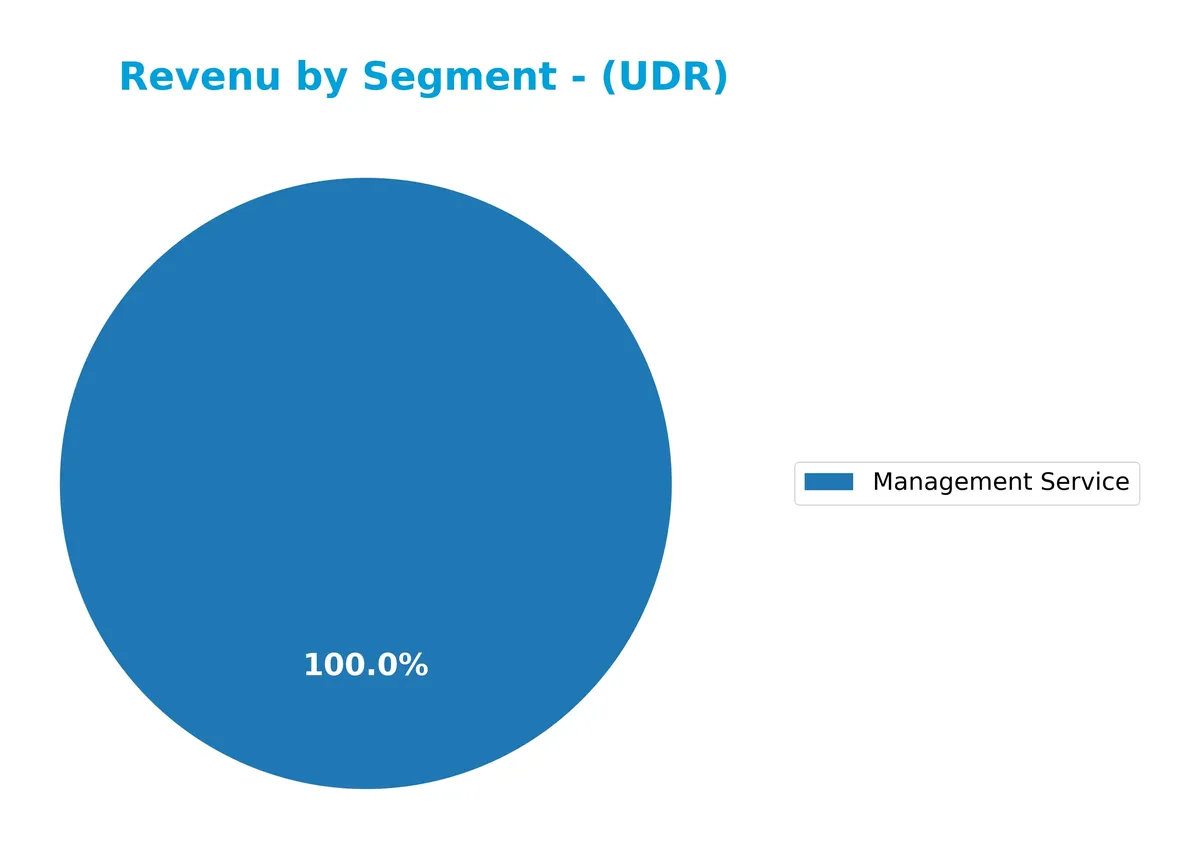
UDR’s revenue in 2023 centers solely on the Management Service segment, which generated $6.8M. Historically, Total Communities and Non Mature Communities Other dominated revenue, with figures as high as $948M and $223M in 2016. The shift to a single segment signals a strategic refocus or divestment, raising concentration risk. The recent uptick in Management Service revenue from $5M in 2022 to $6.8M in 2023 suggests modest acceleration in this area.
Key Products & Brands
The table below outlines UDR, Inc.’s key products and brands with concise descriptions:
| Product | Description |
|---|---|
| Management Service | Provides property management services for multifamily residential communities, generating $6.8M in revenue in 2023. |
| Non Mature Communities Other | Revenue from newer or developing residential communities, reported at $95.4M in 2018 and fluctuating in prior years. |
| Total Communities | Aggregate revenue from all residential communities managed, reaching $948.5M in 2016. |
UDR focuses on managing multifamily residential real estate, generating revenue primarily through management services and rental income from both mature and developing communities.
Main Competitors
There are 7 competitors in total, with the table listing the top 7 leaders by market capitalization:
| Competitor | Market Cap. |
|---|---|
| AvalonBay Communities, Inc. | 25.6B |
| Equity Residential | 23.6B |
| Invitation Homes Inc. | 17.0B |
| Essex Property Trust, Inc. | 16.5B |
| Mid-America Apartment Communities, Inc. | 16.3B |
| UDR, Inc. | 12.1B |
| Camden Property Trust | 11.7B |
UDR, Inc. ranks 6th among its peers, with a market cap approximately 49% of AvalonBay Communities, the sector leader. The company sits below both the average market cap of 17.6B and the median of 16.5B in its sector. It holds a 29.7% market cap gap from its closest competitor above, reflecting a moderate scale difference within the top tier.
Comparisons with competitors
Check out how we compare the company to its competitors:
Does UDR have a competitive advantage?
UDR demonstrates a sustainable competitive advantage, consistently generating ROIC well above its WACC by 23.6%. This indicates efficient capital use and strong value creation over 2021-2025. The company’s ROIC trend shows significant growth, reinforcing its ability to maintain profitability and fend off competitors in the residential REIT sector.
Looking ahead, UDR’s extensive portfolio of 51,649 apartment homes and ongoing developments position it to capitalize on expanding U.S. multifamily markets. Its history of redeveloping attractive communities suggests opportunities for steady income growth and enhanced asset value in targeted regions.
SWOT Analysis
This SWOT analysis distills UDR, Inc.’s core strategic factors to guide investment decisions.
Strengths
- Strong ROIC well above WACC
- Long-term value creation track record
- Leading multifamily REIT in key U.S. markets
Weaknesses
- High debt-to-equity ratio (1.88)
- Elevated price multiples (PE 32.1, PB 3.7)
- Low Altman Z-Score signals financial distress risk
Opportunities
- Growing net margin and EPS
- Favorable dividend yield (4.68%)
- Expansion in non-mature communities
Threats
- Interest rate fluctuations
- Regulatory changes in real estate sector
- Competitive market pressures in residential REITs
UDR’s strengths in profitability and market position underpin a sustainable competitive advantage. However, elevated leverage and valuation caution require vigilant risk management. The company’s strategy should focus on leveraging growth opportunities while controlling debt and safeguarding margins.
Stock Price Action Analysis
The following weekly chart illustrates UDR, Inc.’s stock price movement over the past 12 months, highlighting key fluctuations and trend shifts:
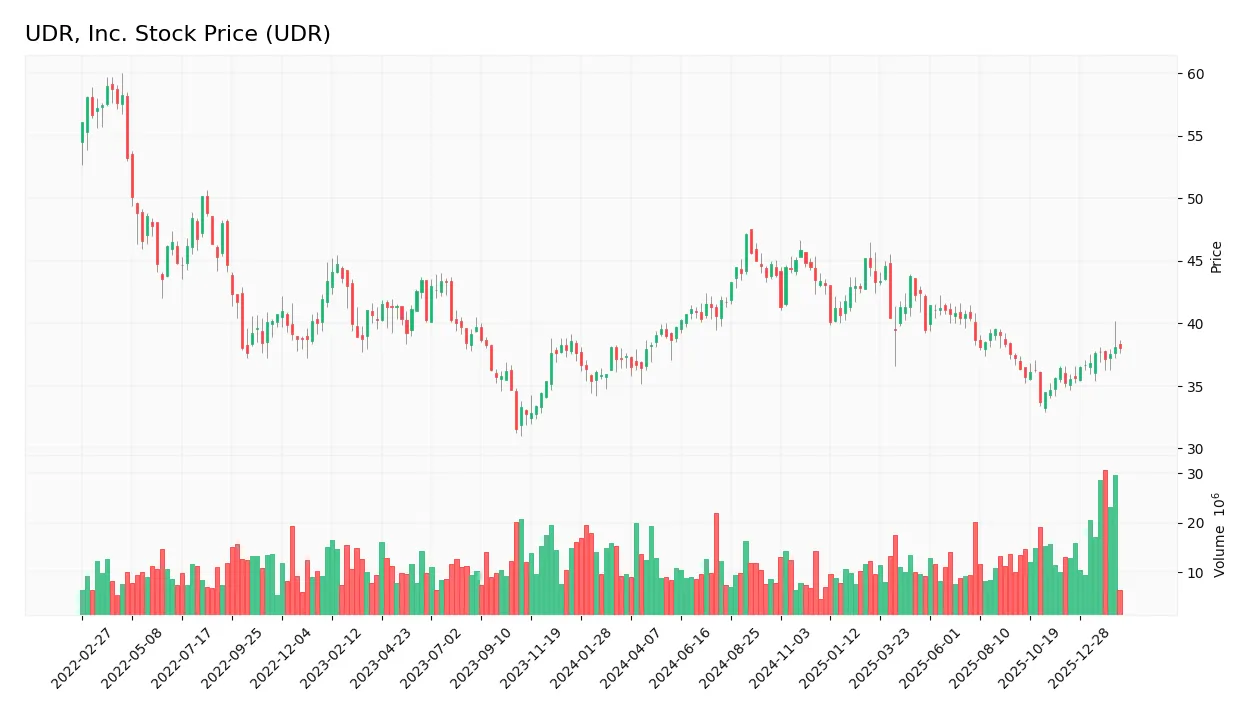
Trend Analysis
Over the past 12 months, UDR’s stock price increased by 1.58%, indicating a bullish trend by definition. The trend shows acceleration, supported by a 3.1 standard deviation reflecting moderate volatility. The price ranged between 33.69 and 47.13, with recent gains suggesting strengthening momentum.
Volume Analysis
Trading volume for UDR has increased, with buyers accounting for 54% overall and rising to nearly 77% dominance recently. This strong buyer-driven activity points to growing investor interest and confidence in the stock’s near-term outlook.
Target Prices
Analysts set a clear target consensus for UDR, Inc., indicating moderate upside potential.
| Target Low | Target High | Consensus |
|---|---|---|
| 38 | 44 | 41.36 |
The target range suggests steady growth expectations. The consensus price of 41.36 reflects cautious optimism in the current market cycle.

Don’t Let Luck Decide Your Entry Point
Optimize your entry points with our advanced ProRealTime indicators. You’ll get efficient buy signals with precise price targets for maximum performance. Start outperforming now!
Analyst & Consumer Opinions
This section examines UDR, Inc.’s recent analyst grades and consumer feedback to provide a balanced performance overview.
Stock Grades
Here is a summary of recent stock grades from recognized financial institutions for UDR, Inc.:
| Grading Company | Action | New Grade | Date |
|---|---|---|---|
| RBC Capital | Maintain | Sector Perform | 2026-02-11 |
| Cantor Fitzgerald | Maintain | Neutral | 2026-02-11 |
| Evercore ISI Group | Maintain | Outperform | 2026-02-11 |
| Goldman Sachs | Maintain | Sell | 2026-01-20 |
| Truist Securities | Upgrade | Buy | 2026-01-20 |
| UBS | Maintain | Buy | 2026-01-08 |
| JP Morgan | Downgrade | Underweight | 2025-12-18 |
| Truist Securities | Maintain | Hold | 2025-12-01 |
| Barclays | Maintain | Overweight | 2025-11-25 |
| Mizuho | Maintain | Neutral | 2025-11-24 |
Grades show a mixed outlook with several firms maintaining neutral or hold positions, while Truist Securities notably upgraded to buy. The consensus leans toward a buy rating, reflecting moderate confidence amid varied analyst views.
Consumer Opinions
UDR, Inc. consistently draws attention for its quality living spaces, but some tenants voice concerns about service responsiveness.
| Positive Reviews | Negative Reviews |
|---|---|
| Spacious, modern apartments with great amenities. | Maintenance requests sometimes delayed. |
| Friendly, professional management staff. | Occasional noise issues from neighbors. |
| Well-maintained community areas and landscaping. | Rent increases perceived as steep. |
Overall, tenants praise UDR’s property quality and management professionalism. However, service delays and rent hikes emerge as recurring concerns. These factors shape the company’s reputation in tenant satisfaction.
Risk Analysis
Below is a summary of key risks facing UDR, Inc. with their probability and potential impact:
| Category | Description | Probability | Impact |
|---|---|---|---|
| Financial Health | Altman Z-Score of 0.89 signals distress zone, bankruptcy risk. | High | High |
| Leverage | Debt to equity ratio of 1.88 and 58.34% debt to assets is high. | High | High |
| Valuation | Elevated P/E (32.08) and P/B (3.68) ratios suggest overvaluation. | Medium | Medium |
| Market Volatility | Beta of 0.707 indicates lower market sensitivity but still risk. | Medium | Medium |
| Operational | Asset turnover at 0.16 is low, limiting efficiency gains. | Medium | Medium |
I see the greatest risks stem from UDR’s financial distress signals and high leverage. The Altman Z-Score well below 1.8 warns of bankruptcy risk despite a strong Piotroski score of 8. High debt burdens remain a red flag in a rising interest rate environment. Valuation metrics also imply limited margin for error. Prudence is essential in assessing this REIT’s risk-reward balance.
Should You Buy UDR, Inc.?
UDR, Inc. appears to be improving profitability with a durable competitive moat evidenced by a growing ROIC well above WACC. Despite a substantial leverage profile and some valuation concerns, its overall B- rating suggests a cautiously favorable value creation potential.
Strength & Efficiency Pillars
UDR, Inc. exhibits strong operational profitability with a net margin of 22.06% and an EBIT margin of 18.83%. Its return on invested capital (ROIC) stands at a robust 29.38%, significantly exceeding the weighted average cost of capital (WACC) of 5.78%. This clear spread confirms UDR as a value creator, demonstrating an ability to generate returns well above its capital costs. Additionally, the company’s dividend yield of 4.68% supports shareholder value, underpinned by favorable fixed asset turnover and interest coverage metrics.
Weaknesses and Drawbacks
The Altman Z-Score signals financial distress for UDR, Inc., with a low score of 0.89 placing it firmly in the distress zone. This heightens bankruptcy risk and overshadows operational strengths. The company also faces valuation concerns, reflected in a premium P/E of 32.08 and a P/B of 3.68, suggesting overvaluation compared to industry norms. Leverage is elevated with a debt-to-equity ratio of 1.88 and debt-to-assets at 58.34%, increasing financial risk despite a strong current ratio of 3.31. These factors introduce material solvency and market pressure risks.
Our Final Verdict about UDR, Inc.
Despite UDR’s operational efficiency and strong profitability, the critical solvency warning from the Altman Z-Score makes this profile highly speculative. The risk of financial distress outweighs favorable margins and growth trends. Conservative investors should regard UDR as too risky for stable capital allocation, while more risk-tolerant participants might consider its value creation potential, tempered by the need for vigilant risk management.
Disclaimer: This content is for informational purposes only and does not constitute financial, investment, or other professional advice. Investing in financial markets involves a significant risk of loss, and past performance is not indicative of future results.
Additional Resources
- UDR, Inc. SEC 10-K Report – TradingView (Feb 17, 2026)
- Decoding UDR Inc (UDR): A Strategic SWOT Insight – GuruFocus (Feb 18, 2026)
- UDR, Inc. Announces Fourth Quarter and Full-Year 2025 Results, Establishes 2026 Guidance Ranges and Increases Dividend – Business Wire (Feb 09, 2026)
- UDR, Inc. Reports Profitable Q4 And Increased Full-Year Earnings – Nasdaq (Feb 09, 2026)
- UDR Stock: Quiet Apartment REIT May Be Setting Up Its Next Move – AD HOC NEWS (Feb 17, 2026)
For more information about UDR, Inc., please visit the official website: udr.com