Home > Analyses > Financial Services > U.S. Bancorp
U.S. Bancorp powers everyday financial lives across the Midwest and West with a vast network of branches and ATMs. It commands respect as a regional banking titan, delivering corporate lending, wealth management, and payment solutions. Its reputation for steady innovation and service quality has solidified its market position since 1863. As 2026 unfolds, I ask: do U.S. Bancorp’s fundamentals still justify its valuation and growth prospects amid shifting economic tides?

Table of contents
Business Model & Company Overview
U.S. Bancorp, founded in 1863 and headquartered in Minneapolis, MN, stands as a dominant regional bank with a broad financial ecosystem. It serves individuals, businesses, and institutions through Corporate and Commercial Banking, Wealth Management, Payment Services, and more. Its network includes 2,230 banking offices and 4,059 ATMs, mainly across the Midwest and West, complemented by robust digital platforms.
The company’s revenue engine balances traditional lending and deposit services with asset management, treasury, and capital markets solutions. This diversified mix fuels growth across the Americas, with strategic outreach in key global markets. U.S. Bancorp’s economic moat lies in its integrated service model and expansive distribution network, positioning it as a critical player shaping regional finance.
Financial Performance & Fundamental Metrics
I analyze U.S. Bancorp’s income statement, key financial ratios, and dividend payout policy to assess its profitability, stability, and shareholder returns.
Income Statement
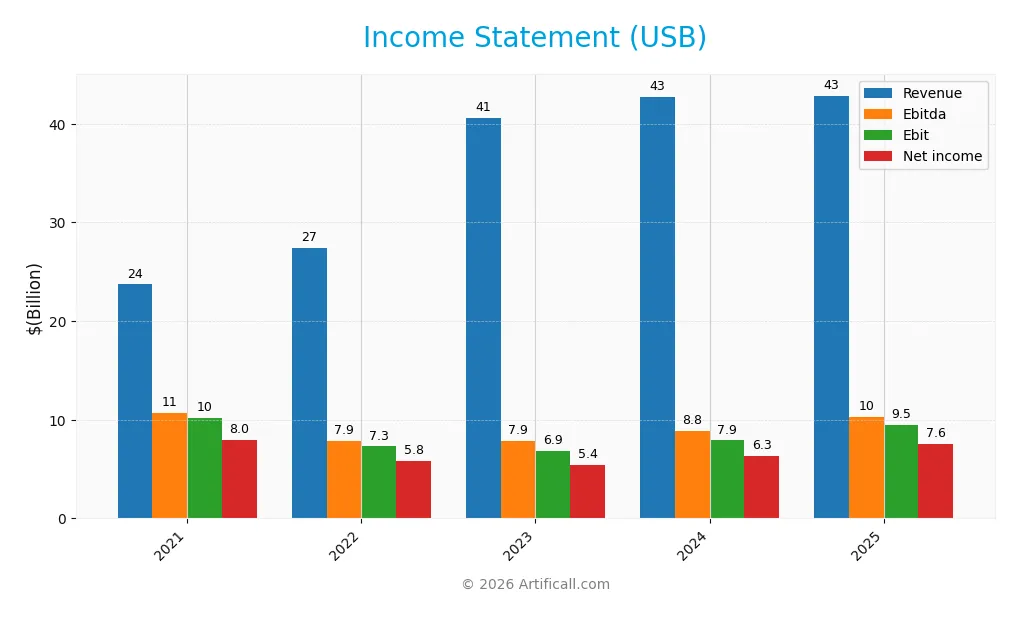
This table summarizes U.S. Bancorp’s key income statement items from 2021 to 2025, reflecting revenue, expenses, profits, and earnings per share.
| 2021 | 2022 | 2023 | 2024 | 2025 | |
|---|---|---|---|---|---|
| Revenue | 23.7B | 27.4B | 40.6B | 42.7B | 42.9B |
| Cost of Revenue | -180M | 5.2B | 14.9B | 17.6B | 15.9B |
| Operating Expenses | 13.7B | 14.9B | 18.9B | 17.2B | 17.4B |
| Gross Profit | 23.9B | 22.2B | 25.7B | 25.1B | 26.9B |
| EBITDA | 10.7B | 7.9B | 7.9B | 8.8B | 10.3B |
| EBIT | 10.2B | 7.3B | 6.9B | 7.9B | 9.5B |
| Interest Expense | 993M | 3.2B | 12.6B | 15.4B | 14.3B |
| Net Income | 7.96B | 5.83B | 5.43B | 6.30B | 7.58B |
| EPS | 5.11 | 3.69 | 3.27 | 3.79 | 4.62 |
| Filing Date | 2022-02-22 | 2023-02-27 | 2024-02-20 | 2025-02-21 | 2026-02-23 |
Income Statement Evolution
U.S. Bancorp’s revenue rose significantly by 81% from 2021 to 2025 but slowed to 0.35% growth in 2025. Gross profit improved 7.3% in the last year, reflecting better cost management. EBIT and net margins expanded to 22.2% and 17.7%, respectively, showing enhanced profitability despite slight margin compression over the full period.
Is the Income Statement Favorable?
In 2025, fundamentals appear generally favorable. The company posted a 20.3% EBIT growth and nearly 20% net margin improvement year-over-year, driven by disciplined operating expense control. However, the interest expense ratio at 33.4% remains a concern, somewhat offsetting gains. Overall, 57% of income statement metrics rate favorable, supporting a positive income statement outlook.
Financial Ratios
The table below presents key financial ratios for U.S. Bancorp over the fiscal years 2021 to 2025, illustrating profitability, valuation, liquidity, leverage, and efficiency metrics:
| Ratios | 2021 | 2022 | 2023 | 2024 | 2025 |
|---|---|---|---|---|---|
| Net Margin | 33.6% | 21.3% | 13.4% | 14.7% | 17.7% |
| ROE | 14.5% | 11.5% | 9.8% | 10.8% | 11.6% |
| ROIC | 6.8% | 3.9% | 3.6% | 4.0% | 11.1% |
| P/E | 10.5 | 11.1 | 12.3 | 11.8 | 11.0 |
| P/B | 1.52 | 1.28 | 1.21 | 1.27 | 1.27 |
| Current Ratio | 0.37 | 0.24 | 0.26 | 0.28 | 2.73 |
| Quick Ratio | 0.37 | 0.24 | 0.26 | 0.28 | 2.73 |
| D/E | 0.80 | 1.40 | 1.21 | 1.26 | 1.20 |
| Debt-to-Assets | 7.7% | 10.1% | 10.1% | 10.8% | 11.3% |
| Interest Coverage | 10.2x | 2.3x | 0.54x | 0.51x | 0.66x |
| Asset Turnover | 0.041 | 0.041 | 0.061 | 0.063 | 0.062 |
| Fixed Asset Turnover | 7.18 | 7.10 | 11.2 | 12.0 | 11.4 |
| Dividend Yield | 3.5% | 4.7% | 5.0% | 4.6% | 3.8% |
Evolution of Financial Ratios
Return on Equity (ROE) showed a slight increase from 9.8% in 2023 to 11.6% in 2025, indicating modest improvement in profitability. The Current Ratio jumped significantly to 2.73 in 2025 from below 0.4 in previous years, reflecting strengthened liquidity. Debt-to-Equity Ratio slightly decreased but remained elevated near 1.2, signaling persistent leverage concerns.
Are the Financial Ratios Fovorable?
In 2025, profitability metrics like net margin (17.7%) and price-to-earnings ratio (10.95) are favorable, supporting earnings strength. Liquidity ratios, including current and quick ratios at 2.73, are solid. However, leverage remains high with a debt-to-equity ratio of 1.2 and weak interest coverage at 0.66, raising caution. Asset turnover is low at 0.06, suggesting efficiency challenges. Overall, 57% of ratios are favorable, indicating a generally positive but mixed financial profile.
Shareholder Return Policy
U.S. Bancorp maintains a steady dividend policy with a payout ratio near 41% in 2025 and a dividend yield of approximately 3.8%. Dividends per share have shown a modest increase, supported by consistent net income, while the company also engages in share buybacks.
The dividend payout appears well-covered by earnings, suggesting a sustainable distribution model. This balance between dividends and buybacks supports long-term shareholder value, reflecting prudent capital allocation amid stable profitability.
Score analysis
Below is a radar chart summarizing U.S. Bancorp’s key financial scores across valuation, profitability, and leverage metrics:
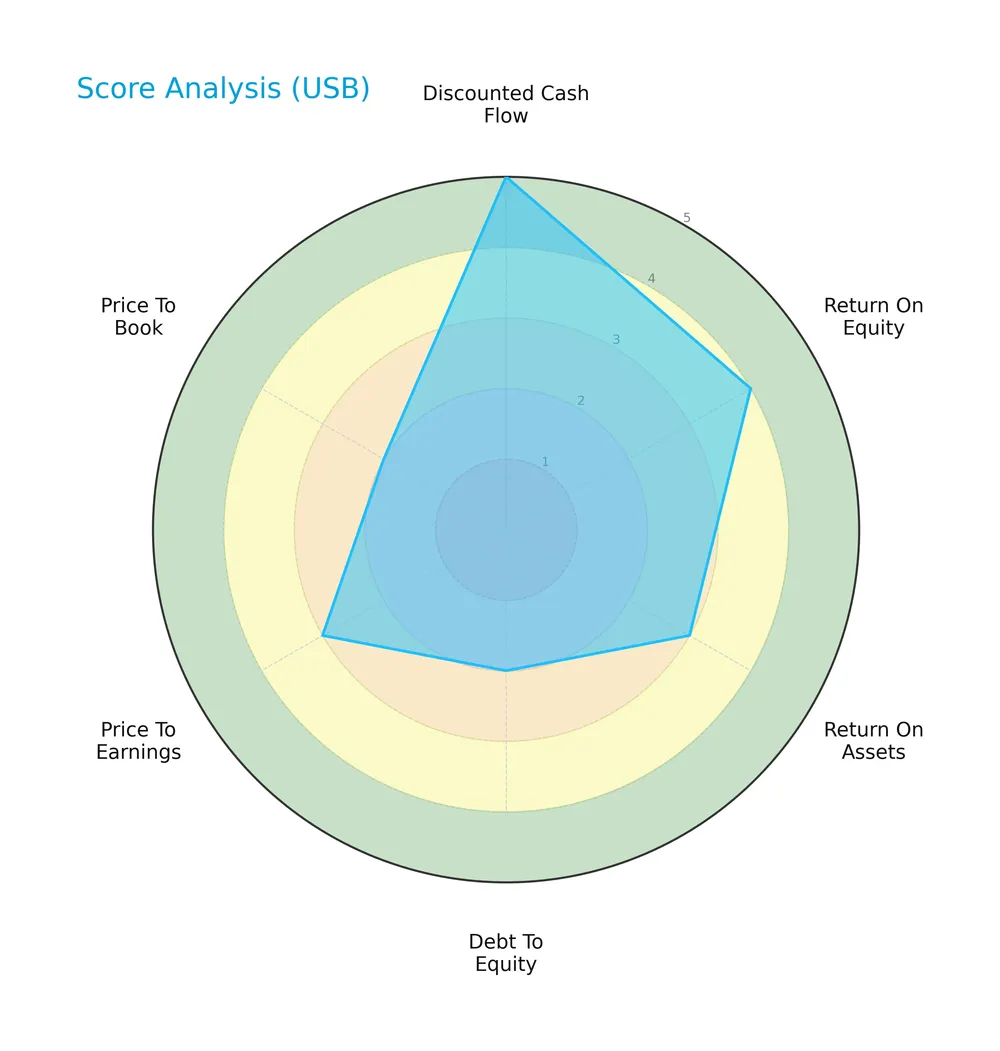
U.S. Bancorp shows strong discounted cash flow and solid return on equity scores. Asset returns and price-to-earnings are moderate. Debt-to-equity and price-to-book ratios appear unfavorable, indicating leverage and valuation concerns.
Analysis of the company’s bankruptcy risk
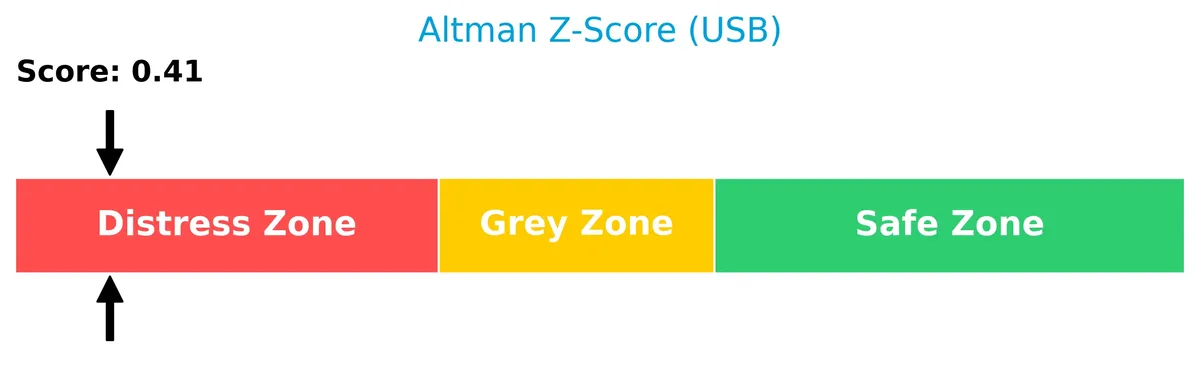
The Altman Z-Score places U.S. Bancorp in the distress zone, signaling a high risk of financial distress and potential bankruptcy:
Is the company in good financial health?
This Piotroski diagram evaluates U.S. Bancorp’s overall financial strength based on profitability, leverage, and efficiency:

With a score of 6, U.S. Bancorp exhibits average financial health, suggesting moderate operational resilience but room for improvement in stability and value metrics.
Competitive Landscape & Sector Positioning
This analysis explores U.S. Bancorp’s strategic positioning, revenue segments, key products, and main competitors. I will assess whether U.S. Bancorp holds a competitive advantage relative to its peers.
Strategic Positioning
U.S. Bancorp maintains a diversified financial services portfolio, spanning Consumer and Small Business Banking, Wealth Management, Payment Services, and Treasury support. Its operations concentrate primarily in the U.S., with a strong regional presence in the Midwest and West, supported by over 2,200 branches and 4,000 ATMs.
Revenue by Segment
This pie chart illustrates U.S. Bancorp’s revenue distribution by segment for the fiscal year 2024, highlighting the key business drivers and their relative contributions.
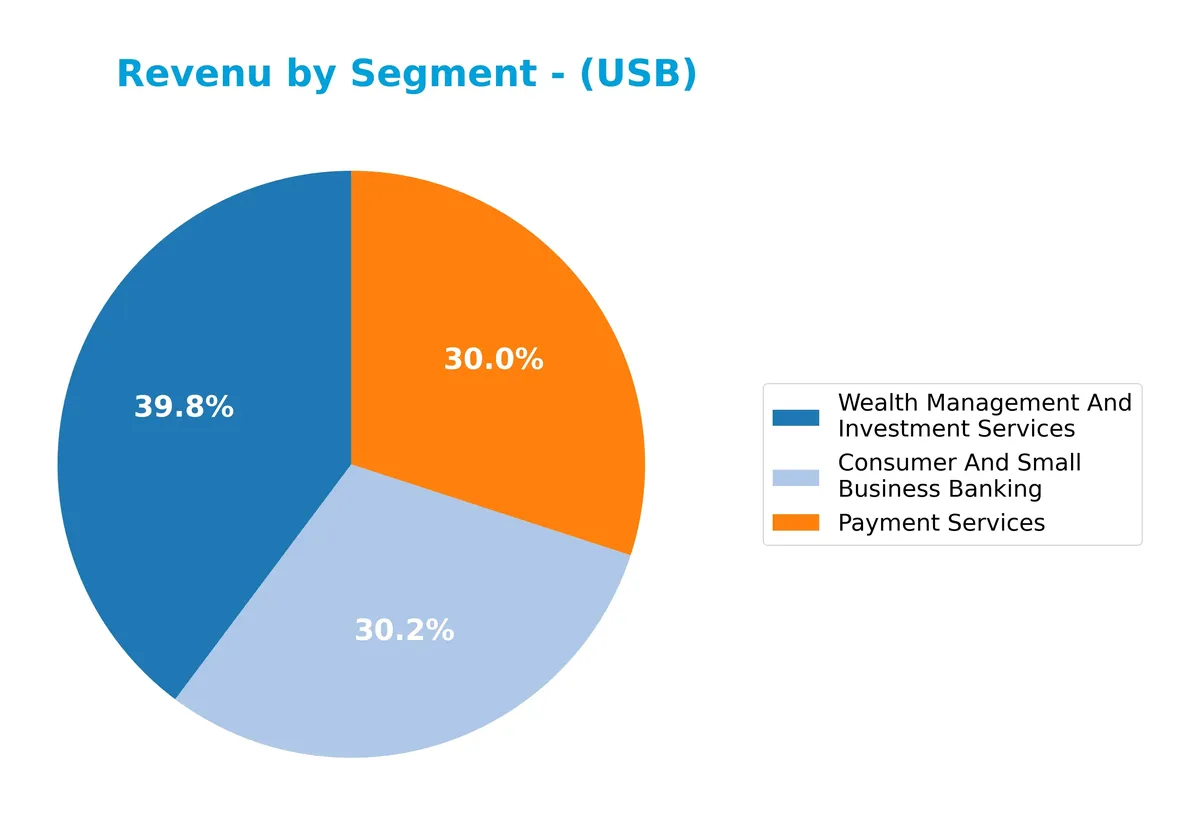
Wealth Management And Investment Services leads with $12.2B in 2024, showing strong growth from prior years. Consumer And Small Business Banking and Payment Services both generate roughly $9.2B, reflecting stable core banking activity. Treasury and Corporate Support posted a negative $1B, signaling potential operational or restructuring costs. The trend emphasizes a shift towards wealth management as a growth engine, while core banking remains steady but faces margin pressure.
Key Products & Brands
The table below details U.S. Bancorp’s main products and services by segment:
| Product | Description |
|---|---|
| Consumer and Small Business Banking | Depository services, traditional credit products, credit cards, lease financing, and agricultural finance. |
| Wealth Management and Investment Services | Asset management, fiduciary services, investment and insurance products, fund administration, brokerage, and leasing. |
| Payment Services | Merchant processing, ATM processing, corporate and purchasing cards, and payment solutions for businesses. |
| Treasury and Corporate Support | Capital markets, treasury management, receivable lock-box collection, corporate trust, and corporate services. |
U.S. Bancorp offers a broad financial services portfolio, spanning retail banking to wealth management and corporate payment solutions. This diversified product mix supports steady revenue streams across economic cycles.
Main Competitors
There are 9 competitors in total, with the table below showing the top 9 leaders by market capitalization:
| Competitor | Market Cap. |
|---|---|
| U.S. Bancorp | 83.8B |
| The PNC Financial Services Group, Inc. | 82.9B |
| Truist Financial Corporation | 64.6B |
| Fifth Third Bancorp | 31.5B |
| M&T Bank Corporation | 31.4B |
| Huntington Bancshares Incorporated | 25.5B |
| Citizens Financial Group, Inc. | 25.5B |
| Regions Financial Corporation | 24.9B |
| KeyCorp | 22.9B |
U.S. Bancorp ranks first among its 9 regional bank competitors by market cap. Its scale exceeds the average top 10 market cap by a notable margin and stands above the sector median. The gap with the next closest rival, The PNC Financial Services Group, Inc., is minimal, reflecting tight competition at the top.
Comparisons with competitors
Check out how we compare the company to its competitors:
Does USB have a competitive advantage?
U.S. Bancorp currently shows a slightly unfavorable competitive advantage, as it is shedding value with ROIC below WACC. However, its growing ROIC trend indicates improving profitability despite value destruction.
Looking ahead, U.S. Bancorp’s broad financial services and extensive Midwest and West presence support future opportunities. Expansion in digital channels and wealth management could drive revenue growth and margin improvement.
SWOT Analysis
This SWOT analysis highlights U.S. Bancorp’s core competitive factors and strategic challenges.
Strengths
- Strong dividend yield at 3.79%
- Favorable gross margin of 62.8%
- Diverse financial services portfolio
Weaknesses
- ROIC below WACC indicating value destruction
- Low Altman Z-score in distress zone
- Interest coverage ratio weak at 0.66
Opportunities
- Growing ROIC trend signals improving profitability
- Expansion in digital banking channels
- Market demand for integrated payment services
Threats
- Rising interest expenses pressure margins
- Regional bank sector competition
- Macroeconomic uncertainty impacting loan growth
U.S. Bancorp shows solid operational strengths but struggles with value creation and financial distress signals. The company must leverage its profitability growth and digital opportunities while addressing leverage and interest coverage risks to stabilize its long-term outlook.
Stock Price Action Analysis
The following weekly chart illustrates U.S. Bancorp’s stock price movements over the past 12 months, highlighting key price levels and volatility:
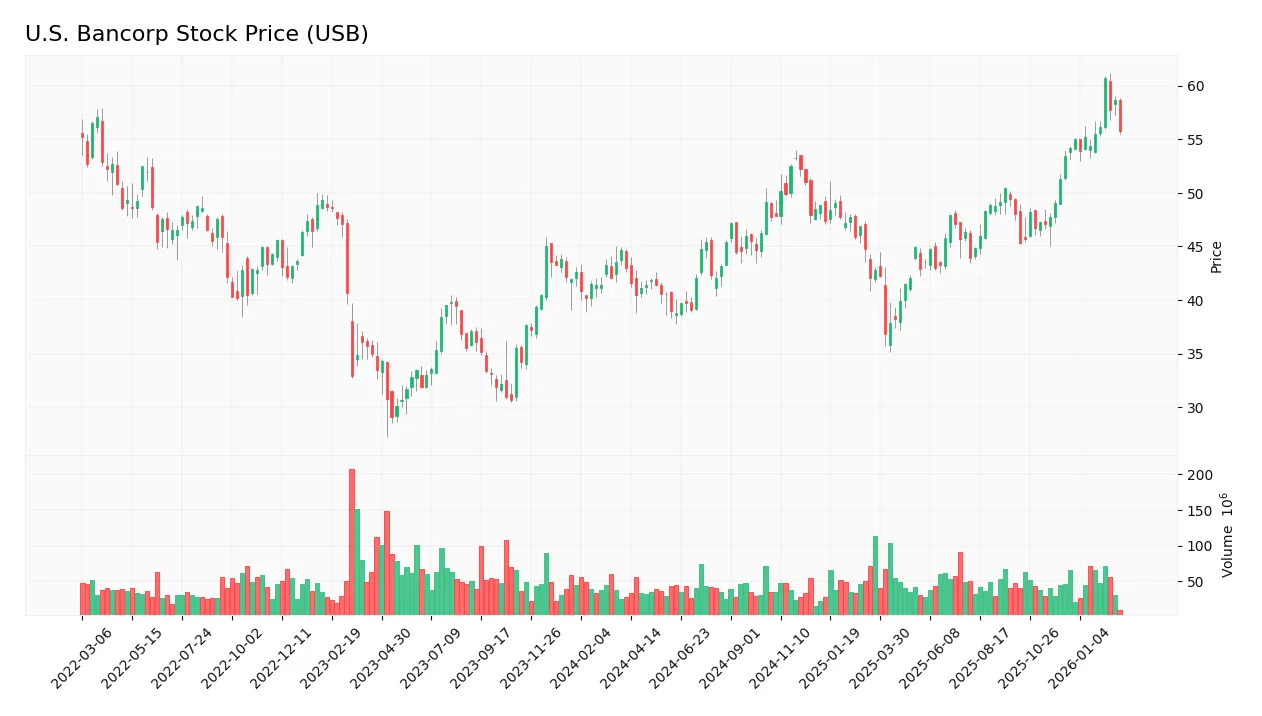
Trend Analysis
Over the past 12 months, USB’s stock price rose 29.7%, indicating a bullish trend with acceleration. Price volatility measured by a 4.92 standard deviation. The stock hit a high of 60.69 and a low of 36.83, confirming strong upward momentum.
Volume Analysis
In the last three months, trading volumes increased with a buyer-driven dominance of 70.47%. This strong buying pressure suggests growing investor confidence and heightened market participation in USB shares.
Target Prices
Analysts set a clear target consensus for U.S. Bancorp, reflecting moderate upside potential.
| Target Low | Target High | Consensus |
|---|---|---|
| 52 | 65 | 59.38 |
The target range suggests cautious optimism, with the consensus indicating a roughly 10-15% potential gain from current levels.

Don’t Let Luck Decide Your Entry Point
Optimize your entry points with our advanced ProRealTime indicators. You’ll get efficient buy signals with precise price targets for maximum performance. Start outperforming now!
Analyst & Consumer Opinions
This section examines U.S. Bancorp’s recent analyst ratings alongside consumer feedback to gauge market sentiment.
Stock Grades
Here are the latest verified analyst grades for U.S. Bancorp, indicating current market sentiment:
| Grading Company | Action | New Grade | Date |
|---|---|---|---|
| JP Morgan | Maintain | Underweight | 2026-02-09 |
| Evercore ISI Group | Maintain | In Line | 2026-02-05 |
| Argus Research | Maintain | Buy | 2026-01-22 |
| Keefe, Bruyette & Woods | Maintain | Market Perform | 2026-01-21 |
| DA Davidson | Maintain | Buy | 2026-01-21 |
| Oppenheimer | Maintain | Outperform | 2026-01-21 |
| TD Cowen | Maintain | Buy | 2026-01-21 |
| Truist Securities | Maintain | Hold | 2026-01-21 |
| RBC Capital | Maintain | Outperform | 2026-01-21 |
| Wolfe Research | Downgrade | Peer Perform | 2026-01-07 |
The grades reveal a mixed but stable outlook with a slight tilt towards Buy and Outperform ratings. Recent downgrades are limited, reflecting cautious but steady confidence among analysts.
Consumer Opinions
Consumers express mixed sentiments about U.S. Bancorp, highlighting both reliability and areas for improvement.
| Positive Reviews | Negative Reviews |
|---|---|
| “U.S. Bancorp offers excellent customer service with quick response times.” | “Mobile app experiences frequent glitches and slow updates.” |
| “Branch staff are knowledgeable and friendly, making banking easy.” | “Fees for certain account types feel higher compared to competitors.” |
| “Secure and reliable online banking platform.” | “Limited ATM availability in some rural areas creates inconvenience.” |
Overall, customers appreciate U.S. Bancorp’s strong service and security. However, tech issues and fee structures remain common complaints, suggesting room for modernization and better cost transparency.
Risk Analysis
The table below summarizes key risks for U.S. Bancorp, highlighting their likelihood and potential impact on performance:
| Category | Description | Probability | Impact |
|---|---|---|---|
| Financial Health | Altman Z-Score in distress zone signals high bankruptcy risk | High | Severe |
| Leverage | Elevated debt-to-equity ratio of 1.2 increases financial risk | Medium | Moderate |
| Interest Coverage | Low interest coverage ratio (0.66) risks difficulty servicing debt | Medium | High |
| Profitability | ROIC (11.14%) slightly below WACC (11.41%) implies value destruction | Medium | Moderate |
| Market Volatility | Beta of 1.057 indicates stock price moves in line with market fluctuations | Medium | Moderate |
| Regulatory | Banking sector faces evolving regulations that could raise compliance costs | Medium | Moderate |
U.S. Bancorp’s most urgent risk is its distressed Altman Z-Score, raising solvency concerns despite solid profitability. The low interest coverage ratio signals vulnerability if rates rise further. Elevated leverage adds pressure, warranting close monitoring.
Should You Buy U.S. Bancorp?
U.S. Bancorp appears to be a profile of improving profitability amid a slightly unfavorable moat, shedding value despite rising ROIC. While leverage remains substantial and liquidity metrics mixed, its overall B+ rating suggests a cautiously favorable value creation outlook.
Strength & Efficiency Pillars
U.S. Bancorp posts a solid net margin of 17.68%, reflecting operational profitability. Its ROE stands at a moderate 11.62%, signaling average shareholder returns. However, the ROIC at 11.14% slightly trails the WACC of 11.41%, indicating the company is currently not a value creator. Despite this, the firm maintains favorable gross (62.83%) and EBIT margins (22.2%), underlining efficient core operations even as overall capital returns lag.
Weaknesses and Drawbacks
The company is in financial distress, with an Altman Z-Score of 0.41, exposing it to high bankruptcy risk. This solvency concern overshadows profitability metrics. Additionally, leverage is elevated, with a debt-to-equity ratio of 1.2 flagged as unfavorable, and interest coverage weak at 0.66. While valuation metrics like P/E (10.95) and P/B (1.27) appear reasonable, the financial health risks and asset turnover inefficiency (0.06) raise caution.
Our Final Verdict about U.S. Bancorp
Despite operational strengths, U.S. Bancorp’s solvency risk due to its Altman Z-Score in the distress zone makes its profile highly speculative. Investors should exercise caution, as the potential bankruptcy risk outweighs favorable margins and improving market trends. This profile may appear too risky for conservative capital, warranting a careful risk-reward assessment before exposure.
Disclaimer: This content is for informational purposes only and does not constitute financial, investment, or other professional advice. Investing in financial markets involves a significant risk of loss, and past performance is not indicative of future results.
Additional Resources
- A Look At U.S. Bancorp (USB) Valuation After Recent Share Price Pullback – simplywall.st (Feb 24, 2026)
- Analysts See Limited Upside for U.S. Bancorp (USB) Amid Neutral Outlook – Yahoo Finance UK (Feb 24, 2026)
- Decoding U.S. Bancorp (USB): A Strategic SWOT Insight – GuruFocus (Feb 24, 2026)
- U.S. Bancorp $USB Shares Bought by Citigroup Inc. – MarketBeat (Feb 23, 2026)
- U.S. Bancorp (USB) Up 5.9% Since Last Earnings Report: Can It Continue? – Nasdaq (Feb 19, 2026)
For more information about U.S. Bancorp, please visit the official website: usbank.com