Home > Analyses > Consumer Defensive > Tyson Foods, Inc.
Tyson Foods, Inc. is a powerhouse that feeds millions daily, transforming raw agricultural products into trusted food staples across the globe. With a diversified portfolio spanning beef, pork, chicken, and prepared foods, Tyson leads the agricultural farm products industry through innovation and consistent quality. Renowned for its iconic brands and expansive distribution, the company shapes consumer diets and foodservice operations alike. As we explore Tyson’s fundamentals, the key question remains: does its current valuation reflect future growth and resilience in a competitive market?
Table of contents
Business Model & Company Overview
Tyson Foods, Inc., founded in 1935 and headquartered in Springdale, Arkansas, stands as a dominant player in the agricultural farm products industry. The company operates a comprehensive ecosystem spanning Beef, Pork, Chicken, and Prepared Foods segments, processing live animals into a broad portfolio of fresh, frozen, and value-added meat products. Its reach extends through well-known brands like Jimmy Dean and Hillshire Farm, creating a cohesive mission to supply diverse protein solutions worldwide.
The company’s revenue engine balances processing operations with branded packaged foods, selling through grocery retailers, distributors, and foodservice channels across the Americas, Europe, and Asia. Tyson leverages its integrated supply chain and brand portfolio to generate steady cash flow from both commodity-based sales and consumer-focused prepared foods. This strategic footprint and operational scale constitute a formidable economic moat, positioning Tyson Foods as a key shaper of the global protein market’s future.
Financial Performance & Fundamental Metrics
This section analyzes Tyson Foods, Inc.’s income statement, key financial ratios, and dividend payout policy to assess its overall financial health and investment potential.
Income Statement
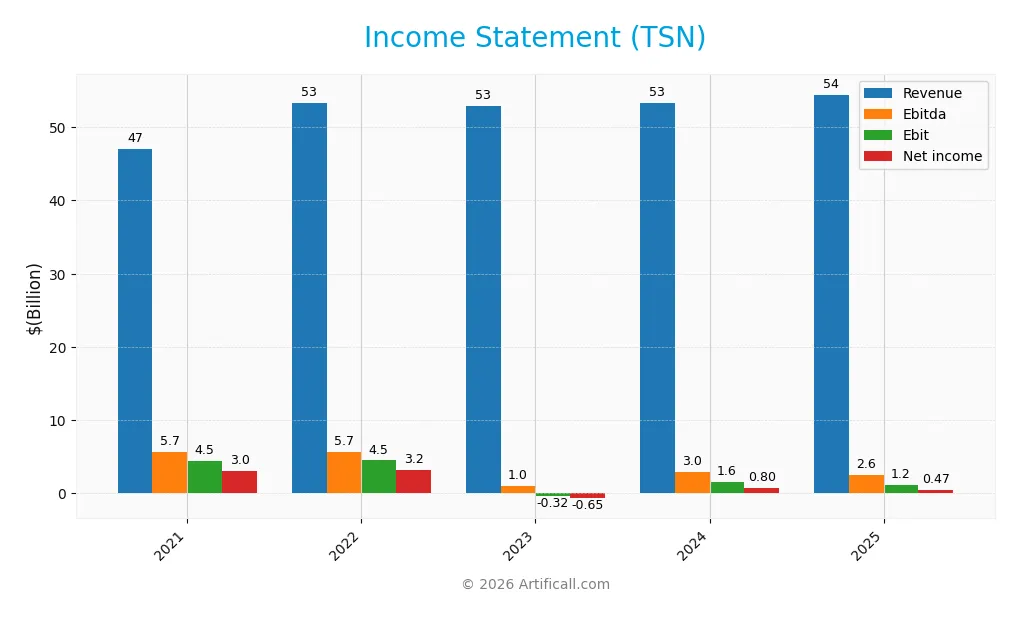
The table below summarizes Tyson Foods, Inc.’s key income statement figures over the last five fiscal years, reported in USD.
| 2021 | 2022 | 2023 | 2024 | 2025 | |
|---|---|---|---|---|---|
| Revenue | 47.0B | 53.3B | 52.9B | 53.3B | 54.4B |
| Cost of Revenue | 40.5B | 46.6B | 50.3B | 49.7B | 50.9B |
| Operating Expenses | 2.13B | 2.26B | 3.03B | 2.22B | 2.12B |
| Gross Profit | 6.53B | 6.67B | 2.63B | 3.63B | 3.56B |
| EBITDA | 5.68B | 5.72B | 1.02B | 2.97B | 2.58B |
| EBIT | 4.47B | 4.51B | -0.32B | 1.57B | 1.22B |
| Interest Expense | 428M | 365M | 355M | 481M | 449M |
| Net Income | 3.05B | 3.24B | -0.65B | 0.80B | 0.47B |
| EPS | 8.57 | 9.18 | -1.87 | 2.31 | 1.37 |
| Filing Date | 2021-11-15 | 2022-11-14 | 2023-11-13 | 2024-11-12 | 2025-11-10 |
Income Statement Evolution
From 2021 to 2025, Tyson Foods, Inc. experienced moderate revenue growth of 15.7%, but net income declined sharply by 84.4%, reflecting pressure on profitability. Gross margin remained neutral at 6.54%, while EBIT margin also stayed stable around 2.24%. However, net margin contracted significantly, signaling deteriorating bottom-line performance despite relatively stable operating expenses relative to revenue.
Is the Income Statement Favorable?
In 2025, revenue grew slightly by 2.1%, but gross profit and EBIT fell by 1.8% and 22.6% respectively, indicating margin compression. The net margin stood at a low 0.87%, down 42% year-over-year, while EPS dropped by 40.9%. Interest expense as a percentage of revenue improved favorably to 0.82%. Overall, the fundamentals for 2025 are generally unfavorable, with more than half of key metrics showing negative trends.
Financial Ratios
Below is a summary table of key financial ratios for Tyson Foods, Inc. over the last five fiscal years, providing insights into profitability, valuation, liquidity, leverage, and efficiency:
| Ratios | 2021 | 2022 | 2023 | 2024 | 2025 |
|---|---|---|---|---|---|
| Net Margin | 6.48% | 6.08% | -1.23% | 1.50% | 0.87% |
| ROE | 17.19% | 16.43% | -3.57% | 4.35% | 2.62% |
| ROIC | 10.72% | 10.80% | -1.19% | 3.27% | 3.05% |
| P/E | 9.40 | 7.33 | -27.58 | 26.36 | 39.79 |
| P/B | 1.62 | 1.20 | 0.99 | 1.15 | 1.04 |
| Current Ratio | 1.55 | 1.81 | 1.34 | 2.04 | 1.55 |
| Quick Ratio | 0.86 | 0.77 | 0.52 | 0.95 | 0.66 |
| D/E | 0.53 | 0.42 | 0.52 | 0.53 | 0.49 |
| Debt-to-Assets | 26% | 23% | 26% | 26% | 24% |
| Interest Coverage | 10.27 | 12.08 | -1.11 | 2.93 | 3.21 |
| Asset Turnover | 1.30 | 1.45 | 1.46 | 1.44 | 1.49 |
| Fixed Asset Turnover | 6.00 | 6.13 | 5.49 | 5.65 | 5.91 |
| Dividend Yield | 2.22% | 2.75% | 3.75% | 3.24% | 3.70% |
Evolution of Financial Ratios
From 2021 to 2025, Tyson Foods, Inc. experienced a marked decline in Return on Equity (ROE), dropping from 17.19% in 2021 to 2.62% in 2025, indicating weakening profitability. The Current Ratio showed fluctuation, peaking at 2.04 in 2024 before declining to 1.55 in 2025, reflecting changing liquidity. The Debt-to-Equity Ratio remained relatively stable around 0.49–0.53, suggesting consistent leverage levels.
Are the Financial Ratios Favorable?
In 2025, profitability ratios such as net margin (0.87%) and ROE (2.62%) were unfavorable, signaling reduced earnings efficiency. Liquidity was mixed: the Current Ratio at 1.55 was favorable, but the Quick Ratio at 0.66 was unfavorable. Efficiency ratios, including asset turnover (1.49) and fixed asset turnover (5.91), were favorable. Leverage ratios, notably debt-to-equity (0.49) and debt-to-assets (24.09%), were favorable, while interest coverage was neutral at 2.71. Market valuation showed a high P/E ratio (39.79, unfavorable) but a favorable price-to-book ratio (1.04). Overall, 57% of ratios were favorable, supporting a predominantly positive financial profile.
Shareholder Return Policy
Tyson Foods, Inc. maintains a dividend payout ratio above 85%, with dividend per share rising from $1.75 in 2021 to $2.00 in 2025 and an annual yield near 3.7%. The dividend is supported by free cash flow coverage, though the payout ratio’s recent increase warrants monitoring for sustainability.
The company also appears to engage in share buybacks, complementing dividends as a shareholder return method. This combination suggests a balanced approach to returning capital, potentially supporting sustainable long-term value creation, provided cash flow generation remains stable and debt levels manageable.
Score analysis
The following radar chart presents an overview of Tyson Foods, Inc.’s key financial scores, highlighting strengths and weaknesses:
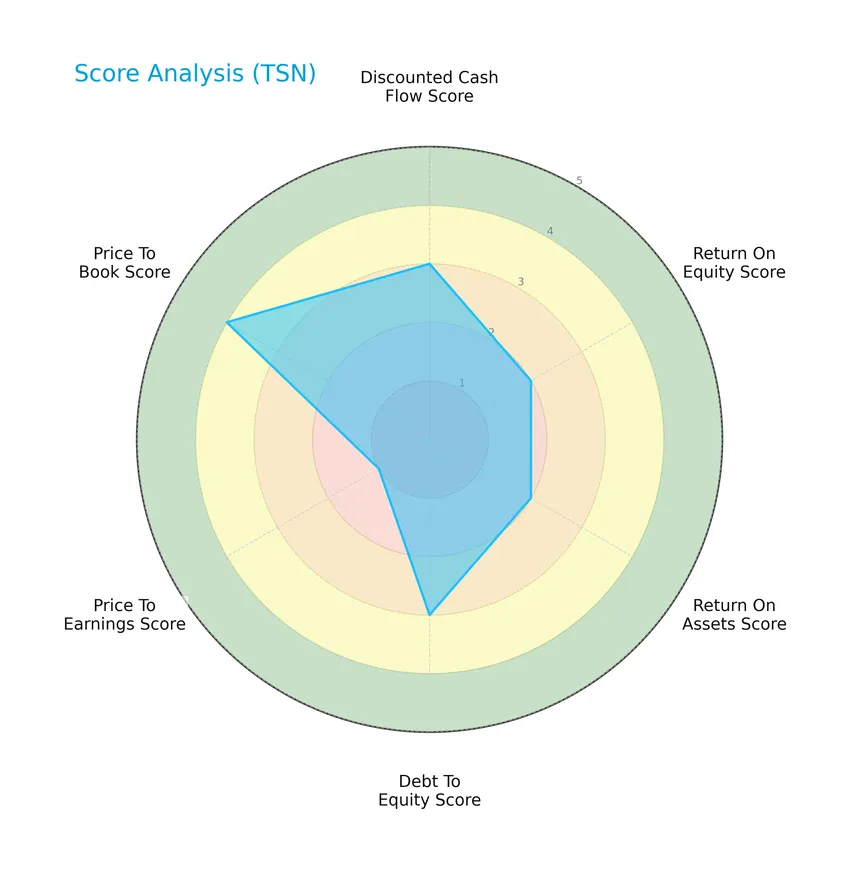
Tyson Foods shows moderate scores in discounted cash flow, return on equity, return on assets, and debt to equity, with a very unfavorable price-to-earnings score but a favorable price-to-book score, reflecting mixed valuation and profitability metrics.
Analysis of the company’s bankruptcy risk
Tyson Foods’ Altman Z-Score places it in the safe zone, indicating a low risk of bankruptcy and financial stability:

Is the company in good financial health?
The Piotroski Score diagram offers insights into Tyson Foods’ financial health based on nine key criteria:

With a Piotroski Score of 6, Tyson Foods demonstrates average financial health, suggesting moderate strength in profitability, leverage, liquidity, and operational efficiency.
Competitive Landscape & Sector Positioning
This section provides an overview of Tyson Foods, Inc.’s strategic positioning, revenue breakdown, key products, main competitors, and competitive advantages within the agricultural farm products sector. I will assess whether Tyson Foods holds a sustainable competitive advantage over its industry peers.
Strategic Positioning
Tyson Foods, Inc. maintains a diversified product portfolio across beef, chicken, pork, and prepared foods segments, with 2025 revenues of $21.6B, $16.8B, $5.8B, and $9.9B respectively. The company operates globally, highlighted by $5.1B in export sales in 2023, reflecting broad geographic exposure.
Revenue by Segment
This pie chart illustrates Tyson Foods, Inc.’s revenue distribution by product segment for the fiscal year 2025, highlighting the key contributors to the company’s total sales.
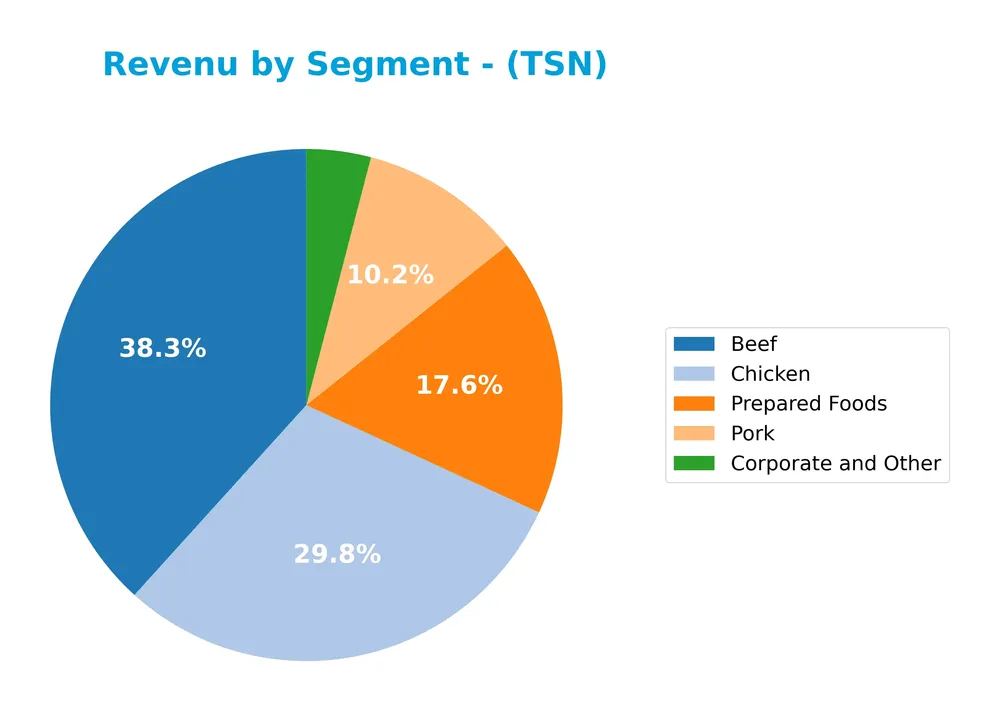
In 2025, Tyson’s revenue was predominantly driven by the Beef segment at $21.6B, followed by Prepared Foods at $9.9B and Chicken at $16.8B. Pork contributed $5.8B, while Corporate and Other accounted for $2.3B. The Beef segment showed steady growth over recent years, maintaining its lead, while Prepared Foods and Chicken segments also expanded moderately. The data suggests a balanced portfolio with some concentration risk in Beef, though diversification through Prepared Foods and Chicken helps mitigate it.
Key Products & Brands
The table below presents Tyson Foods, Inc.’s main product segments and their descriptions:
| Product | Description |
|---|---|
| Beef | Processing of live fed cattle, fabrication of dressed beef carcasses into primal and sub-primal cuts, case-ready beef, and fully cooked meats. |
| Chicken | Raising and processing chickens into fresh, frozen, and value-added chicken products; supplying poultry breeding stock. |
| Pork | Processing live market hogs, fabrication of dressed pork carcasses into primal and sub-primal cuts, case-ready pork, and fully cooked meats. |
| Prepared Foods | Manufacturing and marketing of frozen and refrigerated products including sandwiches, flame-grilled hamburgers, sausage, lunchmeat, ethnic foods, and snacks. |
| Corporate and Other | Includes other business activities not classified in the main product segments. |
Tyson Foods operates through diversified segments focusing on beef, chicken, pork, and prepared foods, providing a broad range of fresh, frozen, and value-added products globally.
Main Competitors
There are 4 competitors in the Agricultural Farm Products industry, with the table below listing the top 10 leaders by market capitalization:
| Competitor | Market Cap. |
|---|---|
| Archer-Daniels-Midland Company | 28.38B |
| Tyson Foods, Inc. | 20.72B |
| Bunge Global S.A. | 17.91B |
| SMITHFIELD FOODS INC | 8.78B |
Tyson Foods, Inc. ranks 2nd among its competitors with a market cap at 77.57% of the leader, Archer-Daniels-Midland Company. The company stands above both the average market cap of the top 10 competitors (18.95B) and the sector median (19.32B). It maintains a notable 28.91% gap below the top competitor, indicating a solid but distinct market position.
Comparisons with competitors
Check out how we compare the company to its competitors:
Does TSN have a competitive advantage?
Tyson Foods, Inc. currently does not present a competitive advantage, as indicated by a very unfavorable moat status with a declining return on invested capital (ROIC) below its weighted average cost of capital (WACC), signaling value destruction. The company’s profitability margins are neutral to unfavorable, with recent declines in net margin and earnings per share growth, suggesting challenges in maintaining economic profits.
Looking ahead, Tyson Foods operates across diverse segments including beef, pork, chicken, and prepared foods, offering opportunities through its broad product portfolio and established brands. Its global export sales of $5.1B indicate potential for market expansion, although current financial trends suggest cautious monitoring of performance and strategic execution will be necessary.
SWOT Analysis
This SWOT analysis highlights Tyson Foods, Inc.’s key strategic factors to guide investment decisions.
Strengths
- diversified product portfolio
- strong brand recognition
- favorable debt metrics
Weaknesses
- declining profitability
- weak net margin and ROE
- high P/E ratio
Opportunities
- growing global demand for protein
- expansion in prepared foods segment
- leveraging strong export sales
Threats
- volatile commodity prices
- regulatory and environmental risks
- increasing competition in food industry
Tyson Foods shows solid financial structure and strong brand equity but faces profitability challenges and pressure from market competition. Strategic focus should be on improving operational efficiency and capturing growth in global and prepared food markets while managing external risks.
Stock Price Action Analysis
The weekly stock chart for Tyson Foods, Inc. (TSN) highlights price movements and trend behavior over the past 12 weeks:
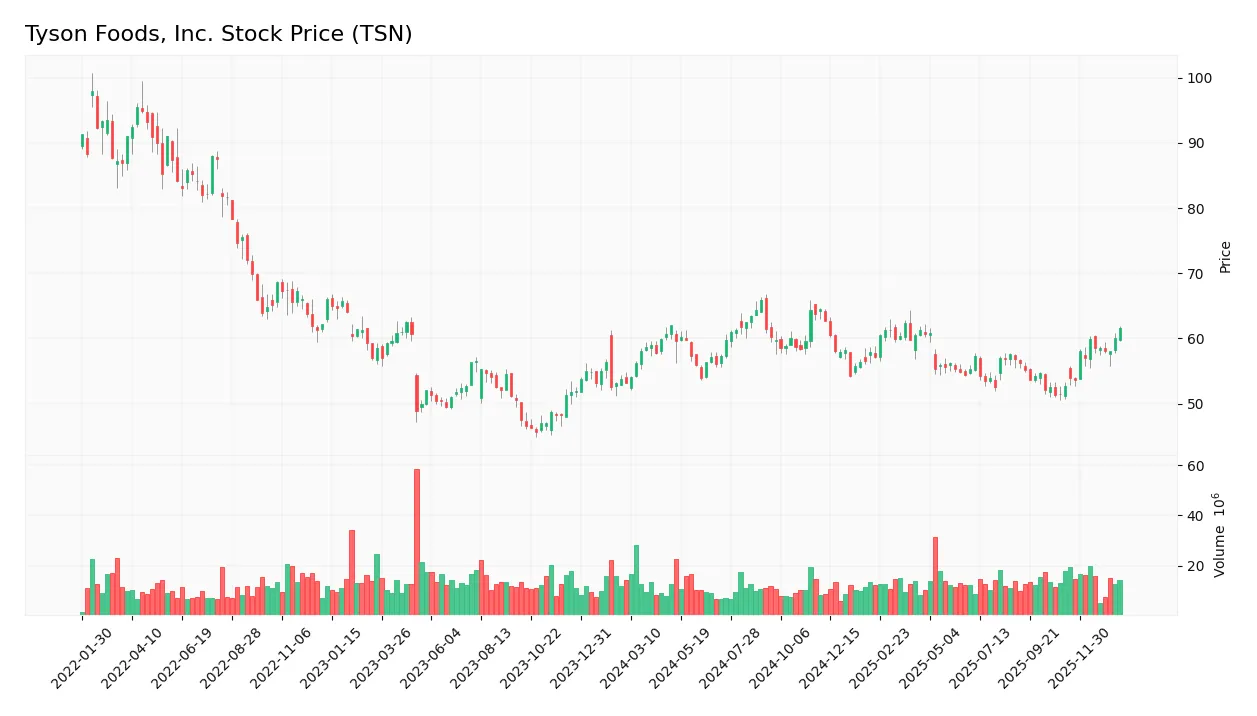
Trend Analysis
Over the past 12 weeks, TSN’s stock price increased by 15.9%, indicating a bullish trend with price acceleration. The weekly volatility measured by a 3.2 standard deviation supports notable price fluctuations. The range spans from a low of 51.38 to a high of 65.87, confirming strength in upward momentum.
Volume Analysis
Trading volume is increasing, with buyer-driven activity dominating at 60.41% over the recent period. Total volume shows strong participation with 1.51B shares traded overall, reflecting growing investor interest and confidence in the stock’s upward price movement.
Target Prices
The consensus target prices for Tyson Foods, Inc. indicate moderate upside potential.
| Target High | Target Low | Consensus |
|---|---|---|
| 67 | 61 | 64 |
Analysts expect Tyson Foods’ stock price to trade within a range of 61 to 67, with a consensus target around 64, reflecting cautious optimism.

Don’t Let Luck Decide Your Entry Point
Optimize your entry points with our advanced ProRealTime indicators. You’ll get efficient buy signals with precise price targets for maximum performance. Start outperforming now!
Analyst & Consumer Opinions
This section examines recent analyst ratings and consumer feedback related to Tyson Foods, Inc. (TSN).
Stock Grades
Here is the latest overview of Tyson Foods, Inc. stock grades from reputable financial institutions:
| Grading Company | Action | New Grade | Date |
|---|---|---|---|
| BMO Capital | Upgrade | Outperform | 2026-01-08 |
| Piper Sandler | Maintain | Neutral | 2025-12-12 |
| BMO Capital | Maintain | Market Perform | 2025-11-11 |
| B of A Securities | Maintain | Neutral | 2025-10-08 |
| Bernstein | Downgrade | Market Perform | 2025-07-23 |
| Stephens & Co. | Maintain | Equal Weight | 2025-05-06 |
| JP Morgan | Maintain | Neutral | 2025-05-06 |
| Citigroup | Maintain | Neutral | 2025-04-15 |
| Piper Sandler | Upgrade | Neutral | 2025-02-04 |
| Stephens & Co. | Maintain | Equal Weight | 2025-02-04 |
The recent grades indicate a generally cautious stance with many firms maintaining neutral or equal weight ratings, while BMO Capital’s latest upgrade to Outperform suggests some emerging optimism. Overall, the consensus remains a Hold with a balanced mix of buy and hold recommendations.
Consumer Opinions
Consumer sentiment around Tyson Foods, Inc. reflects a mix of appreciation for product quality and concerns about pricing and sustainability.
| Positive Reviews | Negative Reviews |
|---|---|
| “Tyson offers consistently fresh and tasty products.” | “Prices have increased noticeably over the past year.” |
| “Wide variety of options, especially great for quick meals.” | “Packaging could be more environmentally friendly.” |
| “Reliable quality, I trust Tyson for my family’s meals.” | “Some products contain more preservatives than I prefer.” |
Overall, consumers appreciate Tyson Foods for its product variety and dependable quality, though pricing and environmental impact remain common concerns.
Risk Analysis
Below is a summary table outlining key risks associated with Tyson Foods, Inc., focusing on their likelihood and potential impact:
| Category | Description | Probability | Impact |
|---|---|---|---|
| Financial Performance | Low net margin (0.87%) and ROE (2.62%) may limit profitability and shareholder returns. | Medium | High |
| Valuation | High price-to-earnings ratio (39.79) signals potential overvaluation risk. | High | Medium |
| Liquidity | Quick ratio at 0.66 suggests weaker short-term liquidity, possibly constraining flexibility. | Medium | Medium |
| Market Volatility | Beta of 0.467 indicates low stock volatility but limits upside in bullish markets. | Low | Low |
| Operational Risks | Exposure to commodity price fluctuations and supply chain disruptions in agricultural sector. | Medium | High |
| Credit Risk | Interest coverage at 2.71 is neutral, indicating moderate ability to cover interest expenses. | Medium | Medium |
Tyson Foods maintains overall financial stability, evidenced by an Altman Z-score above 3, placing it in the safe zone. However, its average Piotroski score of 6 and high P/E ratio highlight valuation and profitability challenges. The most significant risks stem from operational exposure to commodity prices and moderate liquidity constraints. Caution is advised, balancing these factors against the company’s favorable debt levels and dividend yield.
Should You Buy Tyson Foods, Inc.?
Tyson Foods, Inc. appears to be navigating a challenging phase with declining profitability and a deteriorating competitive moat, suggesting value erosion. Despite a manageable leverage profile and a B- rating reflecting moderate financial stability, its overall investment case could be seen as cautious.
Strength & Efficiency Pillars
Tyson Foods, Inc. exhibits moderate financial health with an Altman Z-Score of 3.13, placing it securely in the safe zone against bankruptcy risk, and a Piotroski Score of 6, indicating average financial strength. The company maintains a favorable debt-to-equity ratio of 0.49 and a solid current ratio of 1.55, reflecting sound liquidity and manageable leverage. Despite a modest return on invested capital (ROIC) of 3.05% trailing its weighted average cost of capital (WACC) at 5.42%, the firm sustains favorable operational efficiency with an asset turnover of 1.49 and a fixed asset turnover of 5.91, underpinned by a steady dividend yield of 3.7%.
Weaknesses and Drawbacks
Several key metrics signal caution. The price-to-earnings ratio stands at a high 39.79, suggesting an expensive valuation that may not be fully justified by earnings performance. The net margin is a slim 0.87%, accompanied by a low return on equity (ROE) of 2.62%, pointing to limited profitability. Additionally, the quick ratio at 0.66 raises concerns about immediate liquidity. The company’s recent income trends are unfavorable, with net margin and earnings per share both declining sharply by over 40% year-on-year. These factors, combined with a seller volume reaching 45.29% overall, suggest potential headwinds in market sentiment and valuation risks.
Our Verdict about Tyson Foods, Inc.
Tyson Foods presents a fundamentally mixed profile with moderate financial stability but declining profitability and stretched valuation metrics. The bullish overall stock trend paired with buyer dominance in the recent period suggests positive market momentum. However, the company’s inability to generate value above its WACC and deteriorating income metrics might temper enthusiasm. Despite long-term operational resilience, recent financial weaknesses and valuation pressures suggest a cautious approach, where investors might consider waiting for improved fundamentals or a more attractive entry point.
Disclaimer: This content is for informational purposes only and does not constitute financial, investment, or other professional advice. Investing in financial markets involves a significant risk of loss, and past performance is not indicative of future results.
Additional Resources
- Here is What to Know Beyond Why Tyson Foods, Inc. (TSN) is a Trending Stock – Yahoo Finance (Jan 22, 2026)
- Strs Ohio Acquires 190,143 Shares of Tyson Foods, Inc. $TSN – MarketBeat (Jan 24, 2026)
- Is Tyson Foods (TSN) Pricing Make Sense After Recent Share Gains And DCF Estimate Gap – Sahm (Jan 24, 2026)
- Tyson Foods Reports Fourth Quarter and Fiscal 2025 Results – Tyson Foods (Nov 10, 2025)
- Tyson Foods: Protein Powerhouse Set To Benefit From The New Food‑Pyramid Shift (NYSE:TSN) – Seeking Alpha (Jan 12, 2026)
For more information about Tyson Foods, Inc., please visit the official website: tysonfoods.com