Home > Analyses > Technology > Tyler Technologies, Inc.
Tyler Technologies transforms how local governments and public agencies operate, touching millions of citizens daily. It dominates the public sector software space with solutions spanning financial management, court systems, tax assessments, and K-12 education administration. Known for its innovative, integrated platforms, Tyler sets the standard for efficiency and transparency in government operations. As we dive into its financial health and growth prospects, the key question remains: does Tyler’s strong market position justify its current valuation and future upside?

Table of contents
Business Model & Company Overview
Tyler Technologies, Inc., founded in 1966 and headquartered in Plano, Texas, leads the public sector software industry with a comprehensive ecosystem of integrated information management solutions. Its portfolio spans financial management, judicial systems, public safety, and K-12 education, streamlining government and community operations through connected technologies. This core business enables efficient service delivery and regulatory compliance across diverse municipal functions.
The company’s revenue engine balances software sales, recurring software-as-a-service contracts, and professional services including implementation and support. Tyler’s strategic presence spans the Americas, Europe, and Asia, supported by a cloud hosting partnership with Amazon Web Services. Its competitive advantage lies in deep public sector specialization and broad product integration, creating a robust economic moat that shapes the future of government technology.
Financial Performance & Fundamental Metrics
I analyze Tyler Technologies, Inc.’s income statement, key financial ratios, and dividend payout policy to assess its core financial health and shareholder value.
Income Statement
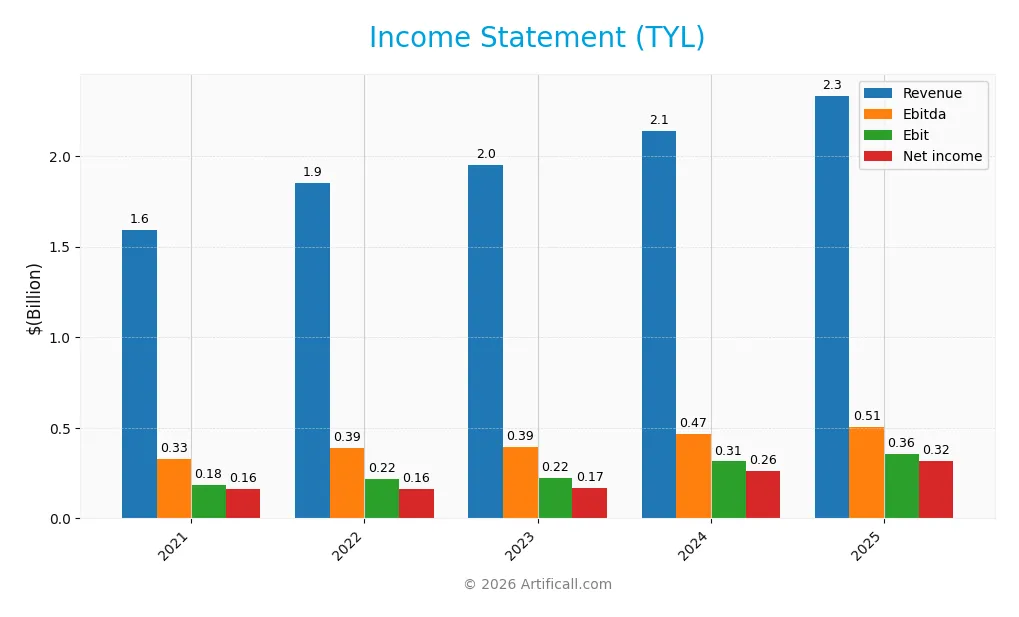
The table below presents Tyler Technologies, Inc.’s key income statement figures for fiscal years 2021 through 2025, reflecting revenue growth and profitability trends.
| 2021 | 2022 | 2023 | 2024 | 2025 | |
|---|---|---|---|---|---|
| Revenue | 1.59B | 1.85B | 1.95B | 2.14B | 2.33B |
| Cost of Revenue | 927M | 1.13B | 1.17B | 1.26B | 1.31B |
| Operating Expenses | 459M | 506M | 568M | 577M | 670M |
| Gross Profit | 665M | 723M | 786M | 876M | 1.03B |
| EBITDA | 328M | 388M | 393M | 466M | 506M |
| EBIT | 182M | 216M | 222M | 314M | 358M |
| Interest Expense | 23M | 28M | 24M | 6M | 5M |
| Net Income | 161M | 164M | 166M | 263M | 316M |
| EPS | 3.95 | 3.95 | 3.95 | 6.17 | 7.32 |
| Filing Date | 2022-02-23 | 2023-02-22 | 2024-02-21 | 2025-02-19 | 2026-02-18 |
Income Statement Evolution
Tyler Technologies grew revenue by 46.5% from 2021 to 2025, with a 9.1% jump in 2025 alone. Net income nearly doubled over the period, rising 95.5%. Margins improved steadily, with the net margin expanding 33.5% overall. Gross margin held favorable at 44%, while EBIT margin reached 15.3%, signaling operational efficiency gains.
Is the Income Statement Favorable?
The 2025 income statement shows solid fundamentals. Revenue hit $2.33B with net income at $316M, reflecting strong margin control. EBITDA margin and net margin remain favorable at 21.7% and 13.5%, respectively. Operating expenses grew in line with revenue, marking a slight unfavorable point, but overall profitability and EPS growth of 19% highlight robust earnings quality.
Financial Ratios
The following table presents key financial ratios for Tyler Technologies, Inc. over the fiscal years 2021 to 2025:
| Ratios | 2021 | 2022 | 2023 | 2024 | 2025 |
|---|---|---|---|---|---|
| Net Margin | 10% | 9% | 9% | 12% | 14% |
| ROE | 7% | 6% | 6% | 8% | 9% |
| ROIC | 5% | 5% | 5% | 6% | 6% |
| P/E | 136 | 82 | 106 | 93 | 62 |
| P/B | 9.5 | 5.1 | 6.0 | 7.3 | 5.3 |
| Current Ratio | 1.16 | 0.95 | 0.86 | 1.35 | 1.05 |
| Quick Ratio | 1.16 | 0.95 | 0.86 | 1.35 | 1.05 |
| D/E | 0.60 | 0.40 | 0.24 | 0.19 | 0.18 |
| Debt-to-Assets | 29% | 22% | 15% | 12% | 12% |
| Interest Coverage | 8.8 | 7.6 | 9.2 | 51 | 72 |
| Asset Turnover | 0.34 | 0.39 | 0.42 | 0.41 | 0.41 |
| Fixed Asset Turnover | 7.2 | 8.3 | 9.3 | 11.0 | 11.9 |
| Dividend Yield | 0% | 0% | 0% | 0% | 0% |
Evolution of Financial Ratios
Tyler Technologies’ Return on Equity (ROE) showed a modest upward trend, peaking at 8.52% in 2025 after fluctuating between 6.26% and 7.76% in prior years. The Current Ratio exhibited variability, climbing from 0.86 in 2023 to 1.35 in 2024 before settling near 1.05 in 2025. Debt-to-Equity steadily declined from 0.60 in 2021 to 0.18 in 2025, indicating improved leverage management. Profitability margins improved consistently, with net margin rising to 13.53% in 2025.
Are the Financial Ratios Favorable?
In 2025, Tyler’s profitability shows strength with a favorable net margin of 13.53%, but ROE at 8.52% remains below the cost of capital, marking it unfavorable. Liquidity is neutral to favorable, with a Current Ratio at 1.05 and a Quick Ratio also favorable. Leverage metrics, including Debt-to-Equity at 0.18 and Debt-to-Assets at 11.99%, are favorable, supported by a robust Interest Coverage of 71.61. However, high Price-to-Earnings and Price-to-Book ratios signal overvaluation risk. Asset turnover ratios remain unfavorable, reflecting operational efficiency challenges. Overall, ratios are slightly favorable with balanced strengths and weaknesses.
Shareholder Return Policy
Tyler Technologies, Inc. does not pay dividends, reflecting its focus on reinvesting free cash flow, which nearly equals operating cash flow, into growth initiatives. The company’s strategy likely prioritizes long-term value creation through capital allocation rather than immediate shareholder payouts.
The absence of dividends is complemented by no reported share buybacks, underlining a conservative capital distribution approach. This policy aligns with sustaining financial flexibility and supports potential expansion, consistent with a firm in a growth phase aiming for durable shareholder value.
Score analysis
The radar chart below illustrates Tyler Technologies, Inc.’s key financial metric scores for a comprehensive view:
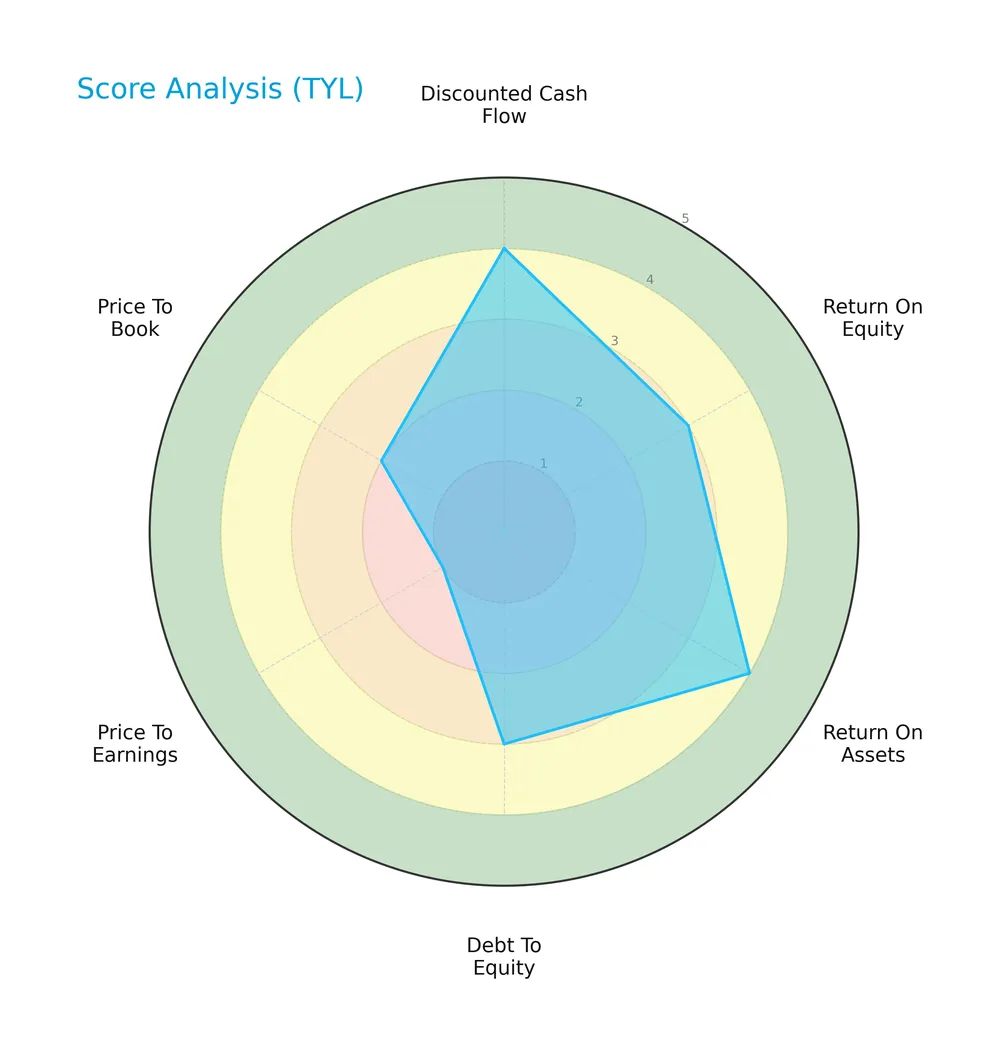
Tyler shows strong discounted cash flow and return on assets scores at 4 each, indicating solid operational efficiency. Return on equity and debt to equity scores are moderate at 3, while valuation metrics lag: price to earnings scores very unfavorably at 1, and price to book at 2.
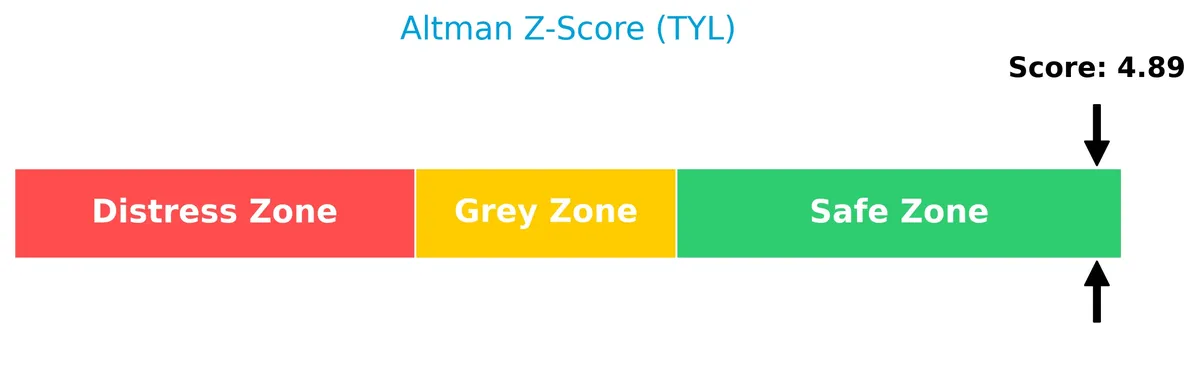
Analysis of the company’s bankruptcy risk
Tyler Technologies is positioned well within the safe zone according to its Altman Z-Score, indicating low bankruptcy risk:
Is the company in good financial health?
The Piotroski Score diagram provides insights into Tyler’s financial strength and resilience:
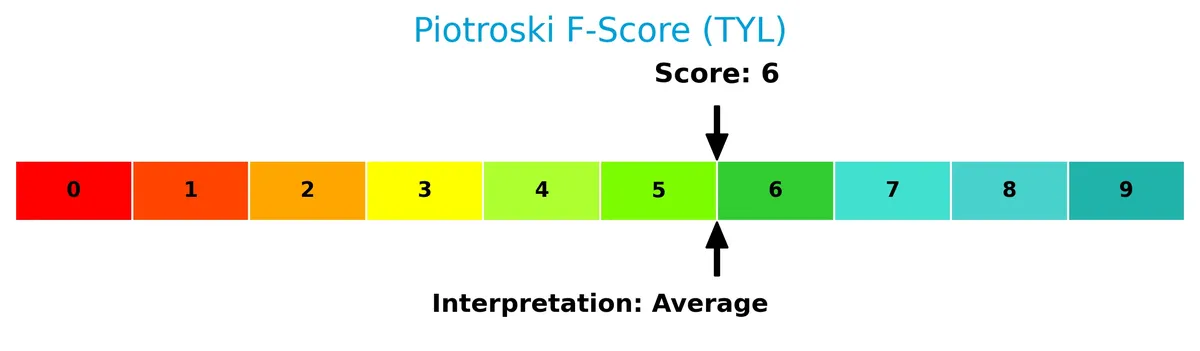
With a Piotroski Score of 6, Tyler demonstrates average financial health, suggesting balanced profitability and efficiency but room for improvement in leverage and liquidity management.
Competitive Landscape & Sector Positioning
This section analyzes Tyler Technologies’ strategic positioning, revenue segments, and key products within the software application sector. I will assess whether Tyler holds a competitive advantage over its main competitors.
Strategic Positioning
Tyler Technologies concentrates on integrated public sector software, focusing on enterprise solutions, appraisal, tax, and judicial systems. Its revenue streams diversify across professional services, maintenance, and SaaS, with a strategic cloud partnership. The company maintains a US-centric geographic focus with specialized industry verticals.
Revenue by Segment
This pie chart illustrates Tyler Technologies, Inc.’s revenue breakdown by segment for fiscal year 2025, highlighting how each division contributed to total sales.
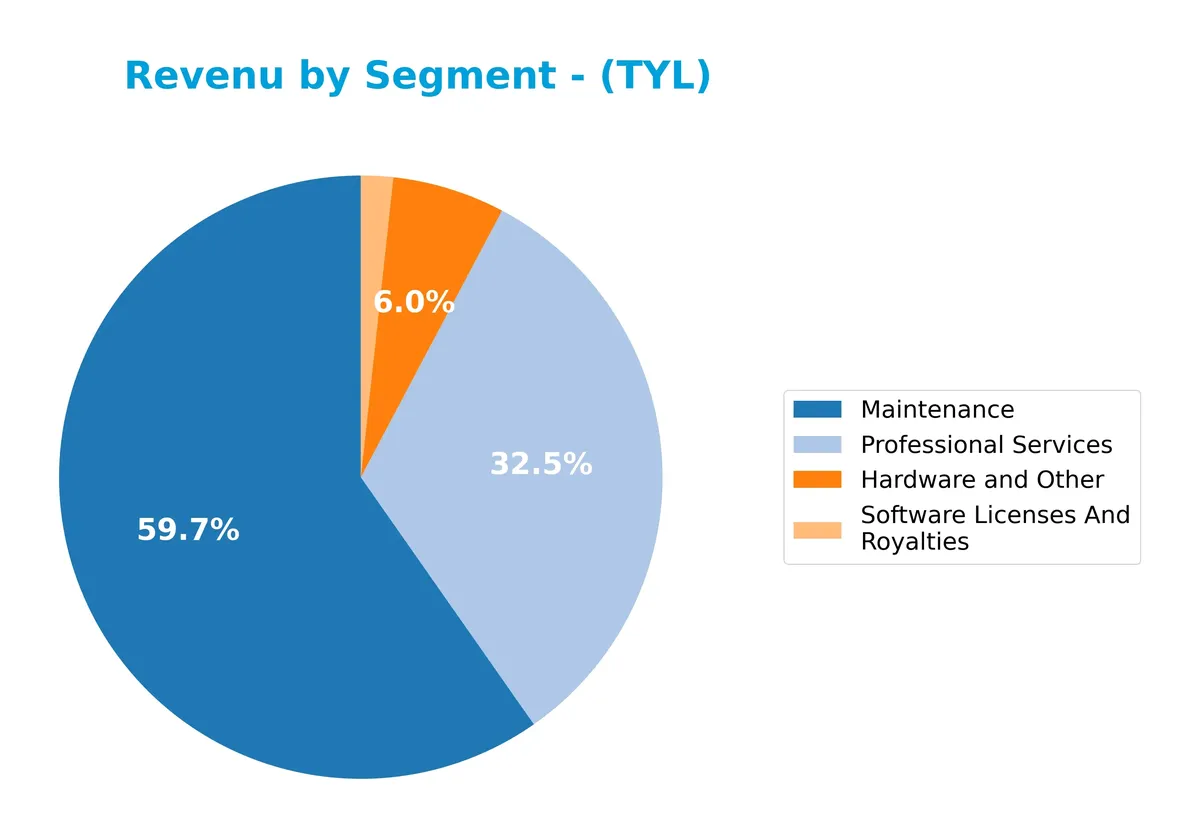
In 2025, Maintenance leads revenue at 446M, followed by Professional Services at 243M. Hardware and Other, and Software Licenses And Royalties are smaller contributors at 45M and 13M respectively. The shift away from Transaction Based Fees and SaaS Arrangements post-2024 suggests a strategic refocus. Maintenance’s steady dominance signals a reliable recurring revenue stream, while Professional Services’ decline warns of potential pressure on growth diversification.
Key Products & Brands
The table below outlines Tyler Technologies’ core products and brands with their descriptions:
| Product | Description |
|---|---|
| Enterprise Software | Integrated management solutions for public sector functions including financial, court, public safety, and school systems. |
| Appraisal and Tax | Software and services for property appraisal, assessment, and tax collection for government agencies. |
| Professional Services | Consulting, training, implementation, and support services related to Tyler’s software offerings. |
| Maintenance | Ongoing software updates, support, and system maintenance contracts. |
| Hardware and Other | Equipment and related products supporting software solutions. |
| Software Licenses And Royalties | Licensing fees and royalties from software usage. |
| SaaS Arrangements | Cloud-based software services and subscription models. |
| Transaction Based Fees | Fees generated from processing transactions through Tyler’s platforms. |
Tyler Technologies focuses on software solutions tailored to public sector needs, complemented by professional services and maintenance. Its offerings span enterprise software, appraisal and tax systems, and growing cloud-based services.
Main Competitors
Tyler Technologies, Inc. faces competition from 33 companies, with the table listing the top 10 leaders by market capitalization:
| Competitor | Market Cap. |
|---|---|
| Salesforce, Inc. | 242.5B |
| Shopify Inc. | 209.6B |
| AppLovin Corporation | 209.0B |
| Intuit Inc. | 175.2B |
| Uber Technologies, Inc. | 172.2B |
| ServiceNow, Inc. | 153.0B |
| Cadence Design Systems, Inc. | 84.5B |
| Snowflake Inc. | 73.4B |
| Autodesk, Inc. | 61.2B |
| Workday, Inc. | 54.9B |
Tyler Technologies ranks 17th among 33 competitors, holding about 5.6% of the market cap of the leader, Salesforce. The company is below both the average market cap of the top 10 (143.6B) and the sector median (18.8B). It sits 38.5% below the next closest competitor above, indicating a notable gap in scale.
Comparisons with competitors
Check out how we compare the company to its competitors:
Does Tyler Technologies have a competitive advantage?
Tyler Technologies currently shows a slightly unfavorable moat, as its ROIC is below WACC, indicating value destruction despite growing profitability. This suggests challenges in generating returns above its cost of capital.
Looking ahead, Tyler’s integrated public sector software and strategic cloud collaboration with Amazon Web Services position it to expand product offerings and penetrate new markets, potentially enhancing its competitive standing.
SWOT Analysis
This SWOT analysis highlights Tyler Technologies’ key internal and external factors shaping its competitive position.
Strengths
- strong revenue growth (46% over 5 years)
- robust net margin (13.5%)
- strategic AWS cloud collaboration
Weaknesses
- ROIC below WACC, indicating value destruction
- high P/E (62) and P/B (5.3) ratios
- moderate current ratio (1.05) signals liquidity caution
Opportunities
- expanding public sector digitalization
- growing demand for integrated government software
- potential to improve profitability through operational efficiencies
Threats
- intense competition in software industry
- pricing pressure from public sector budgets
- technology disruption risks, including cloud dependency
Tyler’s strengths in growth and margin underpin its solid market position. However, value destruction and stretched valuation warrant caution. The company must leverage digital government trends and improve capital efficiency while mitigating competitive and technological risks.
Stock Price Action Analysis
The weekly stock chart below illustrates Tyler Technologies, Inc.’s price movements and key levels over the past twelve months:
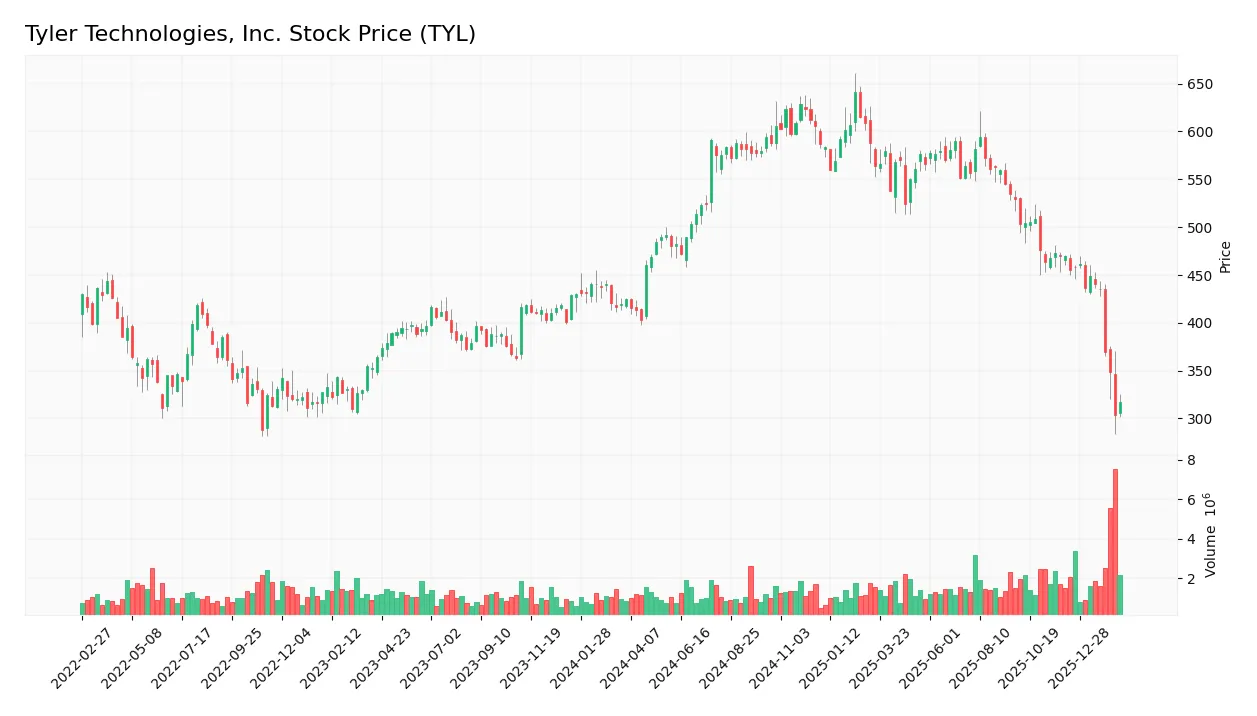
Trend Analysis
Over the past year, Tyler Technologies’ stock price declined by 25.36%, signaling a clear bearish trend. The high volatility is reflected in a 70.45 standard deviation, with a peak at 641.7 and a trough at 303.94. The downward momentum shows deceleration, indicating a slowing pace of decline.
Volume Analysis
Trading volume is increasing overall, with sellers slightly dominating at 52.57%. In the recent three months, seller volume surged, pushing buyer dominance down to 25.09%. This seller-driven pressure suggests weakening investor confidence and heightened market participation on the sell side.
Target Prices
Analysts set a well-defined target consensus for Tyler Technologies, Inc. (TYL).
| Target Low | Target High | Consensus |
|---|---|---|
| 325 | 675 | 474 |
The target range spans from 325 to 675, centering around 474, indicating moderate optimism tempered by some uncertainty among analysts.

Don’t Let Luck Decide Your Entry Point
Optimize your entry points with our advanced ProRealTime indicators. You’ll get efficient buy signals with precise price targets for maximum performance. Start outperforming now!
Analyst & Consumer Opinions
This section examines Tyler Technologies, Inc. (TYL) through expert grades and consumer feedback to gauge market sentiment.
Stock Grades
Here are the recent stock grades for Tyler Technologies, Inc. from leading financial analysts:
| Grading Company | Action | New Grade | Date |
|---|---|---|---|
| DA Davidson | Upgrade | Buy | 2026-02-11 |
| DA Davidson | Maintain | Buy | 2026-02-17 |
| Piper Sandler | Maintain | Overweight | 2026-02-13 |
| TD Cowen | Maintain | Buy | 2026-02-13 |
| Wells Fargo | Maintain | Equal Weight | 2026-02-13 |
| Stifel | Maintain | Buy | 2026-02-13 |
| Barclays | Maintain | Overweight | 2026-02-13 |
| Evercore ISI Group | Maintain | In Line | 2026-02-13 |
| Needham | Maintain | Buy | 2026-02-13 |
| Oppenheimer | Maintain | Outperform | 2026-02-13 |
The consensus shows a strong bias toward Buy and Overweight ratings, with no downgrades. Analysts maintain confidence, reflected in stable or upgraded grades.
Consumer Opinions
Consumers express a mix of enthusiasm and caution regarding Tyler Technologies, Inc. Their feedback reveals key insights into user experience and product reliability.
| Positive Reviews | Negative Reviews |
|---|---|
| “Intuitive software interface streamlines tasks efficiently.” | “Customer support response times need improvement.” |
| “Reliable updates keep the systems secure and current.” | “Implementation can be complex for smaller municipalities.” |
| “Strong integration capabilities with existing infrastructure.” | “Pricing seems high compared to competitors.” |
Overall, users praise Tyler Technologies for its robust, user-friendly solutions and dependable updates. However, challenges with support responsiveness and implementation complexity recur as notable concerns.
Risk Analysis
Below is a summary table outlining key risks for Tyler Technologies, Inc., including their likelihood and potential impact:
| Category | Description | Probability | Impact |
|---|---|---|---|
| Valuation Risk | Elevated P/E of 62 suggests the stock may be overvalued relative to peers. | High | High |
| Profitability | Moderate ROE (8.5%) below cost of capital warns of underwhelming returns. | Medium | Medium |
| Liquidity | Current ratio at 1.05 signals tight short-term liquidity with limited cushion. | Medium | Medium |
| Market Volatility | Beta below 1 (0.9) indicates less sensitivity but still exposed to tech swings. | Medium | Medium |
| Dividend Policy | No dividend yield reduces income appeal and may impact investor sentiment. | High | Low |
| Operational Risk | Asset turnover at 0.41 is weak, showing inefficiencies in asset use. | Medium | Medium |
The valuation risk stands out as most pressing given the very high P/E, implying stretched expectations. Tyler’s safe Altman Z-score (4.9) reduces bankruptcy concern. Yet, modest returns on equity and tight liquidity warrant caution. The absence of dividends limits downside protection amid market shifts.
Should You Buy Tyler Technologies, Inc.?
Tyler Technologies appears to be improving profitability amid a slightly unfavorable moat, indicating some value erosion despite rising returns. Its leverage profile seems manageable, supported by a strong Altman Z-Score. The overall B rating suggests a moderately favorable financial health profile.
Strength & Efficiency Pillars
Tyler Technologies, Inc. maintains solid operational profitability with a net margin of 13.53% and an EBIT margin of 15.34%. The company’s interest expense remains minimal at 0.21%, supporting efficient capital use. Although the ROIC of 6.44% slightly trails the WACC of 7.68%, signaling value destruction, the ROIC trend shows a positive 23.32% growth. Overall, the firm demonstrates improving profitability but currently sheds value on its invested capital.
Weaknesses and Drawbacks
Tyler Technologies faces valuation headwinds, with a high P/E ratio of 61.99 and a P/B ratio of 5.28, indicating a premium market price that may pressure future returns. The stock is also experiencing seller dominance at 25.09% in the recent period, contributing to a bearish price trend with a 32.41% decline. While leverage metrics like debt-to-equity at 0.18 and interest coverage of 71.61 remain favorable, the asset turnover ratio is weak at 0.41, reflecting potential inefficiencies in asset utilization.
Our Final Verdict about Tyler Technologies, Inc.
Tyler Technologies, Inc. has a fundamentally sound profile with strong profitability gains and a safe Altman Z-Score of 4.89, indicating low bankruptcy risk. However, the steep valuation multiples and recent seller dominance suggest caution. Despite long-term operational improvements, the current market pressure points to a wait-and-see approach for a better entry point. The profile might appear attractive for investors with a tolerance for short-term volatility.
Disclaimer: This content is for informational purposes only and does not constitute financial, investment, or other professional advice. Investing in financial markets involves a significant risk of loss, and past performance is not indicative of future results.
Additional Resources
- Decoding Tyler Technologies Inc (TYL): A Strategic SWOT Insight – GuruFocus (Feb 19, 2026)
- Tyler Technologies: Bookings Decline And An Unattractive Price (NYSE:TYL) – Seeking Alpha (Feb 17, 2026)
- Tyler Technologies Named to 2026 GovTech 100 List – Yahoo Finance (Feb 17, 2026)
- Why Tyler Technologies Stock Is Sinking Today – The Motley Fool (Feb 12, 2026)
- Tyler Technologies (TYL) Receives a Buy from D.A. Davidson – The Globe and Mail (Feb 18, 2026)
For more information about Tyler Technologies, Inc., please visit the official website: tylertech.com