Home > Analyses > Communication Services > Twilio Inc.
Twilio transforms how businesses connect with customers, embedding communication seamlessly into software worldwide. Its cloud platform powers voice, messaging, video, and email features for thousands of developers. Renowned for innovation and scalability, Twilio shapes the future of digital engagement. As competition intensifies, I ask: do its fundamentals still support its premium valuation and growth ambitions in the evolving communication landscape?
Table of contents
Business Model & Company Overview
Twilio Inc., founded in 2008 and headquartered in San Francisco, dominates the Internet Content & Information sector with a cloud communications platform that empowers developers globally. The company’s ecosystem integrates voice, messaging, video, and email APIs, enabling seamless customer engagement within software applications. Twilio’s platform forms the backbone of digital communication for businesses worldwide, reflecting its critical role in modern customer interaction.
Twilio’s revenue engine balances scalable software APIs with a robust global presence across the Americas, Europe, and Asia. It generates value by enabling developers to embed communication tools directly into applications, fostering recurring usage and growth. This blend of innovation and scale creates a durable competitive advantage that positions Twilio as a defining force in shaping the future of digital communication.
Financial Performance & Fundamental Metrics
I analyze Twilio Inc.’s income statement, key financial ratios, and dividend payout policy to assess its profitability, efficiency, and shareholder returns.
Income Statement
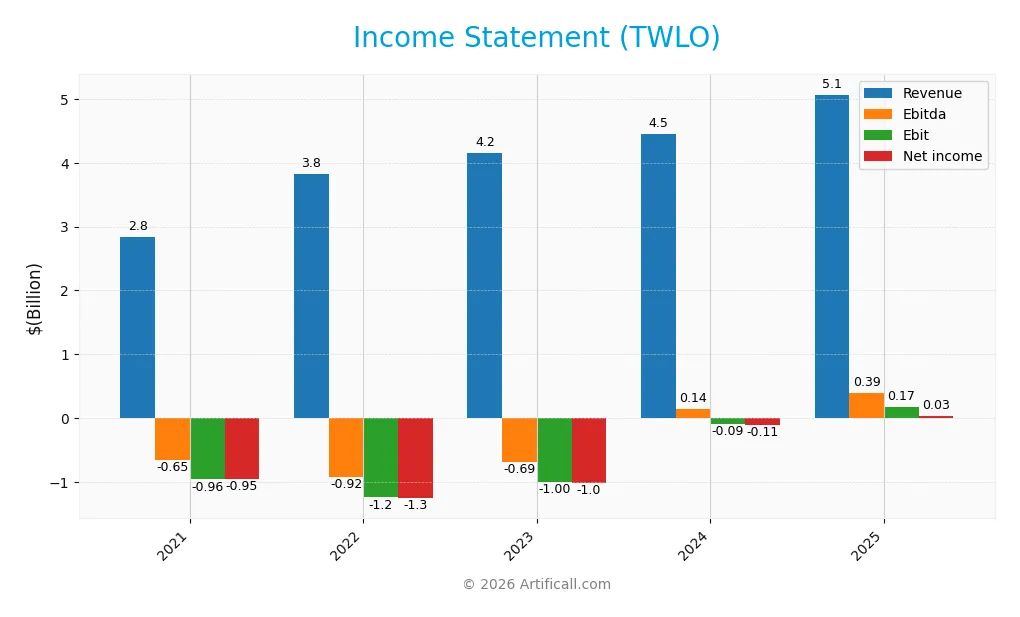
The table below presents Twilio Inc.’s income statement for fiscal years 2021 through 2025, showing key profitability and expense metrics in USD.
| 2021 | 2022 | 2023 | 2024 | 2025 | |
|---|---|---|---|---|---|
| Revenue | 2.84B | 3.83B | 4.15B | 4.46B | 5.07B |
| Cost of Revenue | 1.53B | 2.06B | 2.19B | 2.23B | 2.63B |
| Operating Expenses | 2.21B | 2.76B | 2.35B | 2.27B | 2.26B |
| Gross Profit | 1.31B | 1.76B | 1.96B | 2.23B | 2.43B |
| EBITDA | -654M | -917M | -685M | 136M | 392M |
| EBIT | -961M | -1.24B | -997M | -89M | 175M |
| Interest Expense | 0 | 0 | 0 | 0 | 0 |
| Net Income | -950M | -1.26B | -1.02B | -109M | 34M |
| EPS | -5.45 | -6.86 | -5.54 | -0.66 | 0.22 |
| Filing Date | 2022-02-22 | 2023-02-27 | 2024-02-27 | 2025-02-26 | 2026-02-24 |
Income Statement Evolution
Twilio’s revenue rose steadily from 2.84B in 2021 to 5.07B in 2025, marking a 78% growth over five years. Net income turned positive in 2025 after years of losses, reflecting improved profitability. Gross margins held favorably around 48%, while operating and net margins showed gradual improvement but remained modest.
Is the Income Statement Favorable?
In 2025, Twilio reported a net income of 34M on 5.07B revenue, yielding a net margin of 0.67%, classified as neutral. EBIT margin stood at 3.45%, reflecting operational breakeven. The absence of interest expenses supports financial stability. Overall, fundamentals improved markedly, with strong revenue and margin growth signaling a favorable income statement trajectory.
Financial Ratios
The following table presents key financial ratios for Twilio Inc. over the last five fiscal years, illustrating profitability, liquidity, leverage, and valuation metrics:
| Ratios | 2021 | 2022 | 2023 | 2024 | 2025 |
|---|---|---|---|---|---|
| Net Margin | -33% | -33% | -24% | -2% | 1% |
| ROE | -9% | -12% | -10% | -14% | 0.4% |
| ROIC | -7% | -8% | -4% | -0.4% | 1.2% |
| P/E | -48.3x | -7.1x | -13.7x | -163.9x | 643.2x |
| P/B | 4.16x | 0.85x | 1.43x | 2.25x | 2.78x |
| Current Ratio | 8.43 | 6.17 | 6.64 | 4.20 | 4.03 |
| Quick Ratio | 8.43 | 6.17 | 6.64 | 4.20 | 4.03 |
| D/E | 0.12 | 0.12 | 0.12 | 0.14 | 0.15 |
| Debt-to-Assets | 10% | 10% | 10% | 11% | 12% |
| Interest Coverage | 0 | 0 | 0 | 0 | 0 |
| Asset Turnover | 0.22x | 0.30x | 0.36x | 0.45x | 0.52x |
| Fixed Asset Turnover | 5.8x | 9.9x | 14.6x | 18.2x | 23.5x |
| Dividend Yield | 0% | 0% | 0% | 0% | 0% |
Evolution of Financial Ratios
Twilio’s Return on Equity (ROE) remained negative until 2024, improving slightly to 0.43% in 2025, signaling weak profitability. The Current Ratio declined from 8.43 in 2021 to 4.03 in 2025, indicating reduced but still strong liquidity. Debt-to-Equity Ratio rose modestly, maintaining a low level near 0.15, reflecting cautious leverage stability.
Are the Financial Ratios Fovorable?
In 2025, profitability ratios such as net margin and ROE are unfavorable, reflecting minimal earnings relative to equity and sales. Liquidity shows mixed signals: a favorable quick ratio contrasts with an unfavorable current ratio. Leverage metrics, including debt-to-equity and debt-to-assets, are favorable, indicating low financial risk. Market valuation is neutral to unfavorable, with a high P/E ratio and moderate price-to-book ratio. Overall, the ratios lean slightly unfavorable.
Shareholder Return Policy
Twilio Inc. does not pay dividends, reflecting its focus on reinvestment and growth. The company maintains a strong current ratio above 4.0 and has no dividend payout, signaling prioritization of capital allocation toward expansion and R&D.
The absence of dividends aligns with Twilio’s phase of scaling operations and building long-term shareholder value. While it does not engage in share buybacks, this strategy supports sustainable growth, although investors should monitor profitability improvements for future distribution potential.
Score analysis
Here is a radar chart illustrating Twilio Inc.’s key financial scores for a comprehensive view:

Twilio shows a favorable discounted cash flow score of 4, indicating good valuation. However, profitability metrics like ROE and ROA remain unfavorable at 2. Debt-to-equity is moderate at 3, while valuation multiples, especially PE at 1, appear very unfavorable.
Analysis of the company’s bankruptcy risk
The Altman Z-Score places Twilio safely in the safe zone, signaling low bankruptcy risk and solid financial stability:

Is the company in good financial health?
The Piotroski Score diagram highlights Twilio’s financial strength based on key accounting metrics:

With a strong score of 7, Twilio demonstrates solid profitability, liquidity, and operational efficiency, reflecting good financial health despite some valuation concerns.
Competitive Landscape & Sector Positioning
This sector analysis explores Twilio Inc.’s strategic positioning, revenue streams, key products, and main competitors. I will assess whether Twilio holds a competitive advantage over its industry peers.
Strategic Positioning
Twilio Inc. focuses on a concentrated product portfolio centered on cloud communications, with messaging generating $2.9B of $4B total communications revenue in 2025. Geographically, it balances U.S. dominance at $3.2B and significant international growth with $1.8B, reflecting steady global expansion.
Revenue by Segment
This pie chart depicts Twilio Inc.’s revenue distribution by product segments for the fiscal year ending December 31, 2025.
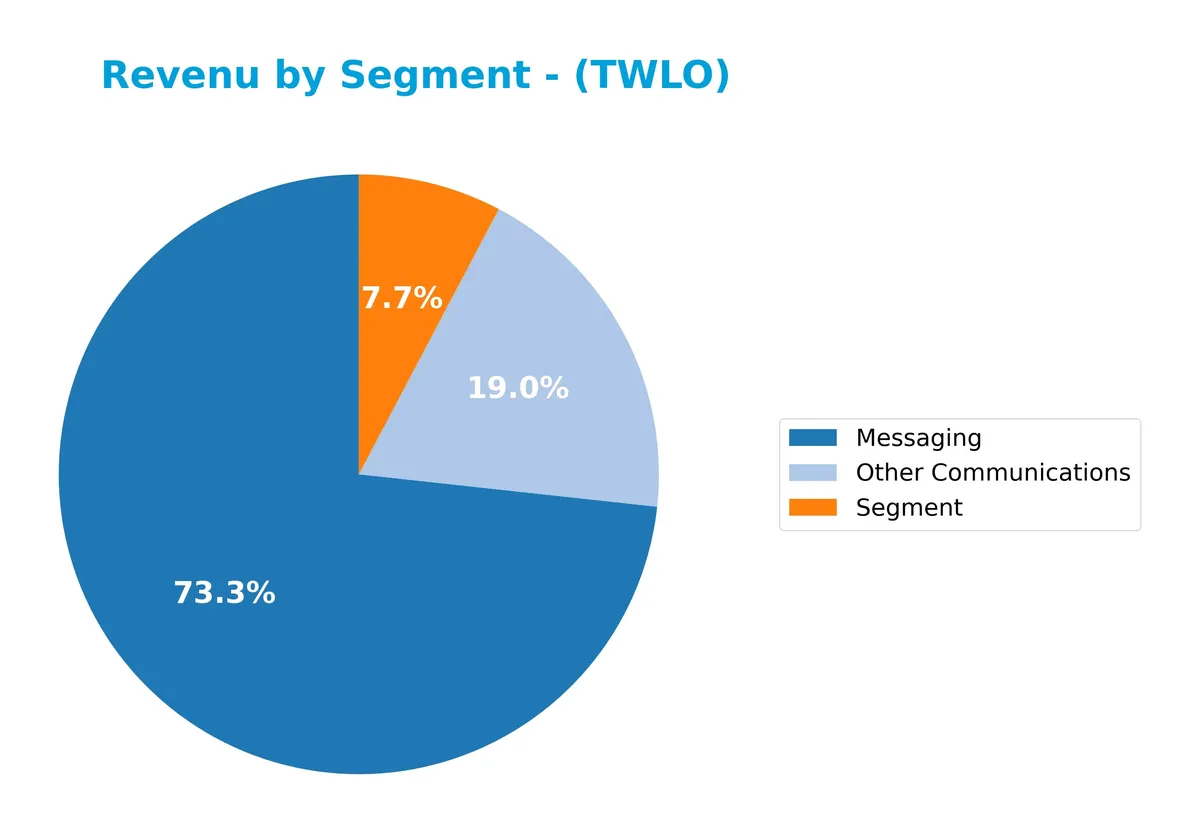
In 2025, Messaging leads Twilio’s revenue at 2.88B, dominating the portfolio. Other Communications contributes a substantial 747M, while the Segment category adds 303M. This segmentation highlights a clear concentration in Messaging. Compared to prior years, the detailed breakdown in 2025 reveals a strategic focus on core communications, with Messaging accelerating as the primary revenue driver.
Key Products & Brands
Twilio’s revenue derives primarily from its communication and messaging offerings detailed below:
| Product | Description |
|---|---|
| Messaging | APIs enabling developers to embed SMS, MMS, and other messaging capabilities into applications. |
| Other Communications | Includes voice, video, and email communication APIs that complement messaging services. |
| Segment | Customer data platform enhancing marketing and customer engagement through analytics. |
Twilio’s core business centers on cloud-based communication APIs. Messaging dominates revenue, supported by voice, video, email, and customer data analytics. This diversified product mix underpins its position in the communication services sector.
Main Competitors
There are 6 main competitors in the Communication Services sector; the table lists the top 6 leaders by market capitalization:
| Competitor | Market Cap. |
|---|---|
| Alphabet Inc. | 3.8T |
| Meta Platforms, Inc. | 1.6T |
| DoorDash, Inc. | 95B |
| Baidu, Inc. | 44B |
| Twilio Inc. | 21.8B |
| Snap Inc. | 13.6B |
Twilio ranks 5th among its main competitors, with a market cap just 0.46% of Alphabet’s. It sits below both the average market cap of the top 10 (936B) and the median sector market cap (69.5B). The company maintains a significant gap of +153.66% from the next competitor above, highlighting a distinct scale difference within the peer group.
Comparisons with competitors
Check out how we compare the company to its competitors:
Does Twilio Inc. have a competitive advantage?
Twilio Inc. currently shows a slightly unfavorable moat as its ROIC is below WACC, indicating value destruction despite growing profitability. Its gross margin of 48% supports some operational strength within the cloud communications sector.
Looking ahead, Twilio’s expanding international revenue and continuous product integration in customer engagement platforms offer growth opportunities. Its focus on embedding voice, messaging, video, and email capabilities positions it to tap new markets and customer segments globally.
SWOT Analysis
This SWOT analysis highlights Twilio Inc.’s core competitive position and strategic challenges.
Strengths
- Strong revenue growth of 13.7% in 2025
- Leading cloud communications platform
- High current and quick ratios indicating liquidity
Weaknesses
- Low net margin at 0.67%
- ROIC below WACC, indicating value destruction
- Extremely high P/E ratio of 643
Opportunities
- Expanding international sales with 1.82B Non-US revenue
- Rising profitability trend with 297% EBIT growth
- Growing demand for integrated customer engagement solutions
Threats
- Intense competition in cloud communications
- Dependence on continuous innovation
- Market volatility impacting high valuation
Twilio’s strengths in growth and platform leadership offer a solid foundation. However, weak profitability and valuation risks require prudent capital allocation and operational discipline to capitalize on global opportunities.
Stock Price Action Analysis
The following weekly chart illustrates Twilio Inc.’s stock price movement over the past 100 weeks, highlighting key highs and lows:

Trend Analysis
Over the past 12 months, TWLO’s price rose 89.5%, signaling a bullish trend. The highest price reached 146.58 and the lowest was 54.24. Despite strong gains, the trend shows deceleration. Volatility remains elevated with a 27.27 standard deviation, indicating significant price swings.
Volume Analysis
In the last three months, trading volume decreased, with sellers dominating 63.57% of activity. Buyer volume fell to 50M against 87M sellers, reflecting bearish sentiment and reduced market participation. This seller-driven volume suggests cautious investor behavior amid recent downward pressure.
Target Prices
Analysts present a moderately optimistic consensus on Twilio Inc.’s price outlook.
| Target Low | Target High | Consensus |
|---|---|---|
| 100 | 170 | 141.75 |
The target range indicates expectations of significant upside potential, reflecting confidence in Twilio’s growth trajectory despite market volatility.

Don’t Let Luck Decide Your Entry Point
Optimize your entry points with our advanced ProRealTime indicators. You’ll get efficient buy signals with precise price targets for maximum performance. Start outperforming now!
Analyst & Consumer Opinions
This section reviews recent analyst grades and consumer feedback to provide a balanced view of Twilio Inc.’s standing.
Stock Grades
Here is a summary of the latest verified analyst grades for Twilio Inc. from recognized firms:
| Grading Company | Action | New Grade | Date |
|---|---|---|---|
| Piper Sandler | Maintain | Neutral | 2026-02-13 |
| BTIG | Maintain | Buy | 2026-02-13 |
| Rosenblatt | Maintain | Buy | 2026-02-13 |
| Morgan Stanley | Maintain | Overweight | 2026-01-15 |
| Rosenblatt | Maintain | Buy | 2026-01-07 |
| RBC Capital | Maintain | Underperform | 2026-01-05 |
| Piper Sandler | Downgrade | Neutral | 2026-01-05 |
| Citizens | Maintain | Market Outperform | 2025-12-30 |
| JP Morgan | Maintain | Overweight | 2025-10-31 |
| TD Cowen | Maintain | Hold | 2025-10-31 |
Grades generally cluster around Buy and Overweight ratings, indicating cautious optimism. The downgrade by Piper Sandler to Neutral signals some recent concerns, but most firms maintain positive stances.
Consumer Opinions
Twilio’s user base voices a mix of enthusiasm and frustration, reflecting the company’s complex tech landscape.
| Positive Reviews | Negative Reviews |
|---|---|
| “Robust API features enable seamless integration.” | “Pricing structure is confusing and often expensive.” |
| “Excellent customer support with quick response times.” | “Steep learning curve for beginners slows deployment.” |
| “Reliable uptime boosts our communication workflows.” | “Occasional bugs disrupt service unexpectedly.” |
Overall, customers praise Twilio’s powerful APIs and reliable service. However, pricing complexity and usability challenges frequently emerge as pain points. These mixed sentiments underscore the need for ongoing product simplification and cost transparency.
Risk Analysis
Below is a summary table outlining key risks facing Twilio Inc. in 2026:
| Category | Description | Probability | Impact |
|---|---|---|---|
| Profitability | Extremely low net margin (0.67%) limits earnings growth | High | High |
| Valuation | Excessive P/E ratio (~643) suggests overvaluation risk | High | High |
| Operational | Modest ROIC (1.2%) below WACC (9.41%) signals value destruction | Medium | Medium |
| Liquidity | Current ratio (4.03) unusually high, risks inefficient capital use | Medium | Low |
| Market Volatility | Beta of 1.31 indicates above-market volatility exposure | High | Medium |
| Dividend Policy | Zero dividend yield may deter income-focused investors | Medium | Low |
Twilio’s most pressing risks stem from its sky-high valuation and weak profitability. Despite a safe Altman Z-score (5.08) and strong Piotroski score (7), the company struggles to generate returns above its cost of capital. This mismatch often leads to share price volatility. Investors must weigh growth optimism against fundamental financial fragility.
Should You Buy Twilio Inc.?
Twilio appears to be improving operationally with a growing ROIC despite currently shedding value, suggesting a slightly unfavorable moat. Its leverage profile seems manageable, supported by a strong Altman Z-score and a solid Piotroski score, resulting in an overall B- rating.
Strength & Efficiency Pillars
Twilio Inc. shows operational resilience with a gross margin of 48.02%, underscoring robust core profitability. Its EBIT margin of 3.45% reflects modest operating efficiency amid growth. Despite a low net margin of 0.67%, revenue growth remains strong at 13.66% year-over-year. However, the company’s ROIC is 1.2%, below its WACC of 9.41%, indicating it currently destroys value despite improving profitability trends. This signals operational progress but limitations in capital allocation effectiveness.
Weaknesses and Drawbacks
Twilio sits comfortably in the safe zone with an Altman Z-Score of 5.08, mitigating immediate solvency concerns. Yet, the valuation is stretched, with an extremely high P/E ratio of 643.16 signaling significant premium pricing and potential overvaluation. The current ratio at 4.03, while high, is flagged unfavorable, possibly indicating inefficient asset use or excess liquidity. Market dynamics reveal recent seller dominance with buyer volume at 36.43%, suggesting short-term selling pressure and caution from market participants.
Our Final Verdict about Twilio Inc.
Twilio presents a mixed fundamental profile. Its strong revenue growth and safe solvency position contrast with unfavorable returns on invested capital and lofty valuation multiples. Despite a bullish long-term trend, recent seller dominance advises a cautious stance. This combination suggests Twilio might appear attractive for growth-oriented investors but warrants a wait-and-see approach for a more favorable risk-reward entry.
Disclaimer: This content is for informational purposes only and does not constitute financial, investment, or other professional advice. Investing in financial markets involves a significant risk of loss, and past performance is not indicative of future results.
Additional Resources
- Decoding Twilio Inc (TWLO): A Strategic SWOT Insight – GuruFocus (Feb 25, 2026)
- Twilio Inc. (TWLO) Is a Trending Stock: Facts to Know Before Betting on It – Yahoo Finance (Feb 20, 2026)
- 12,293 Shares in Twilio Inc. $TWLO Purchased by Krane Funds Advisors LLC – MarketBeat (Feb 24, 2026)
- Twilio slips even as Q4 results, guidance top estimates (TWLO:NYSE) – Seeking Alpha (Feb 12, 2026)
- Twilio (TWLO) gains momentum as AI and voice demand accelerate – MSN (Feb 23, 2026)
For more information about Twilio Inc., please visit the official website: twilio.com