Home > Analyses > Financial Services > Truist Financial Corporation
Truist Financial Corporation powers the financial lives of millions across the Southeastern and Mid-Atlantic U.S., shaping how people save, borrow, and invest. As a top regional bank, Truist offers a broad suite of services—from consumer banking to corporate finance and insurance—backed by a reputation for innovation and reliability. As market dynamics evolve, I ask: does Truist’s strong footprint and diversified model still justify its current valuation and growth prospects?

Table of contents
Business Model & Company Overview
Truist Financial Corporation, founded in 1872 and based in Charlotte, NC, stands as a dominant regional bank in the Southeastern and Mid-Atlantic US. It operates a vast ecosystem of banking and trust services, integrating consumer banking, corporate finance, and insurance under one roof. The company leverages its extensive branch network of 2,517 offices to serve diverse client needs, from retail deposits to complex wealth management.
Truist’s revenue engine balances traditional deposit products with a broad array of lending, insurance, and investment services. Its footprint spans key US markets, emphasizing digital and mobile banking to enhance customer engagement. This diversified model creates a resilient economic moat by blending recurring fee income with interest revenues, positioning Truist to shape the future of regional financial services.
Financial Performance & Fundamental Metrics
I analyze Truist Financial Corporation’s income statement, key financial ratios, and dividend payout policy to reveal its core financial health and shareholder value strategy.
Income Statement
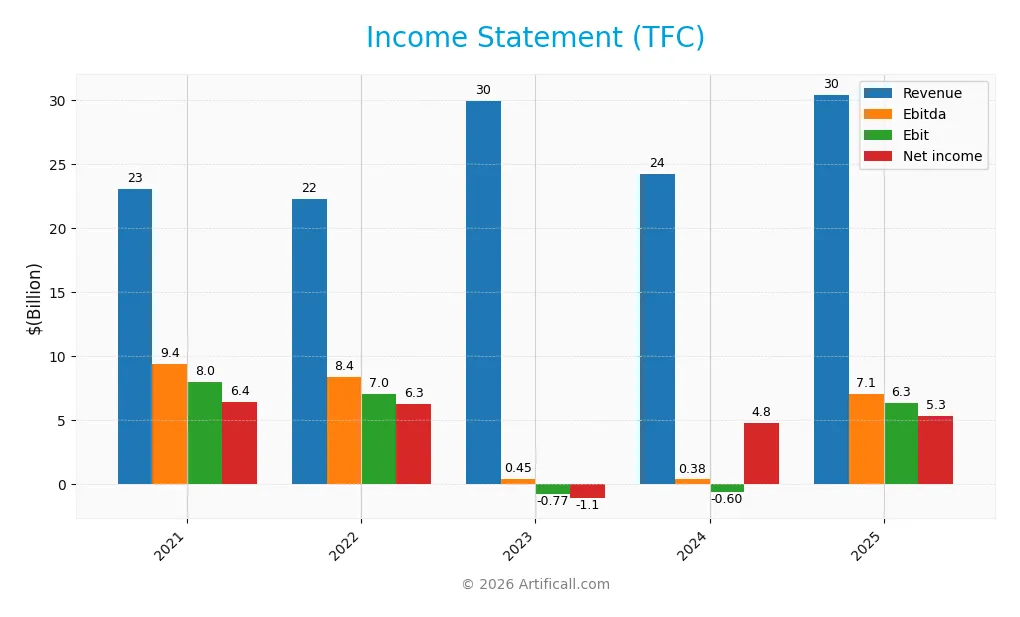
The table below summarizes Truist Financial Corporation’s key income statement figures for fiscal years 2021 through 2025, expressed in USD.
| 2021 | 2022 | 2023 | 2024 | 2025 | |
|---|---|---|---|---|---|
| Revenue | 23.1B | 22.3B | 29.9B | 24.3B | 30.4B |
| Cost of Revenue | -45M | 3.1B | 12.0B | 12.8B | 11.5B |
| Operating Expenses | 15.1B | 12.2B | 18.7B | 12.0B | 12.6B |
| Gross Profit | 23.1B | 19.2B | 17.9B | 11.4B | 18.9B |
| EBITDA | 9.4B | 8.4B | 0.45B | 0.38B | 7.1B |
| EBIT | 8.0B | 7.0B | -0.77B | -0.60B | 6.3B |
| Interest Expense | 768M | 2.3B | 9.9B | 11.0B | 10.1B |
| Net Income | 6.4B | 6.3B | -1.1B | 4.8B | 5.3B |
| EPS | 4.51 | 4.46 | -1.09 | 3.36 | 3.86 |
| Filing Date | 2022-02-23 | 2023-02-28 | 2024-02-27 | 2025-02-25 | 2026-02-24 |
Income Statement Evolution
Truist Financial’s revenue grew 32% from 2021 to 2025, with a strong 25.5% increase in 2025 alone. Gross profit surged 66% in 2025, lifting margins despite fluctuating operating expenses. EBIT turned positive in 2025, reversing prior losses, while net income declined overall, reflecting margin compression over the period.
Is the Income Statement Favorable?
In 2025, Truist reported a favorable 62.2% gross margin and a solid 20.9% EBIT margin, supporting operational efficiency. However, a 33.2% interest expense ratio signals elevated financing costs. Net margin at 17.4% remains strong but contracted 12.2% year-over-year. Overall, fundamentals appear favorable, balancing robust growth against some cost pressures.
Financial Ratios
The table below summarizes key financial ratios for Truist Financial Corporation (TFC) over the last five fiscal years, offering insight into profitability, liquidity, leverage, and valuation metrics:
| Ratios | 2021 | 2022 | 2023 | 2024 | 2025 |
|---|---|---|---|---|---|
| Net Margin | 28% | 28.1% | -3.6% | 19.9% | 17.4% |
| ROE | 9.3% | 10.3% | -1.8% | 7.6% | 8.1% |
| ROIC | 5.2% | 4.1% | -0.5% | -0.03% | 3.6% |
| P/E | 12.2 | 9.1 | -45.1 | 12.0 | 11.8 |
| P/B | 1.13 | 0.94 | 0.83 | 0.91 | 0.96 |
| Current Ratio | 0.44 | 0.24 | 0.26 | 0.14 | 0.87 |
| Quick Ratio | 0.44 | 0.24 | 0.26 | 0.14 | 0.87 |
| D/E | 0.59 | 1.08 | 1.05 | 0.98 | 1.07 |
| Debt-to-Assets | 7.6% | 11.7% | 11.6% | 11.7% | 12.7% |
| Interest Coverage | 10.4x | 3.0x | -0.08x | -0.05x | 0.63x |
| Asset Turnover | 0.04 | 0.04 | 0.06 | 0.05 | 0.06 |
| Fixed Asset Turnover | 3.3 | 3.2 | 5.0 | 4.3 | 9.6 |
| Dividend Yield | 3.6% | 5.2% | 6.4% | 5.4% | 4.2% |
Evolution of Financial Ratios
Return on Equity (ROE) for Truist Financial Corporation (TFC) declined from 10.3% in 2022 to 8.1% in 2025, signaling a slowdown in profitability growth. The Current Ratio improved from 0.14 in 2024 to 0.87 in 2025, yet remains below the benchmark of 1. The Debt-to-Equity Ratio increased slightly to 1.07, indicating rising leverage but relative stability in capital structure.
Are the Financial Ratios Favorable?
In 2025, profitability appears mixed: net margin at 17.44% is favorable, but ROE (8.1%) and ROIC (3.6%) lag the 9% WACC, raising caution on capital efficiency. Liquidity ratios show a weak current ratio (0.87) but a neutral quick ratio, reflecting moderate short-term financial health. Leverage is elevated with a 1.07 debt-to-equity ratio and low interest coverage (0.63), signaling financial risk. Market valuation is reasonable, with a P/E of 11.75 and price-to-book near 0.96. Overall, the ratios present a neutral financial profile.
Shareholder Return Policy
Truist Financial Corporation maintains a consistent dividend policy with a payout ratio near 50%, yielding approximately 4.2% annually in 2025. The dividend per share shows minor fluctuations, supported by free cash flow coverage, and the company also executes share buybacks.
This distribution approach reflects a balanced capital allocation aimed at sustainable shareholder returns. While the payout ratio remains moderate, investors should monitor cash flow stability and leverage levels to assess long-term dividend sustainability.
Score analysis
The following radar chart illustrates Truist Financial Corporation’s key financial scores across valuation, profitability, and leverage metrics:
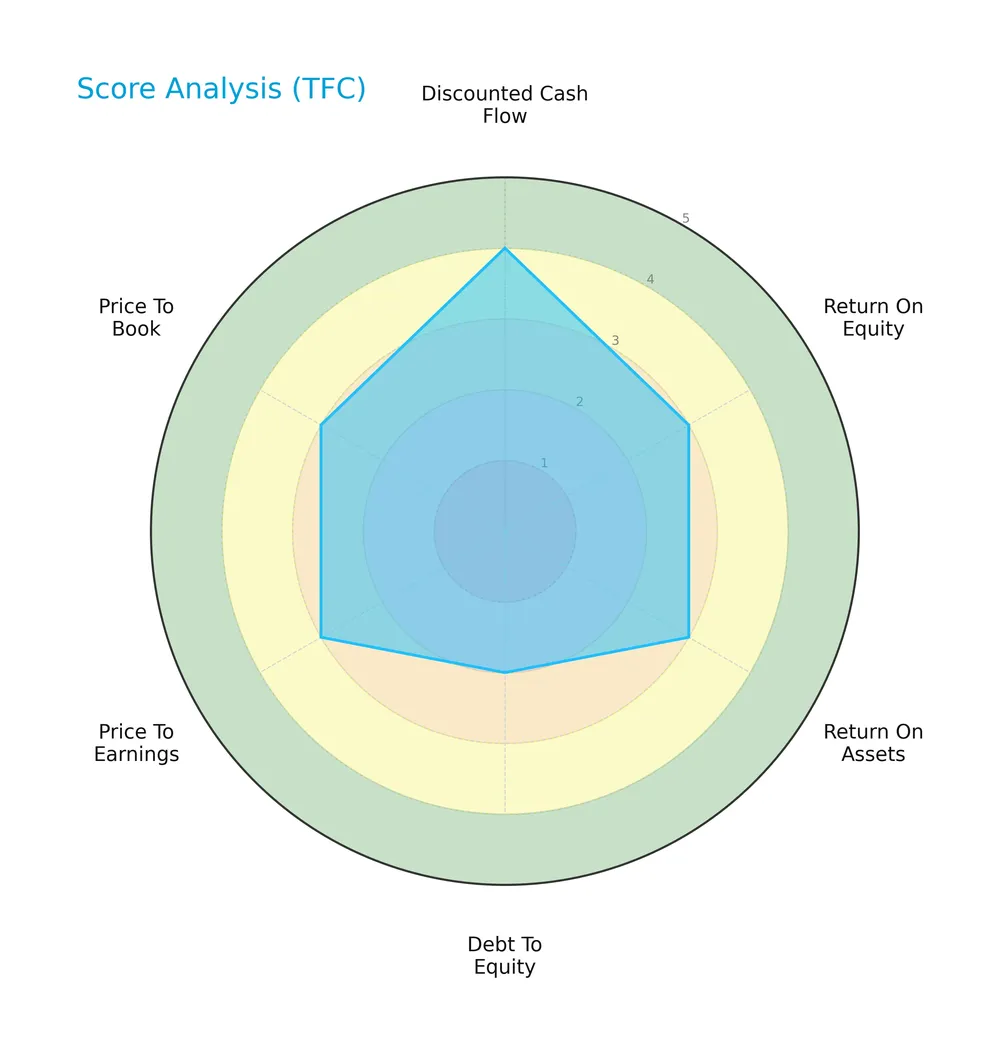
Truist scores favorably on discounted cash flow with a 4, while profitability metrics ROE and ROA sit at moderate 3s. Debt to equity is weak at 2, signaling higher leverage risk. Valuation multiples PE and PB both register moderate scores of 3.
Analysis of the company’s bankruptcy risk
Truist Financial Corporation’s Altman Z-Score places it firmly in the distress zone, indicating a high risk of bankruptcy:

Is the company in good financial health?
The Piotroski Score diagram highlights Truist’s overall financial strength with a score of 7, which is considered strong:

A Piotroski score of 7 suggests solid financial health, reflecting good profitability, leverage, and operational efficiency despite other risks.
Competitive Landscape & Sector Positioning
This section examines Truist Financial Corporation’s strategic positioning, revenue segments, key products, and competitors. I will assess whether Truist holds a competitive advantage within its regional banking industry.
Strategic Positioning
Truist Financial Corporation concentrates in regional banking across the Southeastern and Mid-Atlantic U.S. Its three segments—Consumer Banking, Corporate and Commercial Banking, and Insurance Holdings—reflect a diversified product portfolio within financial services, supported by over 2,500 branches and integrated wealth and insurance offerings.
Revenue by Segment
This pie chart illustrates Truist Financial Corporation’s revenue breakdown by segment for the fiscal year 2016, highlighting the key business drivers across its divisions.
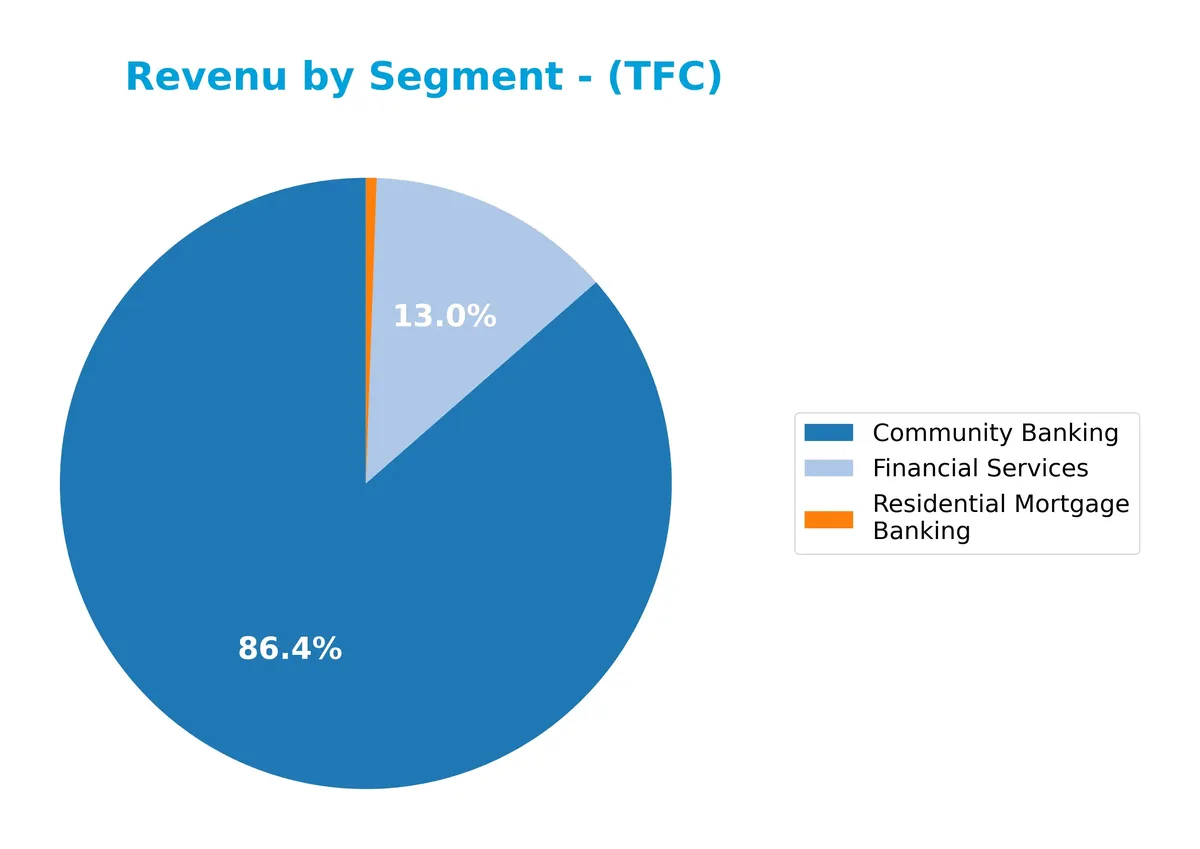
Community Banking dominates with $153M, clearly the core revenue source. Financial Services contributes a smaller $23M, while Residential Mortgage Banking is minimal at $1M. The negative figure in Other, Treasury & Corporate (-$177M) suggests significant internal costs or allocations, which raises concerns about segment profitability. Overall, revenue concentration in Community Banking underscores reliance on this segment, with no notable growth acceleration in the latest year.
Key Products & Brands
The table below details Truist Financial Corporation’s key products and services across its main business segments:
| Product | Description |
|---|---|
| Consumer Banking | Deposit products including checking, savings, money market accounts, certificates of deposit, and IRAs. |
| Wealth Management | Investment brokerage, wealth management, private banking, and investment advisory services. |
| Corporate & Commercial Banking | Corporate and investment banking, commercial lending, treasury services, and capital market operations. |
| Insurance Holdings | Property and casualty, life, health, employee benefits, workers compensation, professional liability, and title insurance. |
| Mortgage Lending | Home equity, residential mortgage banking, commercial mortgage lending, and mortgage warehouse lending. |
| Automobile & Consumer Finance | Automobile lending, bankcard lending, consumer finance, and small business lending. |
| Other Financial Services | Asset management, payment services, lease financing, merchant services, student lending, and specialized lending. |
Truist’s diversified product suite spans retail, commercial, and insurance services. This breadth supports a broad customer base in the Southeastern and Mid-Atlantic US.
Main Competitors
The sector includes 9 competitors, with the table listing the top 9 leaders by market capitalization:
| Competitor | Market Cap. |
|---|---|
| U.S. Bancorp | 83.8B |
| The PNC Financial Services Group, Inc. | 82.9B |
| Truist Financial Corporation | 64.6B |
| Fifth Third Bancorp | 31.5B |
| M&T Bank Corporation | 31.4B |
| Huntington Bancshares Incorporated | 25.5B |
| Citizens Financial Group, Inc. | 25.5B |
| Regions Financial Corporation | 24.9B |
| KeyCorp | 22.9B |
Truist Financial Corporation ranks 3rd among its peers in regional banking. Its market cap stands at 76% of the sector leader, U.S. Bancorp. The company is above both the average market cap of the top 10 competitors (43.7B) and the sector median (31.4B). It maintains a strong 30.5% market cap lead over the next closest rival.
Comparisons with competitors
Check out how we compare the company to its competitors:
Does Truist Financial Corporation have a competitive advantage?
Truist Financial Corporation does not present a competitive advantage. Its ROIC is significantly below WACC, indicating value destruction and a steadily declining return on invested capital.
Looking ahead, Truist’s extensive product range across banking, insurance, and wealth management offers growth potential. Expanding services in regional markets may create new opportunities despite current profitability challenges.
SWOT Analysis
This SWOT analysis highlights Truist Financial Corporation’s key strategic factors to guide investment decisions.
Strengths
- strong revenue growth (25.5% yoy)
- favorable gross margin (62.2%)
- solid dividend yield (4.23%)
Weaknesses
- declining ROIC, destroying value
- low current ratio (0.87) signals liquidity risk
- weak interest coverage (0.63)
Opportunities
- expanding wealth management services
- digital banking adoption growth
- increased small business lending
Threats
- rising interest expenses (33.24% of income)
- intense regional banking competition
- regulatory and economic uncertainty
Truist shows robust revenue growth and attractive dividends, but its declining profitability and liquidity issues are red flags. The company must leverage digital and wealth segments to offset value erosion and external risks.
Stock Price Action Analysis
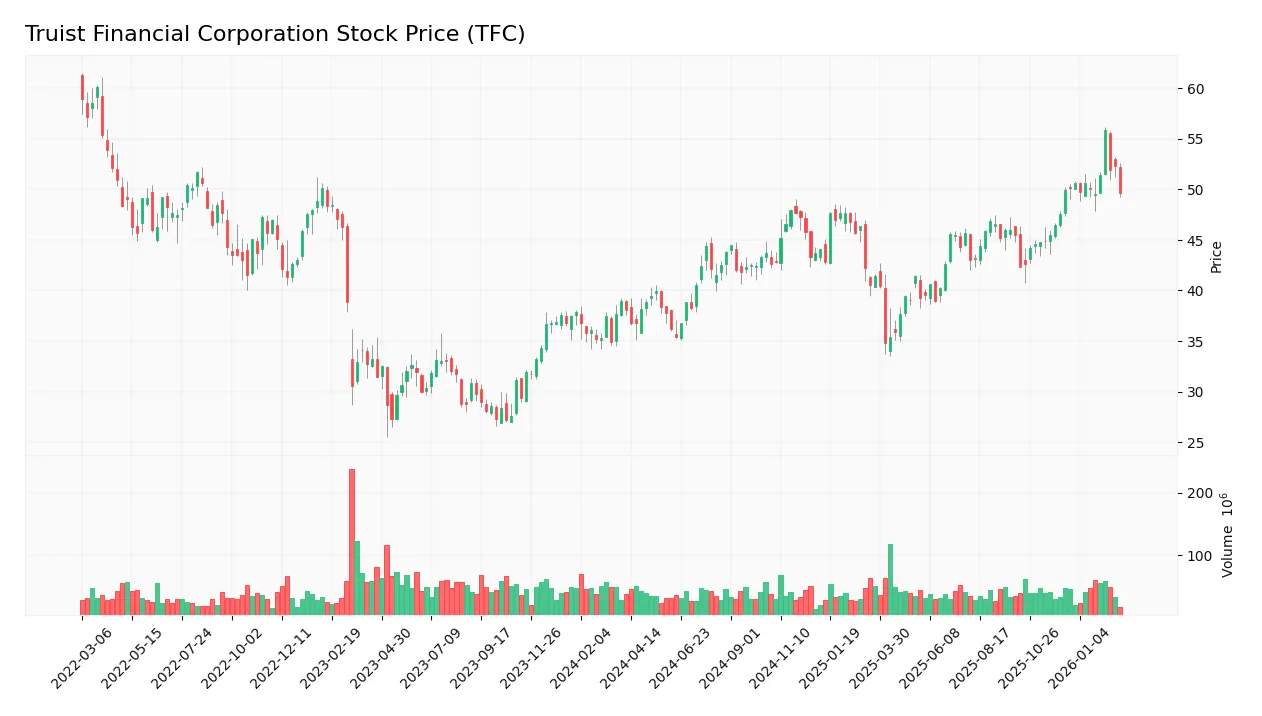
The following weekly chart illustrates Truist Financial Corporation’s stock price movements and key levels over the last year:
Trend Analysis
Over the past 12 months, TFC’s stock price rose 30.38%, confirming a strong bullish trend with accelerating momentum. The price ranged from 34.79 to a high of 55.81, reflecting significant upside amid a 4.28 volatility measure. However, from December 2025 to March 2026, the trend flattened with a minor -0.46% dip, indicating short-term neutral slope at 0.21.
Volume Analysis
Trading volumes over the last three months show buyer dominance at 60.7%, with buyer volume at 299M versus seller volume of 194M. Overall volume is decreasing, suggesting waning market participation but persistent bullish investor sentiment during this period.
Target Prices
Analysts set a target consensus of $58.5 for Truist Financial Corporation (TFC).
| Target Low | Target High | Consensus |
|---|---|---|
| 53 | 69 | 58.5 |
This range signals moderate optimism, with expectations of steady growth balanced by sector volatility.

Don’t Let Luck Decide Your Entry Point
Optimize your entry points with our advanced ProRealTime indicators. You’ll get efficient buy signals with precise price targets for maximum performance. Start outperforming now!
Analyst & Consumer Opinions
This section examines Truist Financial Corporation’s recent analyst ratings and consumer feedback to gauge market sentiment.
Stock Grades
The latest stock grades from leading financial institutions for Truist Financial Corporation are as follows:
| Grading Company | Action | New Grade | Date |
|---|---|---|---|
| Morgan Stanley | Upgrade | Overweight | 2026-02-17 |
| JP Morgan | Maintain | Neutral | 2026-02-09 |
| Evercore ISI Group | Maintain | Outperform | 2026-02-05 |
| Argus Research | Maintain | Buy | 2026-01-23 |
| Piper Sandler | Maintain | Neutral | 2026-01-22 |
| TD Cowen | Maintain | Buy | 2026-01-22 |
| TD Cowen | Maintain | Buy | 2026-01-07 |
| Raymond James | Maintain | Outperform | 2026-01-07 |
| JP Morgan | Maintain | Neutral | 2026-01-06 |
| Evercore ISI Group | Upgrade | Outperform | 2026-01-06 |
Overall, the grades show a positive tilt with multiple upgrades and a consensus leaning toward Buy. Neutral ratings persist but do not dominate, indicating cautious optimism among analysts.
Consumer Opinions
Consumers express a mix of appreciation and frustration toward Truist Financial Corporation, reflecting a complex relationship with the bank’s services.
| Positive Reviews | Negative Reviews |
|---|---|
| Efficient mobile app with user-friendly design | Long wait times for customer support |
| Competitive mortgage and loan rates | Occasional technical glitches in online banking |
| Helpful and knowledgeable branch staff | Fees perceived as high compared to competitors |
| Strong community engagement and local presence | Limited ATM locations in rural areas |
Overall, customers value Truist’s digital tools and personalized service but frequently cite slow support and fee concerns. The bank’s community focus earns praise despite occasional technology hiccups.
Risk Analysis
Below is a table summarizing the key risks facing Truist Financial Corporation, including their likelihood and potential impact:
| Category | Description | Probability | Impact |
|---|---|---|---|
| Financial Health | Altman Z-Score in distress zone signals high bankruptcy risk despite strong Piotroski score | High | Severe |
| Liquidity | Current ratio below 1.0 indicates potential liquidity stress in tight credit cycles | Medium | Moderate |
| Leverage | Debt-to-equity ratio above 1.0 suggests elevated leverage, increasing financial risk | Medium | High |
| Profitability | ROE and ROIC below WACC reflect weak capital efficiency and value destruction risk | Medium | Moderate |
| Interest Coverage | Interest coverage under 1.0 signals difficulty covering debt costs in rising rate environments | High | High |
| Market Volatility | Beta below 1 reduces market risk but does not insulate from sector-wide shocks | Low | Moderate |
Truist’s most pressing risks stem from its distressed Altman Z-Score and weak interest coverage ratio. These highlight financial stress and vulnerability to rising interest rates. Its leverage amplifies risk amid uncertain economic cycles. Prudence dictates careful monitoring before adding to portfolios.
Should You Buy Truist Financial Corporation?
Truist appears to be navigating a challenging phase with declining ROIC and a very unfavorable moat, suggesting value destruction. While profitability shows moderate improvement, its leverage profile remains substantial. The overall B+ rating reflects a cautiously favorable but risk-aware investment profile.
Strength & Efficiency Pillars
Truist Financial Corporation maintains solid operational efficiency with a gross margin of 62.21% and an EBIT margin of 20.86%. The net margin stands favorably at 17.44%, reflecting good core profitability. However, both ROE at 8.14% and ROIC at 3.61% lag behind the WACC of 9%, indicating the company is not creating shareholder value. Historically in banking, ROIC below WACC signals value erosion. Despite strong revenue growth of 25.5% in the last year, profitability metrics show mixed signals.
Weaknesses and Drawbacks
The company faces critical financial distress, with an Altman Z-Score of 0.11, placing it deep in the Distress Zone and signaling a high bankruptcy risk. This solvency red flag outweighs other positive aspects. Additionally, leverage is unfavorable with a debt-to-equity ratio of 1.07 and a current ratio below 1 at 0.87, indicating liquidity constraints. Interest coverage is weak at 0.63x, stressing the burden of debt servicing. While valuation appears moderate (P/E 11.75, P/B 0.96), these metrics offer limited comfort amid solvency concerns.
Our Final Verdict about Truist Financial Corporation
Despite operational strengths and strong buyer dominance (60.7%) recently, the distressed financial position marked by a 0.11 Altman Z-Score makes the investment profile highly speculative. The risk of insolvency overshadows profitability and growth trends. Investors should approach with caution, as the company may appear attractive on surface metrics but carries significant solvency risk that could lead to severe capital loss.
Disclaimer: This content is for informational purposes only and does not constitute financial, investment, or other professional advice. Investing in financial markets involves a significant risk of loss, and past performance is not indicative of future results.
Additional Resources
- Truist Financial Corporation $TFC Stock Holdings Increased by Colonial Trust Advisors – MarketBeat (Feb 25, 2026)
- Decoding Truist Financial Corp (TFC): A Strategic SWOT Insight – GuruFocus (Feb 25, 2026)
- Truist announces redemption of senior notes due March 2027 – PR Newswire (Feb 18, 2026)
- Nkcfo LLC Acquires Shares of 38,700 Truist Financial Corporation $TFC – MarketBeat (Feb 24, 2026)
- Truist Financial’s Series O Preferred Stock Crosses Above 6% Yield Territory – Nasdaq (Feb 24, 2026)
For more information about Truist Financial Corporation, please visit the official website: truist.com