Home > Analyses > Technology > Trimble Inc.
Trimble Inc. revolutionizes how industries build, farm, and move by integrating cutting-edge positioning and software technologies into everyday operations. Its solutions redefine construction accuracy, precision agriculture, and transportation logistics, setting the standard for innovation and efficiency. Known for robust market influence and a diverse product portfolio, Trimble shapes critical infrastructure worldwide. As 2026 unfolds, I explore whether its strong fundamentals and technological edge still justify its current valuation and growth expectations.

Table of contents
Business Model & Company Overview
Trimble Inc., founded in 1978 and headquartered in Westminster, California, commands a leading position in the hardware and technology solutions sector. It delivers an integrated ecosystem that empowers professionals and field workers to optimize workflows across construction, agriculture, geospatial, and transportation industries. Trimble’s suite spans from 3D design and project management software to precision hardware systems, forming a cohesive mission to transform operational efficiency globally.
The company’s revenue engine balances hardware sales with robust software and recurring service offerings. Trimble exploits strategic footprints across the Americas, Europe, and Asia, driving demand for its field equipment, navigation systems, and enterprise software. This diverse mix creates dependable cash flows and fortifies its economic moat, securing Trimble’s pivotal role in shaping the future of precision technology.
Financial Performance & Fundamental Metrics
I will analyze Trimble Inc.’s income statement, key financial ratios, and dividend payout policy to assess its core financial health and shareholder returns.
Income Statement
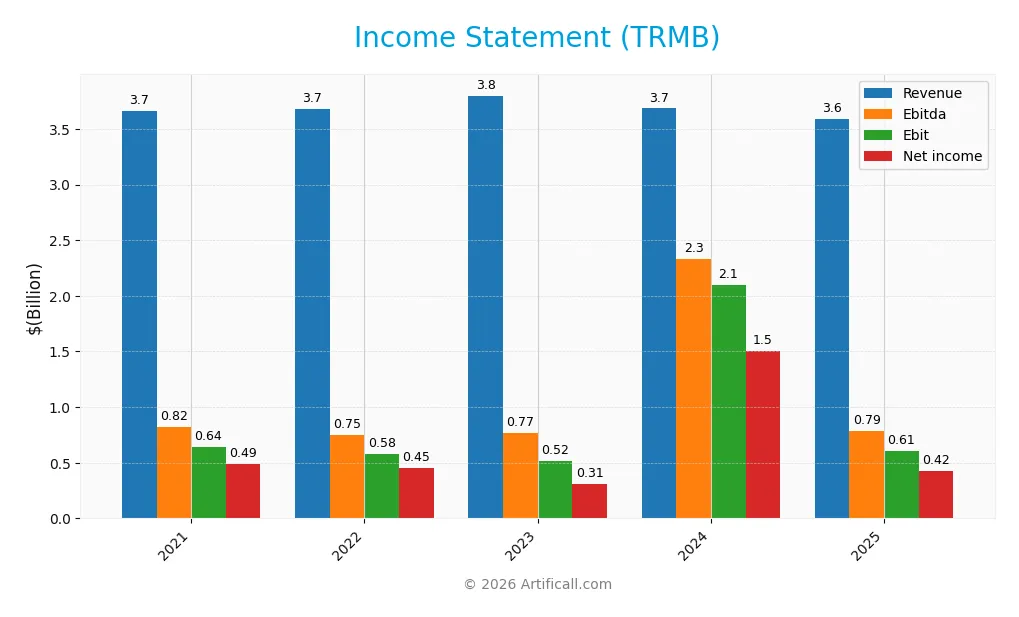
This table summarizes Trimble Inc.’s key income statement metrics for fiscal years 2021 through 2025, illustrating revenue trends, profitability, and earnings per share.
| 2021 | 2022 | 2023 | 2024 | 2025 | |
|---|---|---|---|---|---|
| Revenue | 3.66B | 3.68B | 3.80B | 3.68B | 3.59B |
| Cost of Revenue | 1.62B | 1.57B | 1.47B | 1.29B | 1.14B |
| Operating Expenses | 1.47B | 1.59B | 1.88B | 1.94B | 1.84B |
| Gross Profit | 2.03B | 2.11B | 2.33B | 2.40B | 2.45B |
| EBITDA | 820M | 747M | 769M | 2.33B | 789M |
| EBIT | 640M | 576M | 518M | 2.10B | 610M |
| Interest Expense | 65M | 71M | 161M | 91M | 74M |
| Net Income | 493M | 450M | 311M | 1.50B | 424M |
| EPS | 1.96 | 1.81 | 1.26 | 6.13 | 1.77 |
| Filing Date | 2022-02-23 | 2023-02-17 | 2024-02-26 | 2025-04-25 | 2026-02-25 |
Income Statement Evolution
Trimble’s revenue declined slightly by 2.6% in 2025, continuing a modest overall decrease since 2021. Gross profit remained stable with a 2.3% rise in 2025, maintaining a strong gross margin near 68%. However, net income and EBIT margins weakened significantly, reflecting margin contraction and rising costs over the period.
Is the Income Statement Favorable?
In 2025, Trimble posted a net margin of 11.8%, with EBIT margin at 17%, both rated favorable despite sharp year-over-year declines in net income and EPS exceeding 70%. Interest expense remains low at 2.1% of revenue. Overall, the fundamentals appear mixed, with strong margins but falling profitability and earnings growth, leading to an unfavorable income statement assessment.
Financial Ratios
The table below summarizes key financial ratios for Trimble Inc. over the last five fiscal years, offering insight into profitability, valuation, liquidity, leverage, efficiency, and shareholder returns:
| Ratios | 2021 | 2022 | 2023 | 2024 | 2025 |
|---|---|---|---|---|---|
| Net Margin | 13% | 12% | 8% | 41% | 12% |
| ROE | 12% | 11% | 7% | 26% | 7% |
| ROIC | 8% | 7% | 5% | 4% | 6% |
| P/E | 44.5 | 28.0 | 42.4 | 11.5 | 43.9 |
| P/B | 5.56 | 3.10 | 2.93 | 3.02 | 3.19 |
| Current Ratio | 1.22 | 1.04 | 1.00 | 1.27 | 1.09 |
| Quick Ratio | 0.91 | 0.76 | 0.87 | 1.16 | 0.96 |
| D/E | 0.36 | 0.40 | 0.71 | 0.26 | 0.24 |
| Debt-to-Assets | 20% | 22% | 33% | 16% | 15% |
| Interest Coverage | 8.58 | 7.19 | 2.79 | 5.08 | 8.17 |
| Asset Turnover | 0.52 | 0.51 | 0.40 | 0.39 | 0.39 |
| Fixed Asset Turnover | 9.78 | 10.81 | 11.63 | 11.81 | 19.62 |
| Dividend Yield | 0% | 0% | 0% | 0% | 0% |
Evolution of Financial Ratios
From 2021 to 2025, Trimble’s Return on Equity (ROE) declined notably from 12.49% to 7.27%, indicating weakened profitability. The Current Ratio showed modest fluctuation, ending near 1.09 in 2025, reflecting stable but tight liquidity. Debt-to-Equity ratio improved significantly, dropping from 0.71 to 0.24, signaling reduced financial leverage over the period.
Are the Financial Ratios Favorable?
In 2025, Trimble posts a favorable net margin of 11.82% and a low debt-to-equity ratio of 0.24, showing sound leverage management. Liquidity ratios are neutral, with a current ratio of 1.09 and quick ratio near 0.96, suggesting adequate short-term liquidity. However, ROE at 7.27% and a high P/E ratio of 43.86 are unfavorable, alongside weak asset turnover at 0.39. Overall, the financial ratios lean slightly unfavorable.
Shareholder Return Policy
Trimble Inc. does not pay dividends, reflecting its focus on reinvestment and growth rather than immediate shareholder payouts. The company does not engage in share buybacks, which suggests capital is likely directed towards R&D, acquisitions, or operational expansion.
This policy aligns with a long-term value creation strategy, prioritizing sustainable growth over short-term distributions. However, investors should monitor free cash flow closely to ensure ongoing capital allocation supports future shareholder returns.
Score analysis
Here is a radar chart highlighting the company’s key financial metric scores for a comprehensive view:
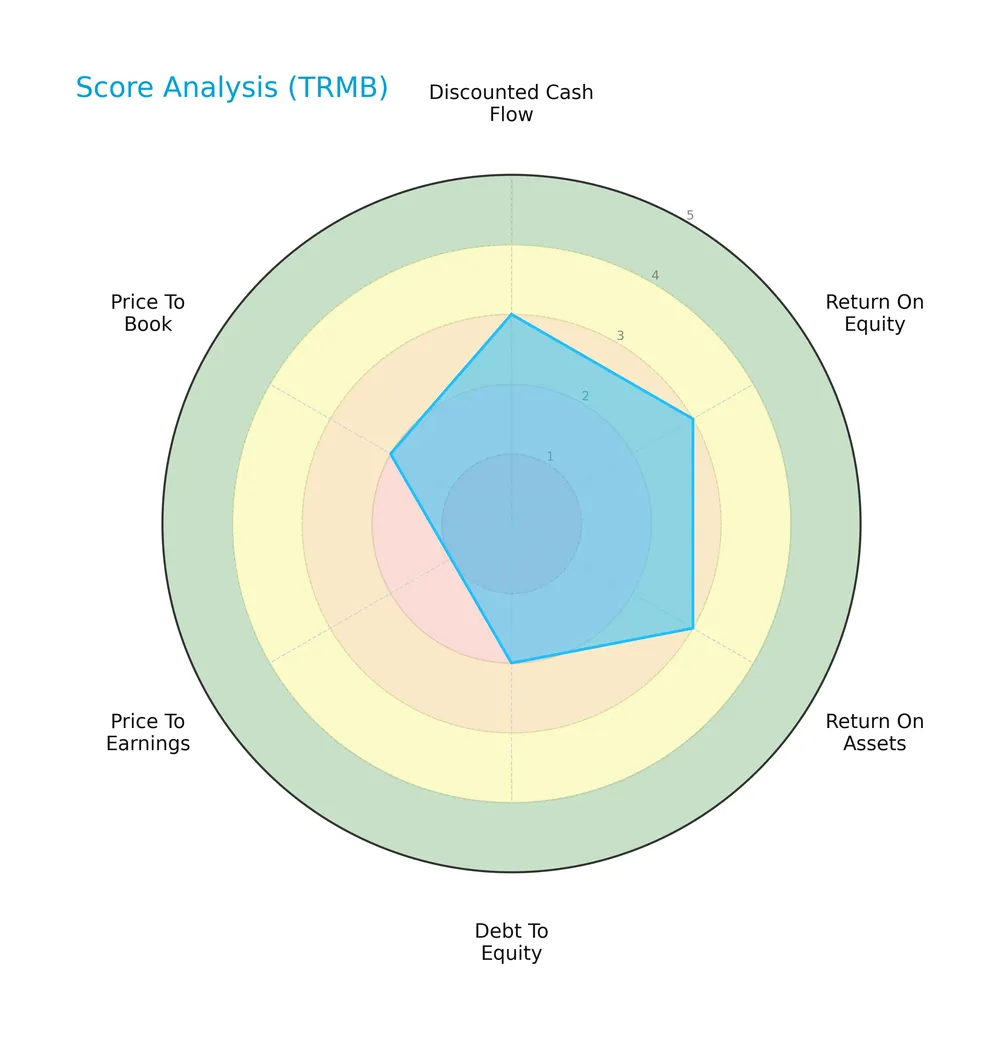
Trimble Inc. shows moderate scores in discounted cash flow, ROE, and ROA, indicating balanced profitability. However, debt-to-equity and price-to-book scores remain unfavorable, with a very unfavorable price-to-earnings score reflecting valuation challenges.
Analysis of the company’s bankruptcy risk
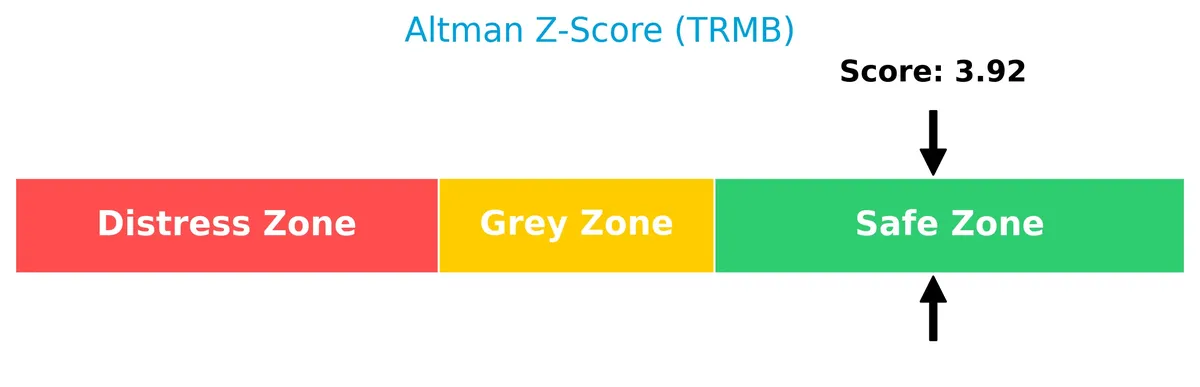
The Altman Z-Score places Trimble comfortably in the safe zone, signaling low bankruptcy risk and financial stability:
Is the company in good financial health?
The Piotroski Score diagram offers insight into Trimble’s current financial strength and operational efficiency:

With a Piotroski Score of 6, Trimble demonstrates average financial health. This suggests moderate strength but room for improvement in areas like profitability and leverage management.
Competitive Landscape & Sector Positioning
This analysis examines Trimble Inc.’s position within the technology sector and its strategic footprint. It will explore the company’s revenue streams, key products, and main competitors. I will assess whether Trimble holds a competitive advantage over its industry rivals.
Strategic Positioning
Trimble Inc. operates a diversified portfolio across Buildings and Infrastructure, Geospatial, Resources and Utilities, and Transportation segments. Geographically, it maintains broad exposure with dominant revenue from North America ($2.1B), significant presence in Europe ($1B), and growing Asia Pacific operations ($350M).
Revenue by Segment
This pie chart illustrates Trimble Inc.’s revenue breakdown for fiscal year 2025, detailing contributions from Product and Service segments.
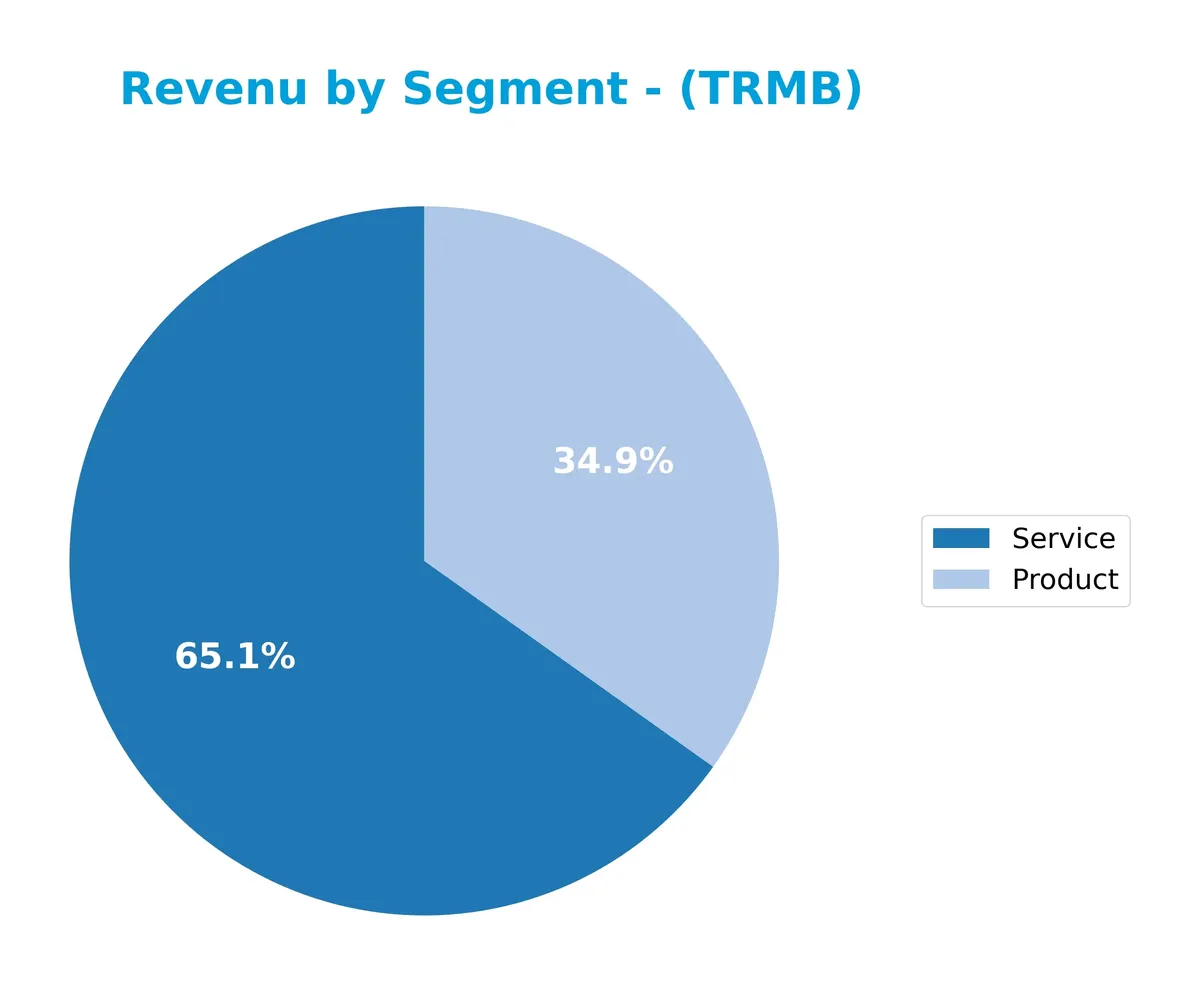
In 2025, Trimble’s revenue leaned heavily on Services, which reached $2.45B, surpassing Product sales at $1.14B. This shift from prior years shows a strategic tilt towards recurring revenue streams. Compared to 2024, Service revenue accelerated slightly, while Product sales declined, indicating potential concentration risk if product innovation lags. Historically, I see that such service dominance often stabilizes cash flow but demands sustained customer engagement.
Key Products & Brands
Trimble’s diverse portfolio spans hardware, software, and technology solutions across multiple industries:
| Product | Description |
|---|---|
| Buildings and Infrastructure | Software for 3D design, construction equipment control, asset management, and project collaboration. |
| Geospatial | Surveying and geographic information systems products. |
| Resources and Utilities | Precision agriculture technologies including autonomous steering, variable-rate application, and water solutions. |
| Transportation | Fleet management, route optimization, safety compliance, video intelligence, and supply chain solutions. |
| Product | Hardware and equipment offerings across segments, including measurement and navigation systems. |
| Service | Software, support, and subscription services enhancing product functionality and customer experience. |
Trimble integrates hardware and software to serve construction, agriculture, geospatial, and transportation markets. Its broad technology suite supports both product sales and recurring service revenues, reflecting a balanced business model.
Main Competitors
Trimble Inc. operates among 20 competitors, with the table below listing the top 10 leaders by market capitalization:
| Competitor | Market Cap. |
|---|---|
| Amphenol Corporation | 171B |
| Corning Incorporated | 77.7B |
| TE Connectivity Ltd. | 68.6B |
| Sandisk Corporation | 40.0B |
| Garmin Ltd. | 38.9B |
| Keysight Technologies, Inc. | 35.5B |
| Celestica Inc. | 34.0B |
| Coherent, Inc. | 28.7B |
| Jabil Inc. | 25.7B |
| Teledyne Technologies Incorporated | 24.4B |
Trimble ranks 12th, holding roughly 9.3% of the market cap of the sector leader, Amphenol. The company’s scale is below both the average market cap of the top 10 competitors (54.4B) and the sector median (21.6B). Trimble stands 17.6% below its nearest competitor above, highlighting a notable gap to climb in market positioning.
Comparisons with competitors
Check out how we compare the company to its competitors:
Does TRMB have a competitive advantage?
Trimble Inc. does not currently present a competitive advantage. Its return on invested capital (ROIC) sits below its weighted average cost of capital (WACC), indicating value destruction and declining profitability.
Looking ahead, Trimble’s diverse segments in construction, geospatial, agriculture, and transportation offer potential growth through technology solutions and market expansion, despite recent financial challenges.
SWOT Analysis
This analysis highlights Trimble Inc.’s key competitive factors and risks to inform strategic decisions.
Strengths
- Strong gross margin at 68%
- Diverse technology solutions across multiple industries
- Favorable debt levels and interest coverage
Weaknesses
- Declining revenue and net income growth
- ROIC below WACC indicating value destruction
- High valuation multiples (PE 43.9, PB 3.2)
Opportunities
- Expansion in precision agriculture and transportation tech
- Growth potential in emerging markets
- Increasing demand for integrated field and office software
Threats
- Intense competition in hardware and software sectors
- Economic sensitivity impacting capital spending
- Rapid technological change requiring continuous innovation
Trimble’s strengths in technology and margin control contrast with its declining profitability and value destruction. Strategic focus must prioritize innovation and market expansion while managing high valuation risks.
Stock Price Action Analysis
The weekly stock chart for Trimble Inc. (TRMB) displays price movement and key levels over the past 12 months, highlighting trend shifts and volatility patterns:
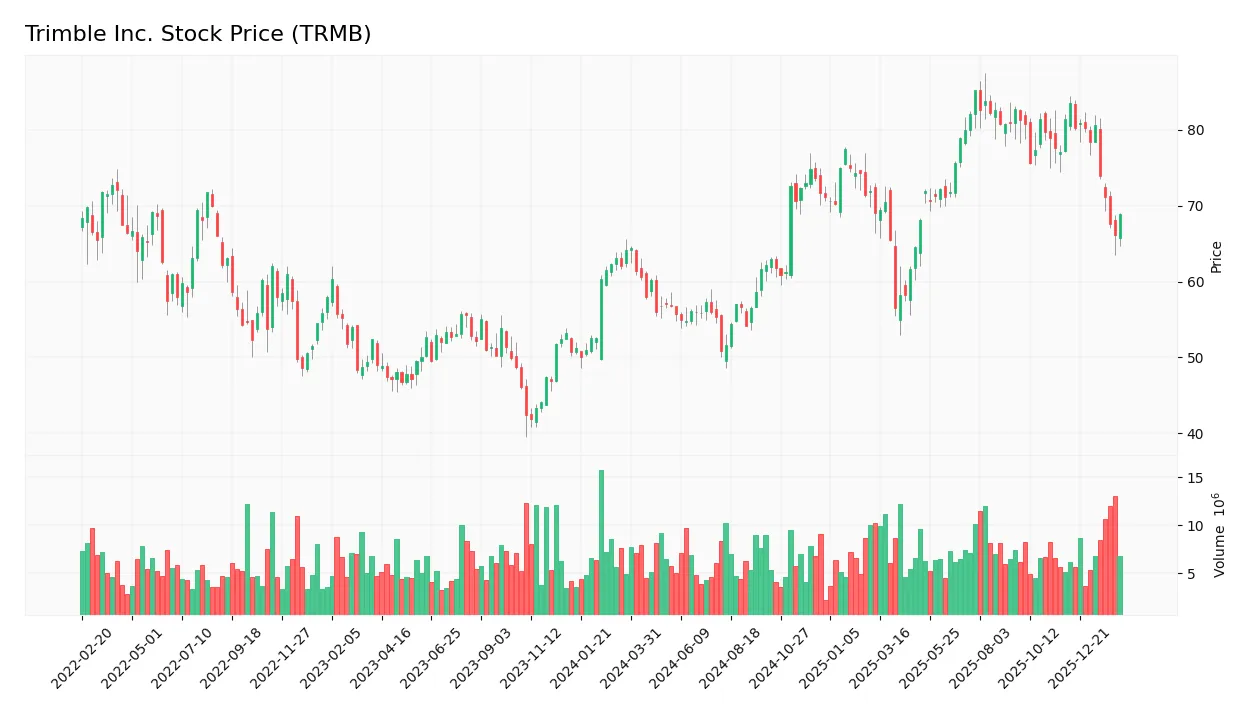
Trend Analysis
Over the past year, TRMB’s stock price rose 9.26%, indicating a bullish trend with decelerating momentum. The price ranged between 50.86 and 85.24. Despite a healthy 9.65 volatility, the recent three-month trend reversed, falling 16.35%, signaling short-term bearishness with moderate volatility and a negative slope.
Volume Analysis
In the last three months, TRMB’s trading volume increased but was seller-driven, with sellers accounting for 61.39% of activity. This shift suggests growing selling pressure and cautious investor sentiment, contrasting the overall yearly buyer dominance of 54.9%, reflecting waning market participation strength recently.
Target Prices
Analysts present a moderately bullish consensus for Trimble Inc. with a clear range of expectations.
| Target Low | Target High | Consensus |
|---|---|---|
| 86 | 101 | 95 |
The target prices indicate confidence in Trimble’s growth potential, with a consensus suggesting a mid-teens percentage upside from current levels.

Don’t Let Luck Decide Your Entry Point
Optimize your entry points with our advanced ProRealTime indicators. You’ll get efficient buy signals with precise price targets for maximum performance. Start outperforming now!
Analyst & Consumer Opinions
This section reviews the latest analyst ratings and consumer feedback concerning Trimble Inc. (TRMB) performance and outlook.
Stock Grades
Here are the latest verified stock grades for Trimble Inc. from recognized financial institutions:
| Grading Company | Action | New Grade | Date |
|---|---|---|---|
| Wells Fargo | Maintain | Overweight | 2026-02-12 |
| Barclays | Maintain | Overweight | 2026-01-12 |
| Keybanc | Upgrade | Overweight | 2025-12-16 |
| Piper Sandler | Maintain | Overweight | 2025-11-07 |
| JP Morgan | Maintain | Overweight | 2025-09-19 |
| Raymond James | Maintain | Outperform | 2025-08-07 |
| Oppenheimer | Maintain | Outperform | 2025-08-07 |
| JP Morgan | Maintain | Overweight | 2025-08-07 |
| Oppenheimer | Maintain | Outperform | 2025-07-17 |
| JP Morgan | Maintain | Overweight | 2025-07-10 |
The consensus grades show a strong bias toward “Overweight” and “Outperform” ratings, reflecting consistent confidence from analysts. One upgrade from Keybanc highlights growing optimism within the last year.
Consumer Opinions
Consumers share a mixed but insightful view on Trimble Inc., reflecting its innovation and occasional challenges.
| Positive Reviews | Negative Reviews |
|---|---|
| “Trimble’s technology significantly boosts productivity on-site.” | “The software updates sometimes disrupt workflow unexpectedly.” |
| “Customer support is knowledgeable and responsive.” | “Pricing feels steep for smaller businesses.” |
| “Hardware durability stands out even in harsh conditions.” | “Integration with third-party tools can be cumbersome.” |
Overall, customers praise Trimble’s advanced technology and strong support. However, pricing and software stability remain common concerns that could affect user satisfaction.
Risk Analysis
The following table summarizes key risks facing Trimble Inc., highlighting their likelihood and potential impact:
| Category | Description | Probability | Impact |
|---|---|---|---|
| Market Volatility | High beta of 1.576 suggests stock price swings more than the NASDAQ average. | High | Medium |
| Valuation Risk | Elevated P/E of 43.9 and P/B of 3.19 indicate possible overvaluation. | Medium | High |
| Profitability | ROE at 7.27% lags behind WACC of 10.52%, signaling value destruction risk. | Medium | High |
| Liquidity | Current ratio near 1.09 and quick ratio at 0.96 show modest short-term resilience. | Medium | Medium |
| Competitive Moat | Asset turnover is weak at 0.39, suggesting limited operational efficiency. | Medium | Medium |
| Dividend Policy | No dividend yield may deter income-focused investors and affect stock appeal. | Low | Low |
| Credit Risk | Favorable debt metrics and interest coverage over 8 reduce bankruptcy risk. | Low | Low |
Trimble’s most pressing risks stem from its stretched valuation and subpar ROE versus WACC. Despite a strong Altman Z-score confirming financial stability, the company’s profitability struggles to exceed its cost of capital. Elevated beta signals vulnerability to market swings, particularly in volatile tech sectors. Operational efficiency and liquidity remain moderate but warrant monitoring.
Should You Buy Trimble Inc.?
Trimble Inc. appears to be a company with moderate profitability but a deteriorating return on invested capital, suggesting value erosion. Despite manageable leverage and a safe Altman Z-score, its overall rating of B- reflects mixed operational efficiency and valuation concerns.
Strength & Efficiency Pillars
Trimble Inc. maintains solid operational efficiency with a gross margin of 68.32% and an EBIT margin of 16.99%, underscoring effective cost control. The net margin stands at a favorable 11.82%, reflecting consistent profitability. However, its return on invested capital (ROIC) of 6.48% trails its weighted average cost of capital (WACC) at 10.52%, indicating the company is currently destroying value rather than creating it. Return on equity (ROE) at 7.27% also remains subdued, signaling limited capital profitability.
Weaknesses and Drawbacks
Trimble faces several valuation and leverage challenges. The price-to-earnings ratio is elevated at 43.86, suggesting a premium valuation that may not be justified by fundamentals. Price-to-book at 3.19 further accentuates this rich pricing. While the debt-to-equity ratio is moderate at 0.24, the company shows a mixed liquidity profile with a current ratio of 1.09 and quick ratio of 0.96, indicating only marginal short-term buffer. Recent market dynamics reveal seller dominance at 61.39%, which may pressure the stock in the near term.
Our Final Verdict about Trimble Inc.
Trimble exhibits operational strength but currently destroys shareholder value due to ROIC below WACC. Its premium valuation and recent seller dominance suggest caution. Despite a bullish long-term stock trend, the recent market pressure implies a wait-and-see stance could be prudent. The company may appear attractive to those with a higher risk tolerance but remains challenged on capital efficiency and market sentiment.
Disclaimer: This content is for informational purposes only and does not constitute financial, investment, or other professional advice. Investing in financial markets involves a significant risk of loss, and past performance is not indicative of future results.
Additional Resources
- Decoding Trimble Inc (TRMB): A Strategic SWOT Insight – GuruFocus (Feb 26, 2026)
- Baird Lowers its Price Target on Trimble Inc. (TRMB) to $90 but Maintains an Outperform Rating – Yahoo Finance (Feb 21, 2026)
- Should Trimble’s 2025 Results and 2026 AI‑Driven Shift Require Action From Trimble (TRMB) Investors? – Sahm (Feb 22, 2026)
- Trimble: Capitalizing On AI And Data Infrastructure Construction Growth (NASDAQ: TRMB) – Seeking Alpha (Feb 17, 2026)
- Bernstein Maintains Outperform on Trimble Inc (TRMB) Feb 2026 – Meyka (Feb 12, 2026)
For more information about Trimble Inc., please visit the official website: trimble.com