Home > Analyses > Industrials > TransDigm Group Incorporated
TransDigm Group Incorporated crafts critical aircraft components that keep the aerospace and defense sectors soaring and secure. Renowned for its innovation and stringent quality standards, TDG excels in producing sophisticated mechanical and electro-mechanical systems essential to both commercial and military aviation. With a diverse product portfolio and a robust market presence, the company continually influences industry benchmarks. As we delve into its financials and growth prospects, the question remains: does TransDigm’s strong foundation still warrant its premium market valuation?
Table of contents
Business Model & Company Overview
TransDigm Group Incorporated, founded in 1993 and headquartered in Cleveland, Ohio, commands a dominant position in the aerospace & defense industry. Its business operates as an integrated ecosystem delivering specialized aircraft components through its Power & Control, Airframe, and Non-aviation segments. This comprehensive portfolio supports a diverse clientele, including airlines, military agencies, and subsystem suppliers, reinforcing its core mission of advancing aerospace technology.
The company’s revenue engine balances engineered hardware with specialized subsystems and recurring aftermarket services, creating robust value streams across global markets in the Americas, Europe, and Asia. This strategic international footprint, coupled with its focus on critical flight and defense components, underpins a strong economic moat, positioning TransDigm as a key architect of the aerospace sector’s evolving landscape.
Financial Performance & Fundamental Metrics
This section analyzes TransDigm Group Incorporated’s income statement, key financial ratios, and dividend payout policy to assess its overall financial health and investment potential.
Income Statement
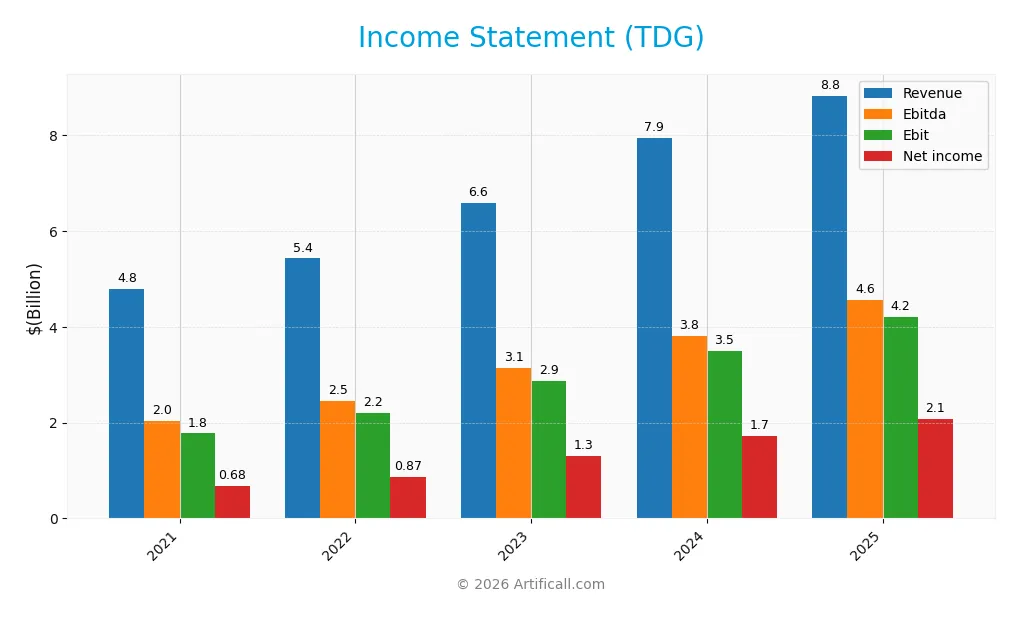
The table below presents TransDigm Group Incorporated’s key income statement figures for fiscal years 2021 through 2025, expressed in USD.
| 2021 | 2022 | 2023 | 2024 | 2025 | |
|---|---|---|---|---|---|
| Revenue | 4.8B | 5.4B | 6.6B | 7.9B | 8.8B |
| Cost of Revenue | 2.3B | 2.3B | 2.7B | 3.3B | 3.5B |
| Operating Expenses | 822M | 884M | 919M | 1.1B | 1.1B |
| Gross Profit | 2.5B | 3.1B | 3.8B | 4.7B | 5.3B |
| EBITDA | 2.0B | 2.5B | 3.1B | 3.8B | 4.6B |
| EBIT | 1.8B | 2.2B | 2.9B | 3.5B | 4.2B |
| Interest Expense | 1.1B | 1.1B | 1.2B | 1.3B | 1.6B |
| Net Income | 680M | 866M | 1.3B | 1.7B | 2.1B |
| EPS | 10.39 | 13.40 | 22.03 | 25.62 | 32.08 |
| Filing Date | 2021-11-16 | 2022-11-10 | 2023-11-09 | 2024-11-07 | 2025-11-12 |
Income Statement Evolution
TransDigm Group Incorporated (TDG) displayed consistent revenue growth from 4.8B in 2021 to 8.8B in 2025, an 84% increase over five years. Net income surged 205%, reaching 2.07B in 2025. Margins improved notably, with gross margin at 60.1% and net margin at 23.5%, reflecting enhanced profitability and operational efficiency. EBIT margin also rose to 47.6%, indicating strong core earnings.
Is the Income Statement Favorable?
The 2025 income statement shows robust fundamentals with an 11.2% revenue rise and nearly 20% EBIT growth year-over-year. Despite an unfavorable 17.8% interest expense ratio, overall profitability remains solid, supported by a favorable 8.8% net margin increase and 25.2% EPS growth. The company’s financial health is underscored by a 92.9% favorable score on income metrics, suggesting strong earnings quality and operational performance.
Financial Ratios
The table below presents key financial ratios for TransDigm Group Incorporated (TDG) over the fiscal years 2021 to 2025, providing insights into profitability, valuation, liquidity, leverage, efficiency, and dividend metrics:
| Ratios | 2021 | 2022 | 2023 | 2024 | 2025 |
|---|---|---|---|---|---|
| Net Margin | 14% | 16% | 20% | 22% | 23% |
| ROE | -23% | -23% | -65% | -27% | -21% |
| ROIC | 9% | 10% | 12% | 14% | 15% |
| P/E | 54 | 35 | 37 | 48 | 37 |
| P/B | -13 | -8 | -24 | -13 | -8 |
| Current Ratio | 4.2 | 4.0 | 4.3 | 1.6 | 3.2 |
| Quick Ratio | 3.5 | 3.0 | 3.2 | 1.3 | 2.3 |
| D/E | -6.9 | -5.3 | -10 | -4.0 | -3.1 |
| Debt-to-Assets | 104% | 109% | 99% | 97% | 131% |
| Interest Coverage | 1.5 | 2.1 | 2.4 | 2.6 | 2.6 |
| Asset Turnover | 0.25 | 0.30 | 0.33 | 0.31 | 0.39 |
| Fixed Asset Turnover | 6.2 | 6.7 | 5.2 | 5.3 | 5.6 |
| Dividend Yield | 0.2% | 3.6% | 0.08% | 2.5% | 12.6% |
Evolution of Financial Ratios
From 2021 to 2025, TransDigm Group’s Return on Equity (ROE) remained negative, showing some volatility but no recovery toward positive territory, indicating challenges in shareholder profitability. The Current Ratio exhibited fluctuations, with a notable drop in 2024 before rebounding in 2025 to 3.21, suggesting variable liquidity management. The Debt-to-Equity Ratio stayed negative throughout, reflecting an unusual capital structure with persistent leverage concerns despite fluctuations.
Are the Financial Ratios Favorable?
In 2025, profitability ratios such as net margin (23.49%) and return on invested capital (15.22%) were favorable, contrasting with the unfavorable ROE of -21.41%. Liquidity indicators presented mixed signals: a favorable quick ratio of 2.25 but an unfavorable current ratio at 3.21. Leverage ratios showed a favorable debt-to-equity at -3.1 but an unfavorable debt-to-assets ratio exceeding 130%. Efficiency metrics were mixed, with unfavorable asset turnover at 0.39 but favorable fixed asset turnover at 5.59. Overall, the ratio assessment was slightly favorable, balancing strengths in profitability and leverage against liquidity and efficiency weaknesses.
Shareholder Return Policy
TransDigm Group Incorporated (TDG) maintains a dividend payout policy with a low payout ratio around 4.6% in 2025, accompanied by a significant dividend per share increase to 165.45. The company also supports shareholder returns through share buybacks, funded by robust free cash flow coverage near 89%.
Such distributions appear sustainable given the strong profit margins and operating cash flow, though the high dividend yield of 12.55% in 2025 may warrant monitoring for potential risks. Overall, the combined dividend payments and buybacks align with a strategy targeting consistent long-term shareholder value.
Score analysis
The following radar chart presents an overview of key financial scores evaluating the company’s valuation, profitability, and leverage metrics:
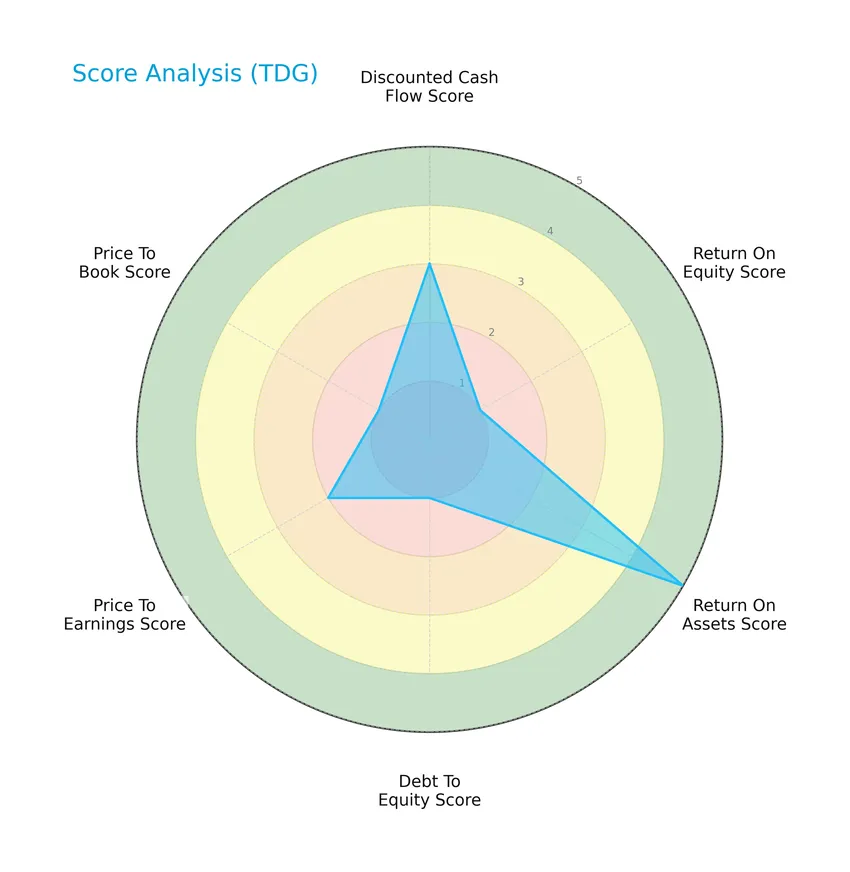
TransDigm Group shows mixed performance with a moderate discounted cash flow score (3) and price-to-earnings score (2), very favorable return on assets (5), but very unfavorable scores in return on equity (1), debt to equity (1), and price to book (1).
Analysis of the company’s bankruptcy risk
The Altman Z-Score indicates that TransDigm Group is currently in the grey zone, suggesting a moderate risk of bankruptcy:

Is the company in good financial health?
The Piotroski diagram below reflects the company’s financial strength based on nine accounting criteria:

With a Piotroski Score of 6, TransDigm Group is considered to have average financial health, indicating moderate strength but room for improvement in financial fundamentals.
Competitive Landscape & Sector Positioning
This sector analysis will examine TransDigm Group Incorporated’s strategic positioning, revenue by segment, key products, main competitors, and competitive advantages. I will also assess the company’s strengths and weaknesses to determine if it holds a competitive advantage over its peers.
Strategic Positioning
TransDigm Group Incorporated maintains a concentrated product portfolio focused on aerospace components, split mainly between Airframe ($4.1B) and Power & Control ($4.56B) segments in 2025, with limited exposure to non-aviation ($160M). Geographically, it exhibits moderate diversification, generating $5.54B domestically and $3.3B internationally.
Revenue by Segment
The pie chart illustrates TransDigm Group Incorporated’s revenue distribution by segment for the fiscal year 2025, highlighting the contribution of aviation and non-aviation businesses.
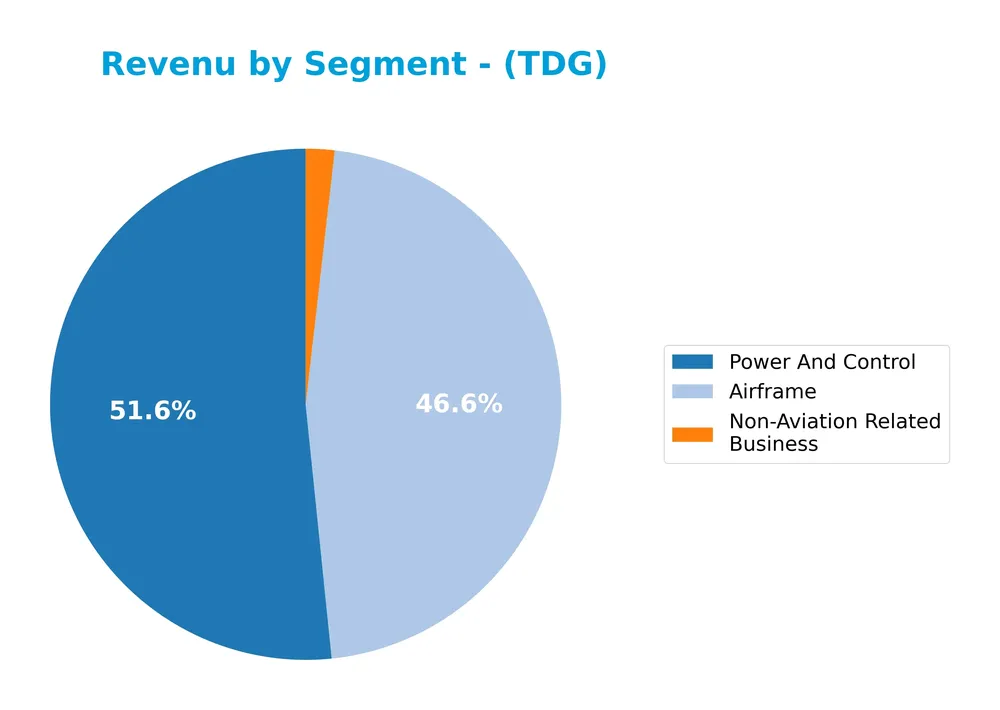
In 2025, Power And Control remains the largest revenue driver at 4.56B, followed closely by Airframe at 4.11B, both showing solid growth compared to 2024. The Non-Aviation Related Business segment is minimal at 160M, indicating a strong concentration in aviation-related products. The recent trend shows accelerating revenue in key aviation segments, sustaining TransDigm’s focus and potential concentration risk in these core areas.
Key Products & Brands
The table below outlines TransDigm Group Incorporated’s main product segments and their descriptions:
| Product | Description |
|---|---|
| Power & Control | Mechanical/electro-mechanical actuators and controls, ignition systems, specialized pumps and valves, electric motors, batteries, sensors, switches, hoists, cargo handling systems. Serves engine and power system suppliers, airlines, military agencies, and repair depots. |
| Airframe | Engineered latching and locking devices, rods, connectors, cockpit security components, displays, audio/radio systems, lavatory components, seat belts, interior surfaces, insulation, lighting, parachutes. Serves airframe manufacturers, cabin system suppliers, airlines, military agencies, repair depots. |
| Non-Aviation Related Business | Seat belts and safety restraints for ground transportation, electro-mechanical actuators for space, hydraulic actuators and fuel valves for land turbines, refueling systems for heavy equipment, turbine controls for energy and oil/gas markets. Serves off-road vehicle suppliers, child restraint suppliers, satellite and space systems, heavy equipment manufacturers. |
TransDigm’s product portfolio spans aerospace power and control systems, airframe components, and diverse non-aviation applications, serving key industrial, defense, and transportation markets globally.
Main Competitors
There are 12 competitors in total, with the table below listing the top 10 leaders by market capitalization:
| Competitor | Market Cap. |
|---|---|
| GE Aerospace | 338.3B |
| RTX Corporation | 250.7B |
| The Boeing Company | 171.4B |
| Lockheed Martin Corporation | 116.3B |
| General Dynamics Corporation | 92.6B |
| Northrop Grumman Corporation | 83.6B |
| TransDigm Group Incorporated | 76.5B |
| L3Harris Technologies, Inc. | 57.0B |
| Axon Enterprise, Inc. | 44.5B |
| BWX Technologies, Inc. | 17.3B |
TransDigm Group Incorporated ranks 7th among its 12 competitors, with a market cap about 23.62% of the top leader, GE Aerospace. The company is positioned below both the average market cap of the top 10 competitors (124.8B) and the median market cap in the sector (80.0B). It maintains a modest 4.58% gap to the next competitor above, Northrop Grumman Corporation.
Comparisons with competitors
Check out how we compare the company to its competitors:
Does TDG have a competitive advantage?
TransDigm Group Incorporated (TDG) presents a very favorable competitive advantage, demonstrated by a growing ROIC that exceeds its WACC by over 8%, indicating consistent value creation and efficient capital use. The company also maintains strong profitability metrics, including a gross margin of 60.14% and an EBIT margin of 47.57%, supporting its economic moat.
Looking ahead, TDG’s future outlook includes expanding its aerospace and defense product lines across mechanical, electro-mechanical, and specialized components, while broadening its geographic reach with increasing revenues from both U.S. and non-U.S. markets. This positions the company to capitalize on opportunities in aviation, military, and non-aviation sectors.
SWOT Analysis
This SWOT analysis highlights the key internal and external factors affecting TransDigm Group Incorporated to guide informed investment decisions.
Strengths
- strong profitability with 60% gross margin
- growing ROIC showing durable competitive advantage
- diversified aerospace & defense product portfolio
Weaknesses
- high interest expense at 17.8% impacting net income
- unfavorable debt-to-assets ratio over 130%
- moderate financial distress risk (Altman Z-Score in grey zone)
Opportunities
- expanding international sales with 3.3B Non-US revenue
- increasing aerospace & defense market demand
- potential to improve operational efficiency and reduce leverage
Threats
- high debt levels increasing financial risk
- aerospace industry cyclical downturns
- competitive pressure on pricing and innovation
TransDigm’s robust profitability and growing value creation provide a solid foundation, but investors should monitor leverage and interest costs closely. The company’s global expansion and market demand offer growth potential, balanced by risks from high debt and industry volatility. Strategic focus should be on debt management and sustaining innovation to capitalize on opportunities.
Stock Price Action Analysis
The following weekly chart illustrates TransDigm Group Incorporated’s stock price movements over the past 100 weeks:
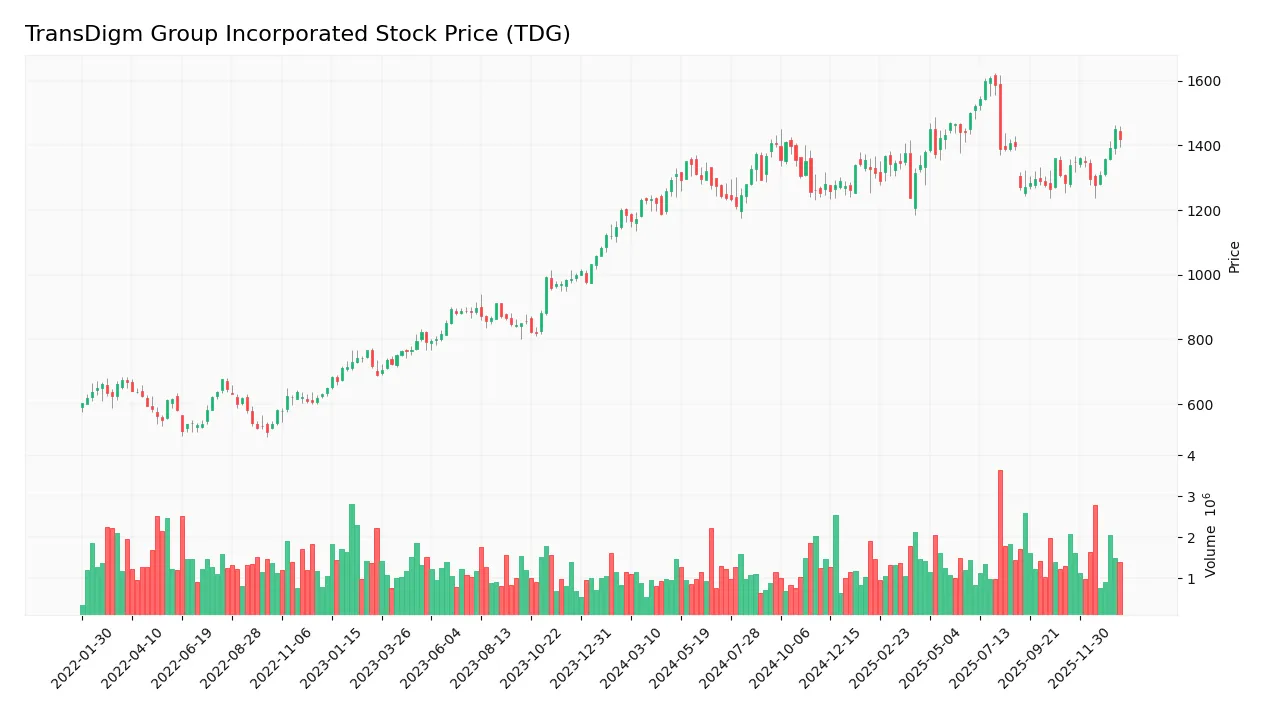
Trend Analysis
Over the past 12 months, TDG’s stock price rose by 19.94%, indicating a bullish trend with accelerating momentum. The price ranged from a low of 1164.99 to a high of 1607.45, supported by a high volatility reflected in an 88.12 standard deviation.
Volume Analysis
Trading volume has been increasing, with buyers slightly dominating at 52.17% over the full period and 55.34% in the recent 12-week window. This buyer-driven activity suggests growing investor interest and positive market participation in TDG shares.
Target Prices
The consensus target prices for TransDigm Group Incorporated (TDG) indicate a strong bullish outlook from analysts.
| Target High | Target Low | Consensus |
|---|---|---|
| 1871 | 1370 | 1601.5 |
Analysts expect TDG’s stock to trade between 1370 and 1871, with a consensus target around 1601.5, reflecting positive growth potential.

Don’t Let Luck Decide Your Entry Point
Optimize your entry points with our advanced ProRealTime indicators. You’ll get efficient buy signals with precise price targets for maximum performance. Start outperforming now!
Analyst & Consumer Opinions
This section examines the latest analyst ratings and consumer feedback related to TransDigm Group Incorporated (TDG).
Stock Grades
Here is the latest overview of TransDigm Group Incorporated’s stock grades from recognized financial institutions:
| Grading Company | Action | New Grade | Date |
|---|---|---|---|
| UBS | Maintain | Buy | 2026-01-15 |
| Morgan Stanley | Maintain | Overweight | 2025-11-14 |
| JP Morgan | Maintain | Neutral | 2025-11-14 |
| Stifel | Maintain | Buy | 2025-11-13 |
| UBS | Maintain | Buy | 2025-11-13 |
| RBC Capital | Maintain | Sector Perform | 2025-11-13 |
| BMO Capital | Maintain | Outperform | 2025-11-13 |
| Morgan Stanley | Maintain | Overweight | 2025-10-15 |
| Truist Securities | Maintain | Buy | 2025-10-15 |
| Susquehanna | Maintain | Neutral | 2025-10-09 |
Overall, the consensus indicates a generally positive outlook with most firms maintaining Buy or equivalent ratings, although some neutral and sector perform assessments suggest a balanced risk perspective among analysts.
Consumer Opinions
Consumers of TransDigm Group Incorporated (TDG) generally express mixed sentiments, balancing appreciation for product quality with concerns about pricing and customer service.
| Positive Reviews | Negative Reviews |
|---|---|
| “High-quality aerospace components with reliable performance.” | “Pricing is often higher than competitors, impacting budget.” |
| “Strong focus on innovation keeps products ahead in the market.” | “Customer support can be slow and unresponsive at times.” |
| “Durable parts that meet stringent industry standards.” | “Lead times for some parts are longer than expected.” |
Overall, customers praise TDG’s product reliability and innovation but frequently mention challenges with pricing and customer service responsiveness, suggesting areas for improvement.
Risk Analysis
Below is a summary table presenting key risks related to TransDigm Group Incorporated (TDG), highlighting their likelihood and potential impact:
| Category | Description | Probability | Impact |
|---|---|---|---|
| Financial Leverage | High debt-to-assets ratio (131.08%) increases financial risk and could strain liquidity. | High | High |
| Profitability | Negative return on equity (-21.41%) signals challenges in generating shareholder returns. | Medium | Medium |
| Market Valuation | Elevated price-to-earnings ratio (36.99) suggests the stock may be overvalued, risking corrections. | Medium | Medium |
| Liquidity | Unfavorable current ratio (3.21) despite favorable quick ratio indicates possible short-term liquidity concerns. | Medium | Medium |
| Bankruptcy Risk | Altman Z-score in grey zone (2.07) implies moderate bankruptcy risk under adverse conditions. | Medium | High |
The most significant risks stem from TransDigm’s high leverage and moderate bankruptcy risk, which warrant cautious monitoring. While profitability and valuation metrics suggest some investor caution, the company maintains solid net margins and operational efficiency, partially offsetting these risks.
Should You Buy TransDigm Group Incorporated?
TransDigm Group Incorporated appears to be creating value with a durable competitive moat and improving operational efficiency, supported by a growing ROIC. Despite a substantial leverage profile and mixed profitability signals, its overall moderate rating (C+) suggests a cautious analytical interpretation.
Strength & Efficiency Pillars
TransDigm Group Incorporated (TDG) exhibits strong profitability with a net margin of 23.49% and an EBIT margin of 47.57%, underscoring operational efficiency. The company is a clear value creator, evidenced by a robust ROIC of 15.22% exceeding its WACC of 7.12%. Although the ROE is negative at -21.41%, the Altman Z-Score places TDG in the grey zone at 2.07, suggesting moderate financial risk, while a Piotroski score of 6 indicates average financial strength. The firm’s growing ROIC trend signals a durable competitive advantage and increasing profitability.
Weaknesses and Drawbacks
TDG’s valuation metrics present concerns; a high P/E ratio of 36.99 signals a premium price, potentially limiting upside. Despite a favorable negative debt-to-equity ratio (-3.1) indicating low leverage, the debt-to-assets ratio of 131.08% flags significant asset financing risk. Additionally, the current ratio of 3.21 is marked unfavorable, which might imply inefficient working capital management relative to liquidity needs. Market pressure appears limited as buyer dominance stands at 55.34%, a slight advantage but requiring monitoring amid volatility.
Our Verdict about TransDigm Group Incorporated
TransDigm’s long-term fundamental profile appears favorable, supported by strong profitability and clear value creation. The bullish overall stock trend combined with increasing buyer dominance in the recent period suggests positive momentum. This profile may appear attractive for investors seeking exposure to a company with operational strength and a durable moat, although valuation premiums and liquidity considerations warrant a cautious approach.
Disclaimer: This content is for informational purposes only and does not constitute financial, investment, or other professional advice. Investing in financial markets involves a significant risk of loss, and past performance is not indicative of future results.
Additional Resources
- TransDigm Group Incorporated (TDG) To Acquire Jet Parts Engineering and Victor Sierra Aviation Holdings in Aftermarket Push – Yahoo Finance (Jan 21, 2026)
- TransDigm Group INC ($TDG) President, CEO, and Director 2025 Pay Revealed – Quiver Quantitative (Jan 24, 2026)
- Strs Ohio Sells 2,459 Shares of Transdigm Group Incorporated $TDG – MarketBeat (Jan 23, 2026)
- TransDigm Group Incorporated (TDG) to acquire Jet Parts Engineering and Victor Sierra Aviation Holdings in aftermarket push – MSN (Jan 21, 2026)
- TransDigm Announces Acquisition of Jet Parts Engineering and Victor Sierra Aviation Holdings – PR Newswire (Jan 16, 2026)
For more information about TransDigm Group Incorporated, please visit the official website: transdigm.com