Home > Analyses > Industrials > Trane Technologies plc
Trane Technologies revolutionizes how buildings and transport systems breathe and cool, directly shaping comfort and energy efficiency worldwide. It dominates the construction industry with flagship HVAC and refrigeration solutions under trusted brands like Trane and Thermo King. Renowned for innovation and sustainability, the company continuously pushes boundaries in climate control technology. As 2026 unfolds, I question whether Trane’s robust market position and growth prospects still justify its premium valuation.

Table of contents
Business Model & Company Overview
Trane Technologies plc, founded in 1885 and headquartered in Swords, Ireland, leads the construction equipment sector with a comprehensive ecosystem of HVAC and transport refrigeration solutions. Its product suite spans air conditioners, heat pumps, chillers, and advanced control systems, all designed to optimize indoor environments and transport refrigeration. This integrated approach defines its core mission: delivering efficient climate comfort and energy management worldwide.
The company’s revenue engine balances durable hardware with software-driven building management and recurring services like maintenance and energy contracting. Trane Technologies operates globally, leveraging strong footprints across the Americas, Europe, and Asia. Its deep product portfolio and established distribution network create a formidable economic moat, securing long-term value by shaping industry standards in climate control and sustainability.
Financial Performance & Fundamental Metrics
I analyze Trane Technologies plc’s income statement, key financial ratios, and dividend payout policy to assess its profitability, efficiency, and shareholder returns.
Income Statement
The table below summarizes Trane Technologies plc’s key income statement figures for fiscal years 2021 through 2025. Values are in USD.

| 2021 | 2022 | 2023 | 2024 | 2025 | |
|---|---|---|---|---|---|
| Revenue | 14.1B | 16.0B | 17.7B | 19.8B | 21.3B |
| Cost of Revenue | 9.7B | 11.0B | 11.8B | 12.8B | 13.6B |
| Operating Expenses | 2.4B | 2.5B | 3.0B | 3.6B | 3.7B |
| Gross Profit | 4.5B | 5.0B | 5.9B | 7.1B | 7.7B |
| EBITDA | 2.3B | 2.7B | 3.1B | 3.9B | 4.2B |
| EBIT | 2.0B | 2.4B | 2.8B | 3.5B | 3.9B |
| Interest Expense | 234.0M | 223.5M | 234.5M | 238.4M | 227.5M |
| Net Income | 1.4B | 1.8B | 2.0B | 2.6B | 2.9B |
| EPS | 5.96 | 7.55 | 8.85 | 11.44 | 13.09 |
| Filing Date | 2022-02-07 | 2023-02-10 | 2024-02-08 | 2025-02-06 | 2026-01-29 |
Income Statement Evolution
Trane Technologies’ revenue rose from $14.1B in 2021 to $21.3B in 2025, a 51% increase. Net income more than doubled, reaching $2.9B in 2025. Gross margin improved steadily to 36.2%, while EBIT margin expanded to 18.3%. Margins and profitability trends suggest sustained operational efficiency gains over the five-year span.
Is the Income Statement Favorable?
The 2025 income statement shows favorable fundamentals, with a 13.7% net margin and 18.3% EBIT margin reflecting strong profitability. Revenue growth slowed to 7.5% year-over-year but remained solid. Operating expenses aligned with revenue growth, supporting margin expansion. Interest expense remained low at 1.1% of revenue, enhancing net income quality. Overall, the income statement demonstrates robust financial health and operational discipline.
Financial Ratios
The table below summarizes key financial ratios for Trane Technologies plc across recent fiscal years, providing insight into profitability, liquidity, leverage, efficiency, and dividend metrics:
| Ratios | 2021 | 2022 | 2023 | 2024 | 2025 |
|---|---|---|---|---|---|
| Net Margin | 10.1% | 11.0% | 11.4% | 12.9% | 13.7% |
| ROE | 22.7% | 28.8% | 28.9% | 34.4% | 33.9% |
| ROIC | 12.1% | 14.9% | 16.5% | 19.2% | 20.3% |
| P/E | 33.9 | 22.3 | 27.4 | 32.3 | 29.8 |
| P/B | 7.69 | 6.40 | 7.92 | 11.1 | 10.1 |
| Current Ratio | 1.36 | 1.12 | 1.13 | 1.21 | 1.25 |
| Quick Ratio | 1.04 | 0.77 | 0.78 | 0.88 | 0.92 |
| D/E | 0.77 | 0.79 | 0.68 | 0.72 | 0.54 |
| Debt-to-Assets | 26.8% | 26.7% | 24.6% | 26.7% | 21.5% |
| Interest Coverage | 8.66 | 10.8 | 12.3 | 14.7 | 17.4 |
| Asset Turnover | 0.78 | 0.88 | 0.91 | 0.98 | 1.00 |
| Fixed Asset Turnover | 10.1 | 10.4 | 7.74 | 9.80 | 9.47 |
| Dividend Yield | 1.16% | 1.59% | 1.23% | 0.91% | 0.96% |
Evolution of Financial Ratios
Return on Equity (ROE) steadily improved from 22.7% in 2021 to 33.9% in 2025, signaling stronger profitability. The Current Ratio showed moderate fluctuation, rising from 1.36 in 2021 to 1.25 in 2025, reflecting stable liquidity. Debt-to-Equity ratio declined from 0.77 in 2021 to 0.54 in 2025, indicating modest deleveraging and improved financial stability.
Are the Financial Ratios Fovorable?
Profitability ratios such as ROE (33.9%) and Net Margin (13.7%) are favorable, supported by a strong Return on Invested Capital (20.3%). Liquidity ratios remain neutral with a Current Ratio of 1.25 and Quick Ratio near 0.92. Leverage metrics reveal a moderate Debt-to-Equity ratio at 0.54 and a favorable Debt-to-Assets ratio of 21.6%. Market multiples, including P/E (29.8) and P/B (10.1), are unfavorable. Overall, the financial ratios are slightly favorable, balancing solid profitability against some valuation and liquidity caution.
Shareholder Return Policy
Trane Technologies maintains a consistent dividend payout ratio near 29%, with dividend per share rising from $2.35 in 2021 to $3.74 in 2025. The dividend yield hovers around 1%, supported by free cash flow that covers dividends and capital expenditures more than twice over, indicating prudent capital allocation.
The company’s balanced policy includes share buybacks, complementing dividends without excessive leverage. This disciplined approach aligns with sustainable long-term shareholder value creation, avoiding risks of over-distribution or cash flow strain.
Score analysis
The following radar chart depicts key valuation and financial performance metrics for Trane Technologies plc:
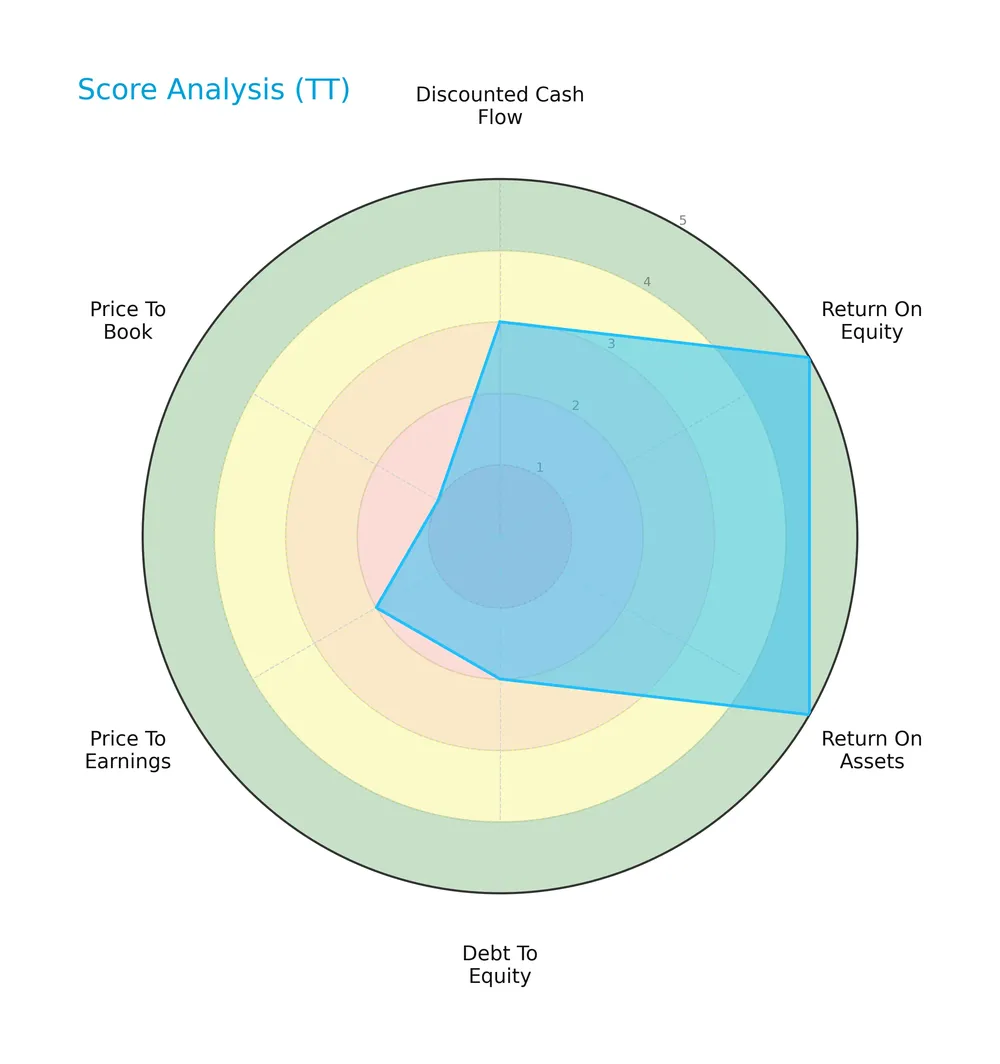
The company scores very favorably on return on equity and assets, indicating efficient capital use. Debt to equity, price to earnings, and price to book ratios remain unfavorable, reflecting leverage and valuation concerns. The discounted cash flow rating is moderate.
Analysis of the company’s bankruptcy risk
Trane Technologies plc’s Altman Z-Score places it comfortably in the safe zone, signaling low bankruptcy risk:

Is the company in good financial health?
This Piotroski diagram illustrates the company’s strong financial health based on nine financial criteria:

A Piotroski score of 8 confirms very strong financial strength, suggesting robust profitability, liquidity, and operational efficiency.
Competitive Landscape & Sector Positioning
This sector analysis explores Trane Technologies plc’s strategic positioning, revenue segments, key products, and main competitors. I will assess whether the company holds a competitive advantage within the industrials sector over its peers.
Strategic Positioning
Trane Technologies concentrates on HVAC and transport refrigeration, balancing product (13.3B in 2024) and service (6.5B) revenues. Its geographic exposure is diversified, with 15.9B from Americas, 2.6B from EMEA, and 1.4B from Asia Pacific in 2024.
Revenue by Segment
The pie chart illustrates Trane Technologies plc’s revenue distribution by product and service segments for the fiscal year 2024.
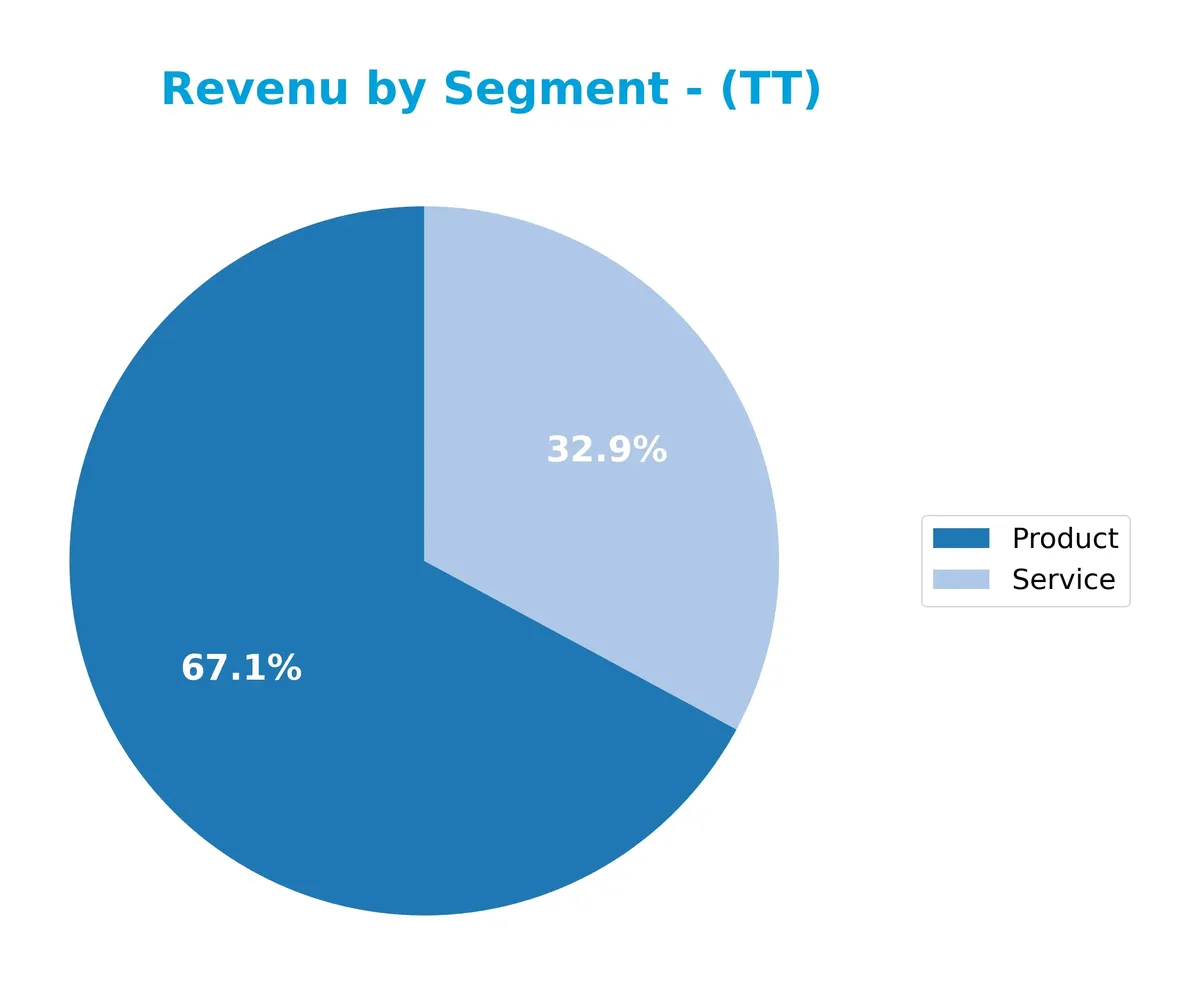
In 2024, the product segment led with $13.3B, while services contributed $6.5B, reflecting a stable growth trajectory since 2021. The product segment drives revenue, showing consistent expansion and reinforcing its core role. Service revenues also steadily increase, indicating diversification. Recent years exhibit acceleration in both segments, reducing concentration risk and strengthening the company’s market position.
Key Products & Brands
Trane Technologies’ product and brand portfolio spans comprehensive climate control and refrigeration solutions:
| Product | Description |
|---|---|
| Air Conditioners | Systems for heating, ventilation, and air conditioning tailored to residential, commercial, and industrial applications. |
| Heat Pumps & Furnaces | Equipment designed to provide efficient heating solutions across multiple environments. |
| Chillers & Coils | Components and systems focused on cooling and heat exchange for commercial and industrial uses. |
| Transport Refrigeration | Hybrid and non-diesel refrigeration units for buses, trailers, trucks, rail, and other transport vehicles under Thermo King. |
| Building Management Systems | Integrated controls and automation products for facility energy and climate management. |
| Aftermarket & OEM Parts | Replacement parts and supplies supporting product maintenance and longevity. |
| Energy & Facility Services | Installation, repair, maintenance, rental, and performance contracting services complementing product offerings. |
Trane Technologies emphasizes sustainable climate solutions under Trane and Thermo King. Its wide product range addresses diverse customer needs in HVAC and transport refrigeration, supported by extensive service capabilities.
Main Competitors
There are 6 competitors in total, with the table below listing the top 6 leaders by market capitalization:
| Competitor | Market Cap. |
|---|---|
| Trane Technologies plc | 88.3B |
| Johnson Controls International plc | 80.0B |
| Carrier Global Corporation | 45.1B |
| Lennox International Inc. | 17.5B |
| Masco Corporation | 13.4B |
| Builders FirstSource, Inc. | 11.6B |
Trane Technologies plc ranks 1st among its competitors and has a market cap 14% above the sector leader benchmark. It stands well above both the average market cap of the top 10 (42.6B) and the sector median (31.3B). The company leads its nearest rival, Johnson Controls, by nearly 26%, indicating a strong market position.
Comparisons with competitors
Check out how we compare the company to its competitors:
Does TT have a competitive advantage?
Trane Technologies plc demonstrates a clear competitive advantage, reflected in its very favorable moat status and a ROIC exceeding WACC by 11%. Its growing ROIC trend signals efficient capital use and sustained value creation.
Looking ahead, TT’s diverse HVAC and refrigeration product portfolio, combined with expanding geographic reach, offers growth opportunities. The company’s investments in energy management and innovative solutions support long-term market relevance.
SWOT Analysis
This analysis highlights Trane Technologies plc’s key internal and external factors shaping its competitive stance and growth potential.
Strengths
- Strong global brand portfolio
- Robust ROIC at 20.3%, well above WACC
- Consistent revenue and earnings growth over 5 years
Weaknesses
- High P/E and P/B ratios suggest overvaluation
- Moderate current and quick ratios indicate liquidity caution
- Dividend yield below industry average at 0.96%
Opportunities
- Expanding energy-efficient HVAC solutions
- Growing demand in emerging markets
- Innovation in sustainable refrigeration technologies
Threats
- Intense competition in HVAC and refrigeration
- Rising raw material and energy costs
- Economic slowdowns impacting construction spending
Trane Technologies demonstrates a solid moat with growing profitability and strong financial health. However, valuation and liquidity metrics urge caution. The company should leverage innovation and emerging markets to offset competitive and cost pressures.
Stock Price Action Analysis
The following weekly chart displays Trane Technologies plc’s stock price movement over the last 100 weeks, highlighting key highs and lows:
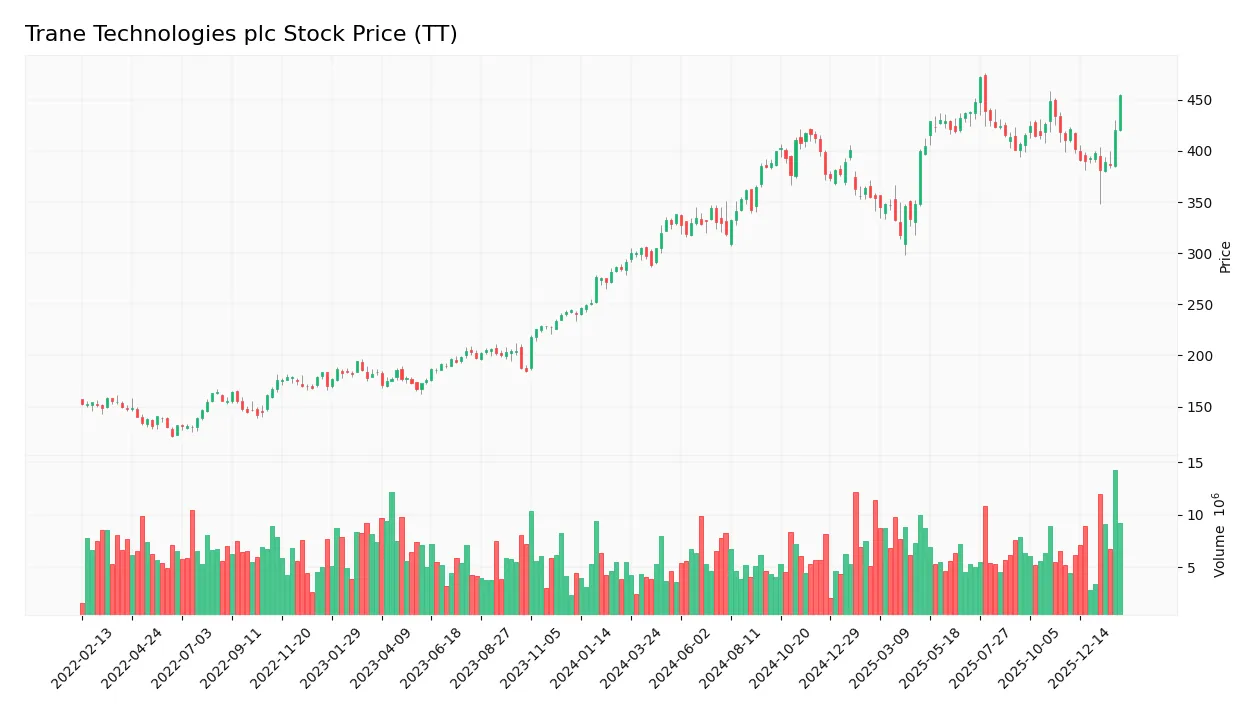
Trend Analysis
Over the past two years, Trane Technologies’ stock gained 56.06%, indicating a strong bullish trend. The price accelerated with a high volatility level, reflected in a 43.76 standard deviation. The stock peaked at 472.07 and bottomed at 288.27, confirming robust upward momentum.
Volume Analysis
Trading volume increased overall, with buyers accounting for 52.22% of activity, suggesting buyer-driven momentum historically. However, in the recent three months, seller volume slightly exceeded buyers at 46.12M vs. 43.27M, indicating neutral buyer behavior and mixed investor sentiment.
Target Prices
Analysts set a solid target consensus for Trane Technologies plc, reflecting bullish sentiment.
| Target Low | Target High | Consensus |
|---|---|---|
| 370 | 520 | 471.88 |
The target range shows confidence in upside potential, with consensus near 472. The high target at 520 signals strong growth expectations.

Don’t Let Luck Decide Your Entry Point
Optimize your entry points with our advanced ProRealTime indicators. You’ll get efficient buy signals with precise price targets for maximum performance. Start outperforming now!
Analyst & Consumer Opinions
This section examines Trane Technologies plc’s analyst grades and consumer feedback to highlight market sentiment and user experience.
Stock Grades
Here are the latest verified analyst grades for Trane Technologies plc, reflecting a stable consensus across major firms:
| Grading Company | Action | New Grade | Date |
|---|---|---|---|
| Wells Fargo | Maintain | Underweight | 2026-01-30 |
| Citigroup | Maintain | Buy | 2026-01-30 |
| RBC Capital | Maintain | Sector Perform | 2026-01-30 |
| Barclays | Maintain | Overweight | 2026-01-30 |
| JP Morgan | Maintain | Neutral | 2026-01-30 |
| Oppenheimer | Maintain | Outperform | 2026-01-30 |
| Oppenheimer | Upgrade | Outperform | 2026-01-20 |
| Morgan Stanley | Maintain | Overweight | 2026-01-13 |
| Barclays | Maintain | Overweight | 2026-01-07 |
| UBS | Maintain | Buy | 2026-01-05 |
The overall pattern shows predominantly positive to neutral ratings, with no downgrades. Oppenheimer notably upgraded its rating recently, signaling increased confidence.
Consumer Opinions
Consumers express mixed feelings about Trane Technologies plc, reflecting both strong product performance and some service challenges.
| Positive Reviews | Negative Reviews |
|---|---|
| “Efficient HVAC systems with noticeable energy savings.” | “Long wait times for customer support.” |
| “Durable products that withstand harsh conditions.” | “Installation delays caused inconvenience.” |
| “Innovative technology improving indoor air quality.” | “Higher pricing compared to competitors.” |
Overall, customers appreciate Trane’s reliable, energy-efficient products and innovation. However, service responsiveness and cost remain common pain points that the company must address.
Risk Analysis
The following table summarizes key risks facing Trane Technologies plc, highlighting their probability and potential impact:
| Category | Description | Probability | Impact |
|---|---|---|---|
| Valuation Risk | Elevated P/E (29.8) and Price-to-Book (10.1) ratios signal potential overvaluation. | Medium | High |
| Liquidity Risk | Current ratio of 1.25 and quick ratio below 1 indicate moderate short-term liquidity pressure. | Medium | Medium |
| Debt Risk | Debt-to-equity ratio of 0.54 is moderate but debt-to-assets at 21.55% remains manageable. | Low | Medium |
| Market Volatility | Beta of 1.21 suggests above-average sensitivity to market swings and economic cycles. | Medium | Medium |
| Dividend Yield Risk | Low dividend yield (0.96%) may reduce income appeal during market downturns. | Low | Low |
Trane Technologies’ most significant risk lies in its stretched valuation multiples, which may limit upside in a market correction. The firm’s solid Altman Z-Score (6.21) and Piotroski Score (8) reduce bankruptcy concerns. However, moderate liquidity metrics and market sensitivity warrant caution amid economic uncertainty.
Should You Buy Trane Technologies plc?
Trane Technologies plc appears to be a robust value creator with a durable competitive moat, evidenced by growing ROIC well above WACC. Despite a manageable leverage profile, its overall B+ rating suggests a very favorable financial health, balancing operational efficiency and prudent risk.
Strength & Efficiency Pillars
Trane Technologies plc exhibits strong operational efficiency with a net margin of 13.69% and a robust ROE of 33.93%. Its ROIC stands at 20.26%, substantially exceeding the WACC of 9.23%, confirming the company as a clear value creator. I note the growing ROIC trend (+68%) signals expanding profitability and a durable competitive advantage. The company’s favorable gross margin (36.16%) and EBIT margin (18.32%) further underscore operational strength and disciplined capital allocation.
Weaknesses and Drawbacks
While Trane’s financial health is solid with an Altman Z-Score of 6.21 in the safe zone, valuation metrics raise caution. The P/E ratio at 29.82 and P/B ratio at 10.12 appear elevated, suggesting the stock trades at a premium relative to earnings and book value. This premium valuation could limit upside and expose investors to downside risk if growth slows. Additionally, the dividend yield of 0.96% is unimpressive, which may deter income-focused investors. Leverage and liquidity ratios are neutral, not offering strong cushion against adverse market shifts.
Our Final Verdict about Trane Technologies plc
Trane Technologies presents a fundamentally strong profile with excellent profitability and a sustainable moat. Despite a bullish long-term trend and accelerating price action (+56%), recent buyer dominance dipped slightly to 48.41%, indicating neutral short-term momentum. This dynamic suggests that, while the company may appear attractive for long-term exposure, investors might consider a cautious entry or wait for clearer market signals to avoid near-term volatility.
Disclaimer: This content is for informational purposes only and does not constitute financial, investment, or other professional advice. Investing in financial markets involves a significant risk of loss, and past performance is not indicative of future results.
Additional Resources
- Trane Technologies to Present at the Barclays Industrial Select Conference – Business Wire (Feb 06, 2026)
- Guinness Asset Management LTD Takes Position in Trane Technologies plc $TT – MarketBeat (Feb 06, 2026)
- Decoding Trane Technologies PLC (TT): A Strategic SWOT Insight – GuruFocus (Feb 06, 2026)
- Trane Technologies: Upgrade To Buy On Cheaper Valuation And Better Fundamentals (NYSE:TT) – Seeking Alpha (Feb 04, 2026)
- Trane Technologies (NYSE:TT) jumps 11% this week, though earnings growth is still tracking behind five-year shareholder returns – Yahoo Finance (Feb 04, 2026)
For more information about Trane Technologies plc, please visit the official website: tranetechnologies.com