Home > Analyses > Consumer Cyclical > Tractor Supply Company
Tractor Supply Company powers the heartbeat of rural America by outfitting farms, ranches, and rural homes with essential goods. As the largest rural lifestyle retailer in the U.S., it dominates specialty retail with trusted brands and a vast store network. Known for innovation and reliable quality, Tractor Supply shapes everyday life for millions. The critical question now: does its strong market position justify its current valuation and future growth prospects?
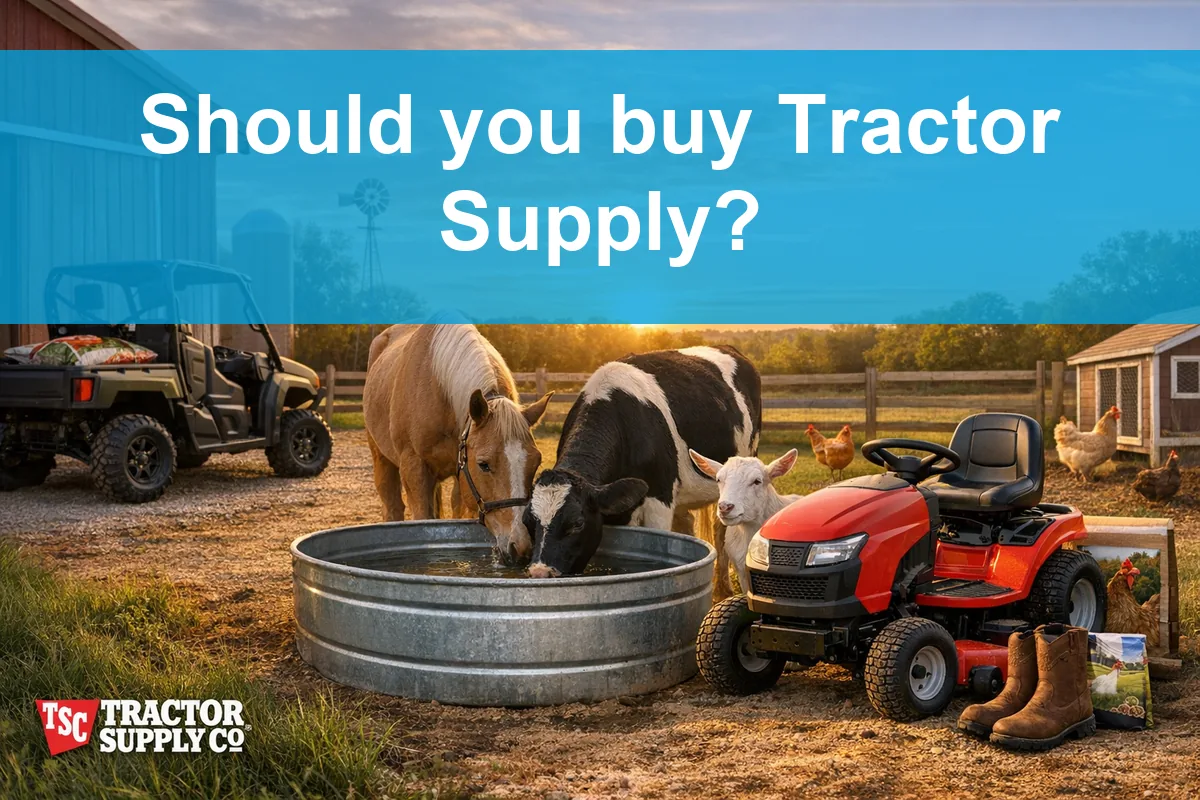
Table of contents
Business Model & Company Overview
Tractor Supply Company, founded in 1938 and headquartered in Brentwood, Tennessee, dominates the U.S. rural lifestyle retail sector. It operates an integrated ecosystem of over 2,000 stores and e-commerce platforms, serving recreational farmers and ranchers with a broad portfolio of equine, livestock, pet, hardware, and seasonal products under numerous proprietary brands. This multi-channel approach creates a cohesive customer experience centered on agricultural and rural needs.
The company’s revenue engine balances physical retail and e-commerce sales, leveraging recurring demand for essential care and maintenance products. Its footprint spans 49 states through Tractor Supply and Petsense stores, capturing diverse rural markets across the Americas. Tractor Supply’s competitive advantage lies in its deep market penetration and trusted brand portfolio, securing a durable economic moat that shapes the future of specialty retail.
Financial Performance & Fundamental Metrics
I will analyze Tractor Supply Company’s income statement, key financial ratios, and dividend payout policy to assess its core financial health and shareholder value.
Income Statement
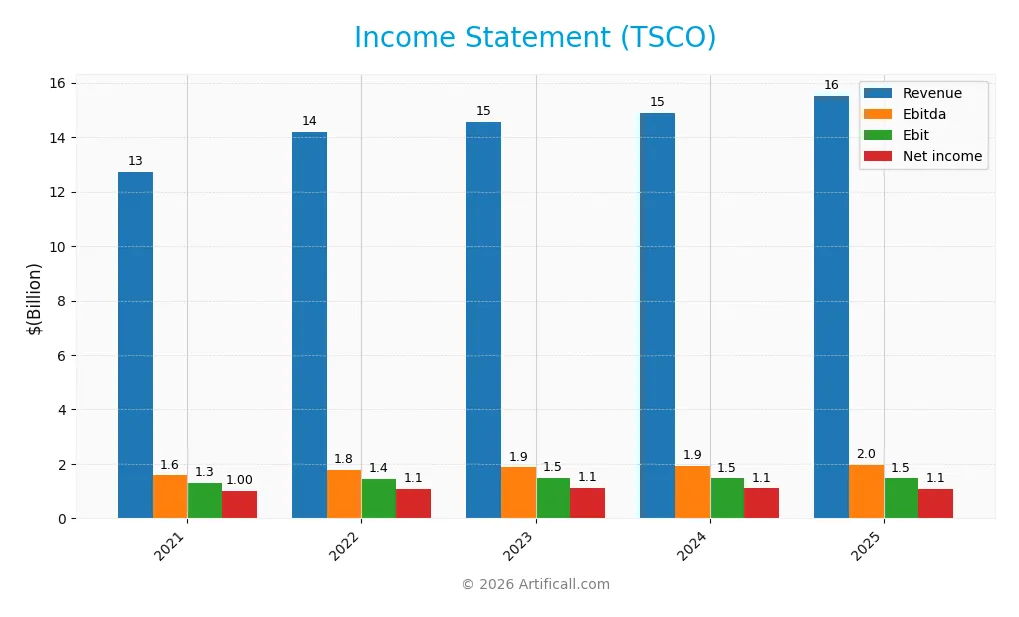
Below is Tractor Supply Company’s annual income statement summary for the last five fiscal years, showing key metrics in USD.
| 2021 | 2022 | 2023 | 2024 | 2025 | |
|---|---|---|---|---|---|
| Revenue | 12.7B | 14.2B | 14.6B | 14.9B | 15.5B |
| Cost of Revenue | 8.3B | 9.2B | 9.3B | 9.5B | 10.4B |
| Operating Expenses | 3.2B | 3.5B | 3.7B | 3.9B | 3.7B |
| Gross Profit | 4.5B | 5.0B | 5.2B | 5.4B | 5.2B |
| EBITDA | 1.6B | 1.8B | 1.9B | 1.9B | 2.0B |
| EBIT | 1.3B | 1.4B | 1.5B | 1.5B | 1.5B |
| Interest Expense | 27M | 31M | 47M | 55M | 69M |
| Net Income | 997M | 1.1B | 1.1B | 1.1B | 1.1B |
| EPS | 1.74 | 1.96 | 2.03 | 2.05 | 2.07 |
| Filing Date | 2022-02-17 | 2023-02-23 | 2024-02-23 | 2025-02-20 | 2026-02-19 |
Income Statement Evolution
From 2021 to 2025, Tractor Supply Company’s revenue rose 22% to $15.5B, reflecting steady top-line growth. Net income increased by nearly 10% to $1.1B, though net margin declined by about 10%, signaling margin pressure. Gross margin remained favorable at 33.2%, but a 4.4% drop in gross profit over the last year hints at rising costs.
Is the Income Statement Favorable?
In 2025, fundamentals appear generally favorable. The net margin of 7.1% and interest expense at 0.45% of revenue show cost control. However, slight declines in EBIT and net margin year-over-year offset revenue growth of 4.3%. Operating expenses grew in line with revenue, supporting stable EBITDA near $2B, reflecting a balanced but cautious profitability profile.
Financial Ratios
The table below summarizes key financial ratios for Tractor Supply Company (TSCO) over the past five fiscal years, providing a clear view of profitability, liquidity, leverage, and valuation metrics:
| Ratios | 2021 | 2022 | 2023 | 2024 | 2025 |
|---|---|---|---|---|---|
| Net Margin | 7.8% | 7.7% | 7.6% | 7.4% | 7.1% |
| ROE | 49.8% | 53.3% | 51.5% | 48.5% | 42.5% |
| ROIC | 16.9% | 17.2% | 15.5% | 14.5% | 13.1% |
| P/E | 27.5 | 23.0 | 21.2 | 26.6 | 24.8 |
| P/B | 13.7 | 12.3 | 10.9 | 12.9 | 10.6 |
| Current Ratio | 1.57 | 1.33 | 1.50 | 1.43 | 1.34 |
| Quick Ratio | 0.51 | 0.19 | 0.28 | 0.20 | 0.16 |
| D/E | 2.0 | 2.1 | 2.3 | 2.4 | 3.7 |
| Debt-to-Assets | 50.5% | 50.3% | 54.8% | 55.3% | 88.1% |
| Interest Coverage | 49.1x | 46.8x | 31.8x | 26.9x | 21.2x |
| Asset Turnover | 1.64 | 1.67 | 1.58 | 1.52 | 1.42 |
| Fixed Asset Turnover | 2.89 | 2.82 | 2.61 | 2.42 | 2.23 |
| Dividend Yield | 0.87% | 1.64% | 1.92% | 1.61% | 1.79% |
Evolution of Financial Ratios
Over recent years, Tractor Supply Company’s Return on Equity (ROE) has shown a generally strong and improving trend, peaking above 50% in 2023 and moderating to 42.46% in 2025. The Current Ratio gradually declined from about 1.57 in 2021 to 1.34 in 2025, indicating a slight decrease in short-term liquidity. The Debt-to-Equity ratio increased significantly, reaching 3.73 in 2025, signaling higher leverage. Profitability margins remained relatively stable, with net margins hovering around 7%.
Are the Financial Ratios Favorable?
In 2025, Tractor Supply’s ROE and Return on Invested Capital (ROIC) are favorable, comfortably exceeding its Weighted Average Cost of Capital (WACC) of 6%. The current and net margins are neutral, reflecting steady but not exceptional profitability. Liquidity ratios, particularly the quick ratio at 0.16, and leverage ratios such as debt-to-equity at 3.73 and debt-to-assets at 88.12%, are unfavorable and pose risks. Efficiency metrics like asset turnover (1.42) are favorable, while market valuation ratios show mixed signals, with a neutral P/E but an unfavorable price-to-book ratio of 10.55. Overall, the financial ratios are slightly favorable but warrant caution due to high leverage and weak liquidity.
Shareholder Return Policy
Tractor Supply Company maintains a consistent dividend payout ratio near 40-45%, with dividends per share rising steadily to $0.92 in 2025. The annual dividend yield hovers around 1.7%, supported by free cash flow coverage above 1.1x, indicating manageable distributions and ongoing share buybacks.
This balanced approach aligns with sustainable long-term shareholder value creation. The payout remains prudent relative to net income and capital expenditures, while share repurchases complement dividends without risking excessive leverage or cash flow strain.
Score analysis
The radar chart below illustrates Tractor Supply Company’s key financial metric scores for a comprehensive overview:
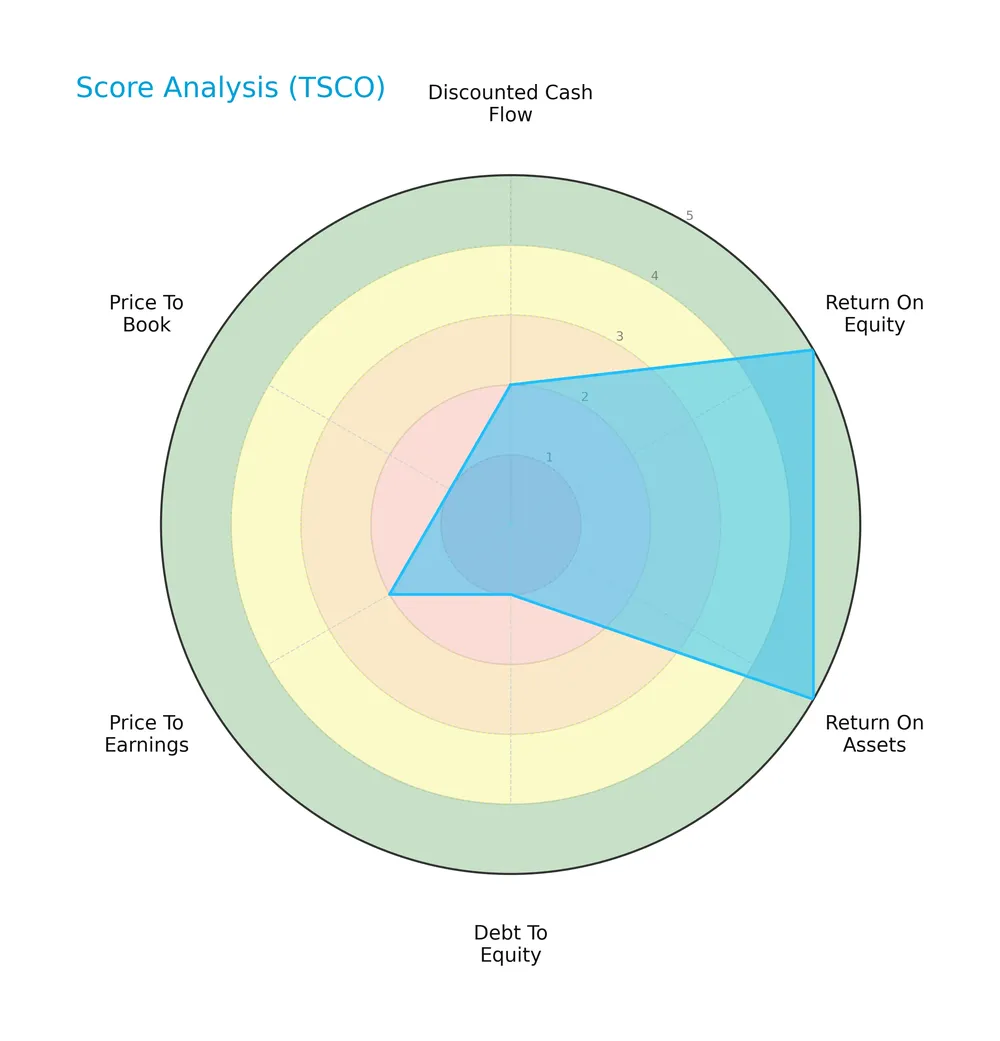
Tractor Supply posts very favorable returns on equity and assets, signaling efficient capital use. However, its debt-to-equity and valuation multiples scores are very unfavorable, suggesting leverage risks and a potentially stretched price. The overall moderate score reflects these mixed signals.
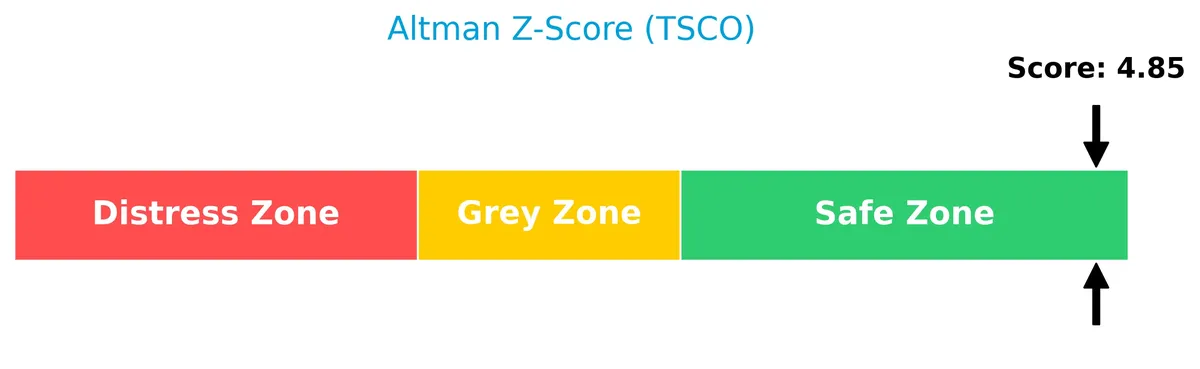
Analysis of the company’s bankruptcy risk
Tractor Supply’s Altman Z-Score firmly places it in the safe zone, indicating minimal bankruptcy risk under current financial conditions:
Is the company in good financial health?
The Piotroski diagram below shows Tractor Supply’s financial strength based on nine criteria:

With a Piotroski Score of 5, Tractor Supply demonstrates average financial health. This middling score suggests moderate strength but leaves room for improvement in profitability, leverage, or efficiency metrics.
Competitive Landscape & Sector Positioning
This section analyzes Tractor Supply Company’s strategic positioning, revenue segments, key products, and main competitors. I will assess whether Tractor Supply holds a competitive advantage compared to its peers in the specialty retail sector.
Strategic Positioning
Tractor Supply Company concentrates on rural lifestyle retail with diversified product categories, including livestock, pet, agriculture, clothing, and hardware. It operates over 2,000 stores primarily in 49 U.S. states, maintaining a focused geographic presence within the American market.
Revenue by Segment
This pie chart illustrates Tractor Supply Company’s revenue breakdown by segment for the fiscal year 2025, highlighting the distribution of sales across its key product categories.
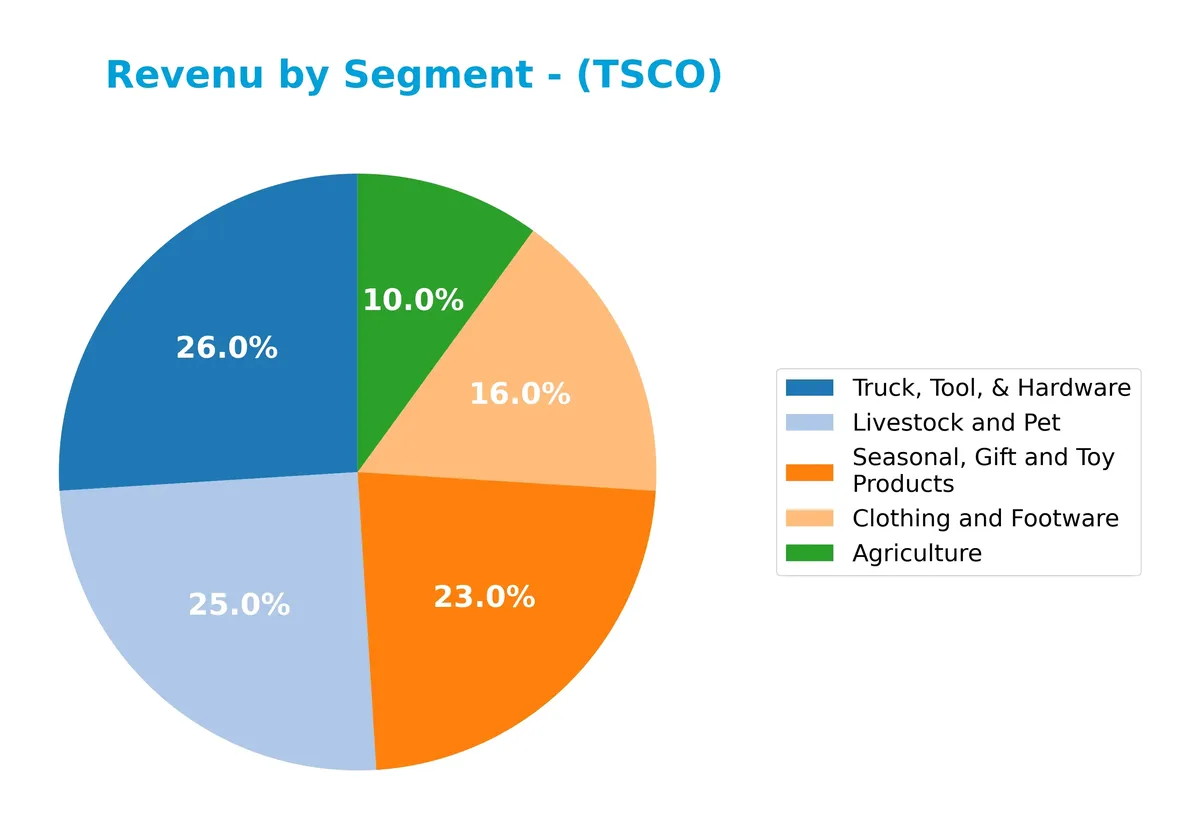
The 2025 data shows “Companion Animal” as the sole reported segment with $3.7B revenue, reflecting a strategic focus or reporting change. Comparing to 2024, segments like “Truck, Tool, & Hardware” ($3.9B) and “Seasonal, Gift and Toy Products” ($3.4B) previously drove significant sales. The concentration in Companion Animal may signal a shift or simplification, warranting caution about segment diversification risks.
Key Products & Brands
The following table summarizes Tractor Supply Company’s primary product categories and brand offerings:
| Product | Description |
|---|---|
| Livestock and Pet | Products for health, care, growth, and containment of equine, livestock, pets, and small animals. |
| Truck, Tool, & Hardware | Hardware, truck, towing, and tool products for rural and agricultural use. |
| Seasonal, Gift and Toy Products | Heating products, lawn and garden items, power equipment, gifts, toys, and seasonal merchandise. |
| Clothing and Footwear | Work and recreational clothing and footwear designed for rural lifestyle consumers. |
| Agriculture | Maintenance products and supplies for agricultural and rural applications. |
| Companion Animal | Products dedicated to companion animals, including pet food and care items. |
| Brands | Includes 4health, Producer’s Pride, American Farmworks, Red Shed, Bit & Bridle, Redstone, Blue Mountain, Retriever, C.E. Schmidt, Ridgecut, Countyline, Royal Wing, Dumor, Strive, Groundwork, Traveller, Huskee, Treeline, JobSmart, TSC Tractor Supply Co, Paws & Claws, Untamed. |
Tractor Supply Company offers a diversified product portfolio catering to rural lifestyles. Its brands cover a wide spectrum from livestock and pet care to tools and apparel, supporting recreational farmers and ranchers.
Main Competitors
This table lists the top 10 leaders by market capitalization among 10 competitors in the Specialty Retail industry:
| Competitor | Market Cap. |
|---|---|
| Amazon.com, Inc. | 2.42T |
| Alibaba Group Holding Limited | 340B |
| PDD Holdings Inc. | 159B |
| MercadoLibre, Inc. | 102B |
| eBay Inc. | 39.4B |
| Ulta Beauty, Inc. | 27.8B |
| Tractor Supply Company | 26.9B |
| Williams-Sonoma, Inc. | 23.0B |
| Genuine Parts Company | 17.2B |
| Best Buy Co., Inc. | 14.5B |
Tractor Supply Company ranks 7th among these competitors. Its market cap is just 1.16% of Amazon’s, the sector leader. The company trades below both the average top 10 market cap of 317B and the sector median of 33.6B. The gap to the next competitor above, Ulta Beauty, is narrow at about 0.65%, indicating close competition in this mid-tier range.
Comparisons with competitors
Check out how we compare the company to its competitors:
Does TSCO have a competitive advantage?
Tractor Supply Company exhibits a slight competitive advantage, creating value with a ROIC well above its WACC. However, its profitability shows a declining trend, signaling caution.
Looking ahead, TSCO’s broad product portfolio and extensive store network across 49 states provide opportunities for growth in rural and specialty retail markets. Expansion of its Petsense brand could further enhance market reach.
SWOT Analysis
This analysis highlights Tractor Supply Company’s key internal and external factors shaping its strategic position.
Strengths
- strong ROE of 42.5%
- favorable ROIC above WACC indicating value creation
- extensive retail network with 2,194 stores
Weaknesses
- declining ROIC trend signals weakening profitability
- high debt-to-equity ratio at 3.73 increases financial risk
- unfavorable quick ratio at 0.16 reflects liquidity concerns
Opportunities
- growing rural lifestyle market and expanding e-commerce potential
- potential to improve operational efficiency and cost control
- brand portfolio diversification including Petsense
Threats
- rising competition in specialty retail sector
- margin pressure from supply chain and inflation costs
- economic cycles impacting consumer discretionary spending
Tractor Supply has solid profitability and scale but faces margin pressures and leverage risks. The company must focus on stabilizing profitability and managing debt to capitalize on growth opportunities and defend against competitive threats.
Stock Price Action Analysis
The following weekly chart displays Tractor Supply Company’s stock price movement over the last 100 weeks, highlighting key highs and lows:
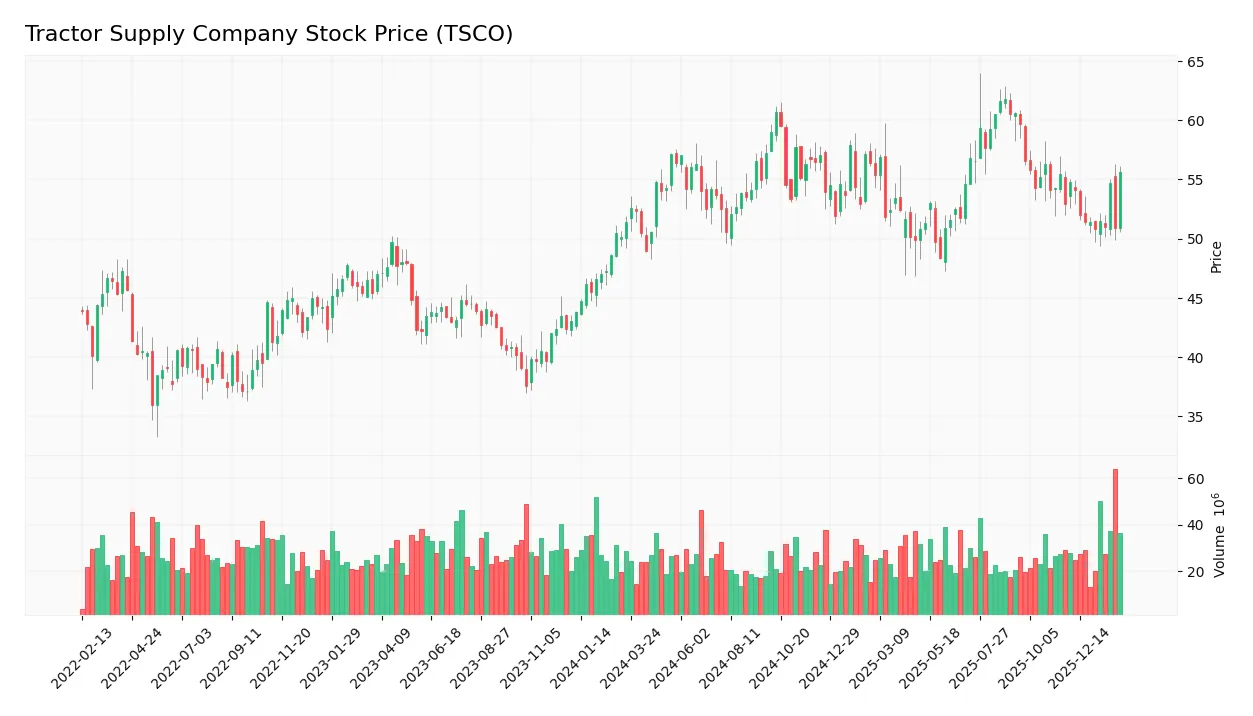
Trend Analysis
Over the past 12 months, TSCO’s stock price increased by 1.18%, indicating a bullish trend with accelerating momentum. The price ranged between 48.4 and 61.76, with a volatility measure of 2.95%. However, in the recent period from December 2025 to February 2026, the price declined by 2.07%, reflecting a short-term bearish trend despite a slight upward slope of 0.19.
Volume Analysis
In the last three months, trading volume has increased but shows seller dominance, with sellers accounting for 67% of activity. This suggests cautious investor sentiment and potential profit-taking pressure despite the overall rising volume trend.
Target Prices
Analysts set a consensus target price signaling moderate upside potential for Tractor Supply Company (TSCO).
| Target Low | Target High | Consensus |
|---|---|---|
| 50 | 67 | 59 |
The target range reflects cautious optimism, with analysts expecting TSCO to trade between $50 and $67. The $59 consensus suggests steady growth relative to current levels.

Don’t Let Luck Decide Your Entry Point
Optimize your entry points with our advanced ProRealTime indicators. You’ll get efficient buy signals with precise price targets for maximum performance. Start outperforming now!
Analyst & Consumer Opinions
This section examines Tractor Supply Company’s recent analyst ratings alongside consumer feedback to provide balanced insights.
Stock Grades
The latest analyst grades for Tractor Supply Company reflect a steady consensus across major firms:
| Grading Company | Action | New Grade | Date |
|---|---|---|---|
| Argus Research | Maintain | Buy | 2026-02-02 |
| JP Morgan | Maintain | Neutral | 2026-01-30 |
| Mizuho | Maintain | Outperform | 2026-01-30 |
| Morgan Stanley | Maintain | Equal Weight | 2026-01-30 |
| Jefferies | Maintain | Buy | 2026-01-30 |
| Telsey Advisory Group | Maintain | Outperform | 2026-01-30 |
| Piper Sandler | Maintain | Overweight | 2026-01-30 |
| DA Davidson | Maintain | Buy | 2026-01-30 |
| TD Cowen | Maintain | Hold | 2026-01-30 |
| Goldman Sachs | Maintain | Buy | 2026-01-30 |
Most analysts maintain positive ratings, with “Buy” and “Outperform” prevailing. A few offer cautious neutrality or hold positions, indicating measured confidence in the stock’s prospects.
Consumer Opinions
Consumers express a strong connection to Tractor Supply Company, praising its product range while noting areas needing improvement.
| Positive Reviews | Negative Reviews |
|---|---|
| Wide selection of farming and ranch supplies. | Some locations suffer from stock shortages. |
| Friendly and knowledgeable staff assistance. | Long checkout lines during peak hours. |
| Competitive prices on quality outdoor equipment. | Limited online shopping options. |
Overall, customers appreciate Tractor Supply’s product variety and helpful staff. However, inventory management and online convenience remain key challenges, affecting the shopping experience across multiple locations.
Risk Analysis
Below is a summary table outlining key risks Tractor Supply Company faces, including likelihood and potential impact:
| Category | Description | Probability | Impact |
|---|---|---|---|
| Leverage Risk | High debt-to-assets ratio (88.12%) increases financial risk. | High | High |
| Liquidity Risk | Low quick ratio (0.16) signals weak short-term liquidity buffer. | Medium | Medium |
| Valuation Risk | Elevated price-to-book ratio (10.55) suggests potential overvaluation. | Medium | Medium |
| Market Risk | Beta of 0.726 indicates moderate sensitivity to market swings. | Medium | Medium |
| Operational Risk | Dependence on rural economy and consumer discretionary spending. | Medium | Medium |
The most pressing risk is Tractor Supply’s high leverage, which raises concerns amid tightening credit markets. Liquidity constraints add vulnerability, despite solid interest coverage. Valuation multiples remain stretched compared to retail benchmarks, warranting caution.
Should You Buy Tractor Supply Company?
Tractor Supply Company appears to be a moderately profitable business with a slightly favorable moat, indicating some value creation despite declining returns. Its leverage profile is substantial, posing risk, while the overall B rating suggests a cautiously positive financial health outlook.
Strength & Efficiency Pillars
Tractor Supply Company demonstrates solid operational efficiency with a net margin of 7.06% and a robust return on equity of 42.46%. Its return on invested capital of 13.11% comfortably exceeds its weighted average cost of capital at 6%, confirming the company as a clear value creator. The favorable interest coverage ratio of 21.22 supports its ability to service debt. Despite a slight decline in ROIC trend, the firm maintains strong asset turnover at 1.42, underscoring efficient use of capital.
Weaknesses and Drawbacks
The company’s valuation metrics raise concerns. A price-to-book ratio of 10.55 is notably elevated, suggesting the stock trades at a substantial premium to book value. Debt-to-equity stands at 3.73, flagging high leverage risk, especially when combined with a weak quick ratio of 0.16, which signals limited liquidity. Recent seller dominance at 33.03% amid a modest price decline of -2.07% indicates short-term market pressure that may reflect investor caution.
Our Final Verdict about Tractor Supply Company
Tractor Supply Company’s financial health is fundamentally sound, supported by a safe-zone Altman Z-Score of 4.93, which alleviates solvency concerns. Despite a bullish long-term trend, recent seller dominance suggests caution. The profile might appear attractive for long-term exposure but warrants a wait-and-see approach for a better entry point due to near-term market pressures and elevated leverage risks.
Disclaimer: This content is for informational purposes only and does not constitute financial, investment, or other professional advice. Investing in financial markets involves a significant risk of loss, and past performance is not indicative of future results.
Additional Resources
- Tractor Supply Company $TSCO Position Lowered by Dearborn Partners LLC – MarketBeat (Feb 21, 2026)
- TRACTOR SUPPLY CO /DE/ SEC 10-K Report – TradingView (Feb 19, 2026)
- Bear of the Day: Tractor Supply (TSCO) – Zacks Investment Research (Feb 17, 2026)
- TD Cowen Flags Margin and Comparable Sales Pressure at Tractor Supply (TSCO) – Insider Monkey (Feb 20, 2026)
- Decoding Tractor Supply Co (TSCO): A Strategic SWOT Insight – GuruFocus (Feb 20, 2026)
For more information about Tractor Supply Company, please visit the official website: tractorsupply.com