Home > Analyses > Communication Services > TKO Group Holdings, Inc.
TKO Group Holdings, Inc. electrifies the world of sports and entertainment, delivering high-impact live events and rich multimedia content to millions globally. As a powerhouse in media production, sponsorships, and consumer product licensing, TKO drives cultural trends and fan engagement across 170 countries. Its innovative approach reshapes how audiences experience entertainment. The key question: Does TKO’s current financial strength and market position justify its premium valuation and growth ambitions?

Table of contents
Business Model & Company Overview
TKO Group Holdings, Inc. is a major player in the entertainment industry, headquartered in New York City. Founded recently with a focused vision, it operates as a cohesive ecosystem spanning sports and entertainment. Its offerings include live events, television programs, and digital content across broadcast, pay TV, and streaming platforms in 170 countries. This broad reach supports its mission to engage audiences worldwide through multiple content formats and consumer products.
TKO’s revenue engine balances media and content production with live events, sponsorships, and consumer product licensing. It monetizes through merchandise, digital goods, advertising, and ticket sales, leveraging a strategic global presence in the Americas, Europe, and Asia. The company’s ability to integrate diverse segments creates a strong economic moat, positioning it as a key shaper of the entertainment landscape’s future.
Financial Performance & Fundamental Metrics
I analyze TKO Group Holdings, Inc.’s income statement, key financial ratios, and dividend payout policy to evaluate its core financial health and shareholder returns.
Income Statement
The table below presents TKO Group Holdings, Inc.’s key income statement figures for fiscal years 2021 through 2025, showing revenue trends and profitability metrics.

| 2021 | 2022 | 2023 | 2024 | 2025 | |
|---|---|---|---|---|---|
| Revenue | 1.10B | 1.14B | 1.67B | 2.80B | 4.74B |
| Cost of Revenue | 649M | 386M | 679M | 1.29B | 1.81B |
| Operating Expenses | 190M | 209M | 410M | 737M | 1.58B |
| Gross Profit | 446M | 755M | 996M | 1.51B | -2.03B |
| EBITDA | 341M | 603M | 611M | 676M | 889M |
| EBIT | 263M | 543M | 446M | 283M | 0 |
| Interest Expense | 34M | 140M | 239M | 249M | 478M |
| Net Income | 177M | 387M | -35M | 9M | 533M |
| EPS | 3.27 | 4.66 | -0.43 | 0.12 | 2.39 |
| Filing Date | 2021-12-31 | 2022-12-31 | 2024-02-27 | 2025-02-26 | 2026-02-25 |
Income Statement Evolution
TKO’s revenue surged 68.9% from 2024 to 2025, continuing a strong multi-year growth trend of 332%. However, gross profit declined sharply, turning negative in 2025 with a -43% gross margin. Operating expenses rose proportionally with revenue, eroding EBIT to zero in 2025. Despite this, net income improved significantly, reflecting a 3254% rise in net margin year-over-year.
Is the Income Statement Favorable?
In 2025, TKO posted $4.74B revenue and $533M net income, yielding an 11.3% net margin, which is favorable compared to industry norms. The zero EBIT margin and negative gross margin are red flags, signaling weak core profitability. Favorable interest expense and net margin growth partly offset these concerns. Overall, fundamentals appear neutral, balancing strong top-line gains against margin pressures.
Financial Ratios
The table below summarizes key financial ratios for TKO Group Holdings, Inc. over the past five fiscal years, highlighting profitability, liquidity, leverage, and valuation metrics:
| Ratios | 2021 | 2022 | 2023 | 2024 | 2025 |
|---|---|---|---|---|---|
| Net Margin | 16% | 34% | -2% | 0.3% | 11% |
| ROE | 14% | 68% | -1% | 0.2% | 14% |
| ROIC | 5% | 16% | 5% | 1% | 5% |
| P/E | 23.1 | 14.7 | -191.8 | 1228.7 | 30.8 |
| P/B | 3.29 | 10.0 | 1.64 | 2.83 | 4.38 |
| Current Ratio | 5.06 | 1.17 | 1.04 | 1.30 | 1.26 |
| Quick Ratio | 5.06 | 1.17 | 1.04 | 1.30 | 1.26 |
| D/E | 2.28 | 4.89 | 0.74 | 0.74 | 1.09 |
| Debt-to-Assets | 66% | 78% | 24% | 24% | 26% |
| Interest Coverage | 7.62 | 3.91 | 2.45 | 3.11 | -1.75 |
| Asset Turnover | 0.25 | 0.32 | 0.13 | 0.22 | 0.31 |
| Fixed Asset Turnover | 5.67 | 5.75 | 1.86 | 3.48 | 5.11 |
| Dividend Yield | 0.9% | 19.2% | 4.4% | 0.6% | 1.1% |
Evolution of Financial Ratios
TKO’s Return on Equity (ROE) has fluctuated, peaking around 68% in 2022 before settling near 14% in 2025. The Current Ratio remained relatively stable, hovering between 1.04 and 1.30, indicating consistent liquidity. Debt-to-Equity Ratio rose sharply in 2022 to nearly 4.9, then decreased to about 1.09 by 2025, reflecting shifts in leverage and capital structure stability.
Are the Financial Ratios Favorable?
In 2025, TKO shows a favorable net profit margin of 11.25% but a neutral ROE of 14.26%, slightly above its weighted average cost of capital (4.47%). Liquidity measures include a neutral current ratio of 1.26 and a favorable quick ratio. However, leverage appears unfavorable with a Debt-to-Equity ratio of 1.09 and negative interest coverage. Asset turnover is weak at 0.31, while fixed asset turnover remains favorable. Overall, the ratios present a neutral financial outlook.
Shareholder Return Policy
TKO Group Holdings, Inc. maintains a dividend payout ratio near 35% in 2025 with a dividend per share of 2.36 USD and a yield of 1.13%. The company supports dividends through free cash flow and engages in share buybacks, balancing distributions with capital allocation.
This approach reflects a moderate yield relative to the S&P 500 average, suggesting cautious distribution aligned with sustainable shareholder value. Risks include potential pressure on cash flow if earnings fluctuate, but current free cash flow coverage supports ongoing returns without excessive repurchases.
Score analysis
Here is an overview of TKO Group Holdings, Inc.’s key financial scores for investor evaluation:

TKO’s discounted cash flow score is favorable at 4, while return on equity and assets both rank moderate at 3. Debt-to-equity is unfavorable at 2, and valuation metrics price-to-earnings and price-to-book score very unfavorable at 1 each. Overall, the scores indicate mixed financial signals.
Analysis of the company’s bankruptcy risk
TKO’s Altman Z-Score places it in the grey zone, indicating moderate risk of bankruptcy and financial caution is advised:

Is the company in good financial health?
The Piotroski Score diagram reflects TKO’s financial strength with an average rating:

A score of 6 suggests TKO has reasonable financial health, though it is not yet among the strongest companies in terms of profitability, leverage, and efficiency.
Competitive Landscape & Sector Positioning
This analysis explores TKO Group Holdings, Inc.’s strategic positioning within the Entertainment sector. It covers revenue breakdown, key products, and main competitors. I will examine whether TKO holds a competitive advantage over its peers.
Strategic Positioning
TKO Group Holdings maintains a diversified portfolio across Media and Content, Live Events, Sponsorships, and Consumer Products Licensing. Its geographic revenue concentration is heavily weighted toward North America, with notable growth in EMEA and Asia Pacific regions from 2023 to 2025.
Key Products & Brands
The table below outlines TKO Group Holdings, Inc.’s main products and brand segments:
| Product | Description |
|---|---|
| Media and Content | Produces live events, TV programs, and video content across broadcast, pay TV, streaming, and digital platforms in 170 countries. |
| Live Events | Organizes and hosts live sports and entertainment events worldwide. |
| Sponsorships | Manages corporate sponsorships, in-venue and in-broadcast advertising, content integration, and digital impressions. |
| Consumer Products Licensing | Merchandises video games, apparel, equipment, trading cards, memorabilia, digital goods, toys, and sells travel packages and tickets. |
TKO Group Holdings operates a diversified portfolio in entertainment, spanning media content, live sports, sponsorship advertising, and licensed consumer products. This mix supports broad global reach and multiple revenue streams.
Main Competitors
There are 8 main competitors in the Communication Services sector; below is a list of the top 10 leaders by market capitalization:
| Competitor | Market Cap. |
|---|---|
| Netflix, Inc. | 385B |
| Warner Bros. Discovery, Inc. | 71B |
| Live Nation Entertainment, Inc. | 34B |
| Fox Corporation | 33B |
| TKO Group Holdings, Inc. | 17B |
| News Corporation | 16.6B |
| News Corporation | 14.8B |
| Paramount Skydance Corporation Class B Common Stock | 14.1B |
TKO Group Holdings ranks 5th among its 8 competitors. Its market cap stands at just 4.42% of the leader, Netflix. The company is below both the average market cap of the top 10 (73B) and the sector median (25B). TKO holds a significant 95.67% gap from its closest competitor above, highlighting a notable scale difference.
Does TKO have a competitive advantage?
TKO does not currently present a clear competitive advantage, as its return on invested capital (ROIC) remains below its cost of capital (WACC). However, its ROIC trend is positive, indicating improving profitability despite value shedding.
The company’s expanding footprint across North America, EMEA, and Asia Pacific supports growth opportunities. Continued development of live events, digital content, and sponsorships could enhance market position and future competitive strength.
Comparisons with competitors
Check out how we compare the company to its competitors:
SWOT Analysis
This analysis highlights TKO Group Holdings’ key internal and external factors influencing its strategic direction.
Strengths
- Strong revenue growth of 68.9% in 2025
- Diverse global footprint across 170 countries
- Favorable net margin at 11.25%
Weaknesses
- Negative gross margin at -43% undermines profitability
- High debt-to-equity ratio at 1.09 signals leverage risk
- Unfavorable PE and PB ratios imply overvaluation
Opportunities
- Expanding markets in Asia Pacific and EMEA with rapid revenue increases
- Growing digital and streaming content demand
- Cross-segment synergies in media, live events, and licensing
Threats
- Intense competition in entertainment and media sectors
- Economic sensitivity affecting discretionary spending
- Regulatory risks in diverse international markets
TKO’s robust top-line growth and diversified operations position it for expansion, but structural profitability issues and elevated leverage require cautious capital allocation. The company must leverage growth opportunities while addressing margin weaknesses to build sustainable competitive advantage.
Stock Price Action Analysis
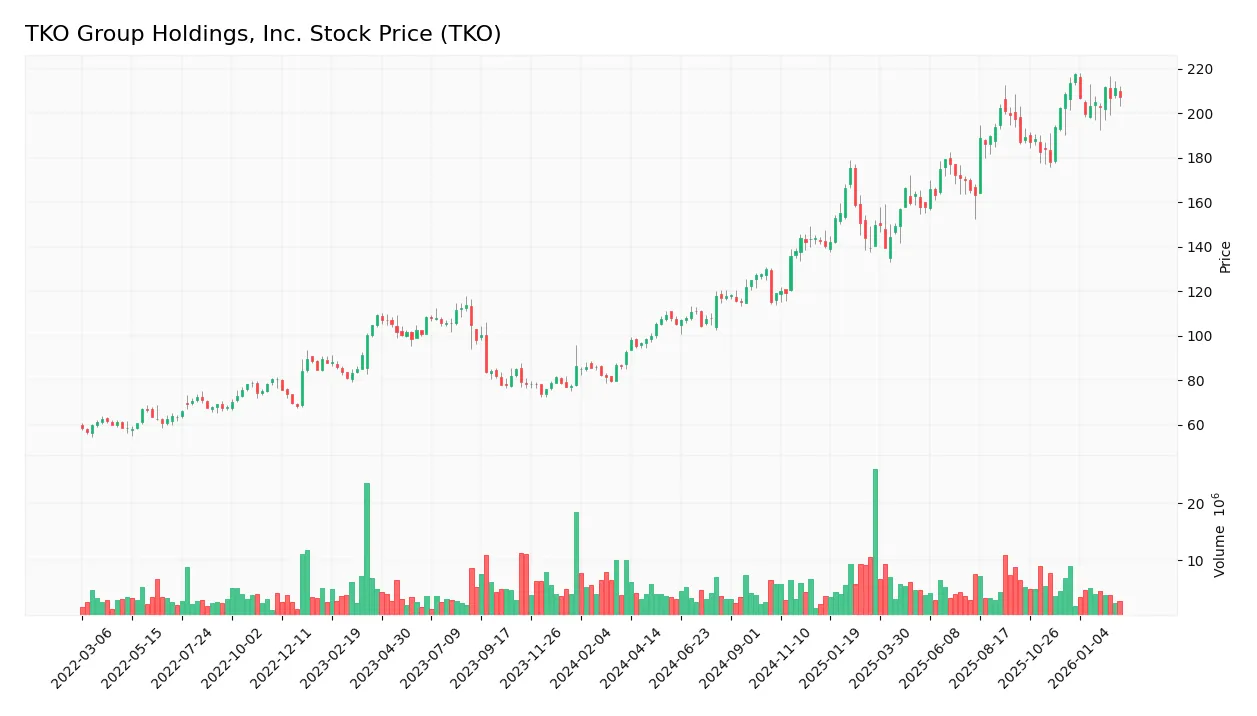
The weekly stock chart below illustrates TKO Group Holdings, Inc.’s price movements over the past 12 months, highlighting key highs, lows, and recent fluctuations:
Trend Analysis
TKO’s stock price rose 124% over the past year, indicating a strong bullish trend. The trend shows deceleration despite a high volatility level (std. dev. 35.8). The highest price reached 217.44, and the lowest was 92.51. Over the recent three months, the price declined marginally by 0.58%, signaling a neutral short-term trend.
Volume Analysis
Trading volumes totaled 653M shares with buyer dominance at 56.6%. Recent three-month data shows buyer-driven activity with 63.1% buyer volume. However, volume is decreasing, suggesting waning market participation despite continued buying interest. This may indicate cautious investor sentiment amid recent price stabilization.
Target Prices
Analysts set a strong target consensus for TKO Group Holdings, Inc., reflecting robust confidence in its outlook.
| Target Low | Target High | Consensus |
|---|---|---|
| 210 | 251 | 233.9 |
The target range from 210 to 251 suggests a bullish sentiment, with a consensus price near 234 indicating expected upside potential.
Analyst & Consumer Opinions
This section examines analyst ratings and consumer feedback to provide a balanced view of TKO Group Holdings, Inc.’s market perception.

Don’t Let Luck Decide Your Entry Point
Optimize your entry points with our advanced ProRealTime indicators. You’ll get efficient buy signals with precise price targets for maximum performance. Start outperforming now!
Stock Grades
Here are the latest verified analyst grades for TKO Group Holdings, Inc. from respected financial firms:
| Grading Company | Action | New Grade | Date |
|---|---|---|---|
| BTIG | Maintain | Buy | 2026-02-19 |
| Bernstein | Maintain | Outperform | 2026-02-19 |
| JP Morgan | Maintain | Overweight | 2026-01-21 |
| BTIG | Maintain | Buy | 2025-12-31 |
| Susquehanna | Maintain | Positive | 2025-12-10 |
| TD Cowen | Maintain | Buy | 2025-12-08 |
| JP Morgan | Maintain | Overweight | 2025-12-02 |
| BTIG | Maintain | Buy | 2025-11-18 |
| Seaport Global | Upgrade | Buy | 2025-10-15 |
| BTIG | Maintain | Buy | 2025-10-10 |
The consensus reflects strong conviction with the majority maintaining Buy or equivalent ratings. Notably, Seaport Global upgraded its stance recently, indicating growing confidence in the stock’s prospects.
Consumer Opinions
Consumer sentiment around TKO Group Holdings, Inc. reveals a mix of enthusiasm and concern, reflecting the company’s evolving market position.
| Positive Reviews | Negative Reviews |
|---|---|
| “Innovative product lineup keeps me loyal.” | “Customer service response times are slow.” |
| “Competitive pricing offers great value.” | “Website navigation feels clunky and outdated.” |
| “Reliable delivery and quality packaging.” | “Limited variety in certain product categories.” |
Overall, customers praise TKO’s innovation and value but frequently cite service delays and limited product range as areas needing improvement. This feedback highlights opportunities for operational refinement to boost satisfaction.
Risk Analysis
The following table outlines key risks facing TKO Group Holdings, Inc., highlighting their likelihood and potential impact:
| Category | Description | Probability | Impact |
|---|---|---|---|
| Financial Leverage | High debt-to-equity ratio (1.09) raises refinancing and solvency concerns. | Medium | High |
| Profitability | Moderate ROIC (5.34%) barely exceeds WACC (4.47%), limiting value creation. | Medium | Medium |
| Market Valuation | Elevated P/E (30.75) and P/B (4.38) suggest overvaluation risk. | High | Medium |
| Liquidity | Current ratio of 1.26 indicates just adequate short-term coverage. | Low | Medium |
| Earnings Quality | Negative interest coverage signals difficulty servicing debt obligations. | High | High |
| Bankruptcy Risk | Altman Z-score in grey zone (2.05) indicates moderate bankruptcy risk. | Medium | High |
| Competitive Risk | Highly competitive entertainment sector may pressure margins. | Medium | Medium |
TKO’s most likely and impactful risks stem from its elevated leverage and weak interest coverage. The grey-zone Altman Z-score confirms moderate financial distress risk. Market valuation is stretched, exposing the stock to downside if growth slows. Investors should watch debt management closely.
Should You Buy TKO Group Holdings, Inc.?
TKO appears to be improving operational efficiency with a slightly favorable moat due to growing ROIC, yet it is shedding value relative to WACC. Despite manageable leverage concerns, the overall B- rating suggests moderate value creation with notable risks in valuation metrics.
Strength & Efficiency Pillars
TKO Group Holdings posts a net margin of 11.25%, signaling operational profitability despite mixed results elsewhere. Its return on invested capital (ROIC) stands at 5.34%, modestly above its weighted average cost of capital (WACC) of 4.47%, indicating slight value creation. Return on equity (ROE) of 14.26% is moderate but stable. The company shows improving profitability trends, though its overall competitive moat remains only slightly favorable as it continues to grow ROIC without a clear advantage.
Weaknesses and Drawbacks
TKO operates within the Altman Z-Score grey zone at 2.05, indicating moderate solvency risk that warrants caution. The firm faces significant valuation pressure, with a price-to-earnings ratio of 30.75 and price-to-book of 4.38, both unfavorable and suggesting a stretched premium. Its debt-to-equity ratio of 1.09 flags elevated leverage, increasing financial risk. Interest coverage is negative, a red flag for debt servicing capability. Additionally, an unfavorable gross margin of -42.97% raises concerns about cost structure efficiency.
Our Final Verdict about TKO Group Holdings, Inc.
TKO’s profile could appeal to investors seeking growth with moderate risk tolerance. Despite a bullish long-term trend and buyer dominance in recent months, valuation and leverage concerns advise a cautious stance. The moderate solvency risk and mixed profitability suggest the stock might appear attractive but may require a wait-and-see approach for a more favorable entry point.
Disclaimer: This content is for informational purposes only and does not constitute financial, investment, or other professional advice. Investing in financial markets involves a significant risk of loss, and past performance is not indicative of future results.
Additional Resources
- TD Asset Management Inc Has $132.60 Million Position in TKO Group Holdings, Inc. $TKO – MarketBeat (Feb 26, 2026)
- TKO Group Holdings (TKO) Reports Q4 Loss, Beats Revenue Estimates – Yahoo Finance (Feb 26, 2026)
- Earnings call transcript: TKO Group misses Q4 2025 EPS forecast, stock dips – Investing.com (Feb 25, 2026)
- TKO Group Holdings (TKO) Reports Q4 Loss, Beats Revenue Estimates – sharewise.com (Feb 26, 2026)
- TKO Group Holdings Inc (TKO) Misses Q4 2025 Earnings Estimates — EPS $0.47 vs $0.51 Expected – AlphaStreet News (Feb 24, 2026)
For more information about TKO Group Holdings, Inc., please visit the official website: tkogrp.com