Home > Analyses > Healthcare > Thermo Fisher Scientific Inc.
Thermo Fisher Scientific transforms how science advances healthcare worldwide. It delivers cutting-edge instruments and solutions that fuel drug discovery, diagnostics, and biopharma production. Renowned for innovation and quality, it commands leadership across life sciences and clinical markets. As healthcare demands evolve, I question whether Thermo Fisher’s strong fundamentals still justify its premium valuation and growth outlook in a competitive, fast-changing sector.

Table of contents
Business Model & Company Overview
Thermo Fisher Scientific Inc., founded in 1956 and headquartered in Waltham, MA, commands a dominant position in the medical diagnostics and research industry. It operates a cohesive ecosystem spanning life sciences solutions, analytical instruments, specialty diagnostics, and laboratory products. This integrated approach serves pharmaceutical, biotechnology, agricultural, healthcare, academic, and government markets, reflecting a broad yet focused mission to advance scientific discovery and clinical care worldwide.
The company’s revenue engine blends hardware, consumables, software, and biopharma services, creating recurring value across global markets in the Americas, Europe, and Asia-Pacific. Its diversified portfolio under brands like Thermo Scientific and Applied Biosystems supports long-term growth through innovation and customer loyalty. Thermo Fisher’s economic moat lies in its extensive product range and deep integration across the life sciences value chain, shaping the future of medical research and diagnostics.
Financial Performance & Fundamental Metrics
I analyze Thermo Fisher Scientific’s income statement, key financial ratios, and dividend payout policy to assess its core financial health and shareholder value.
Income Statement
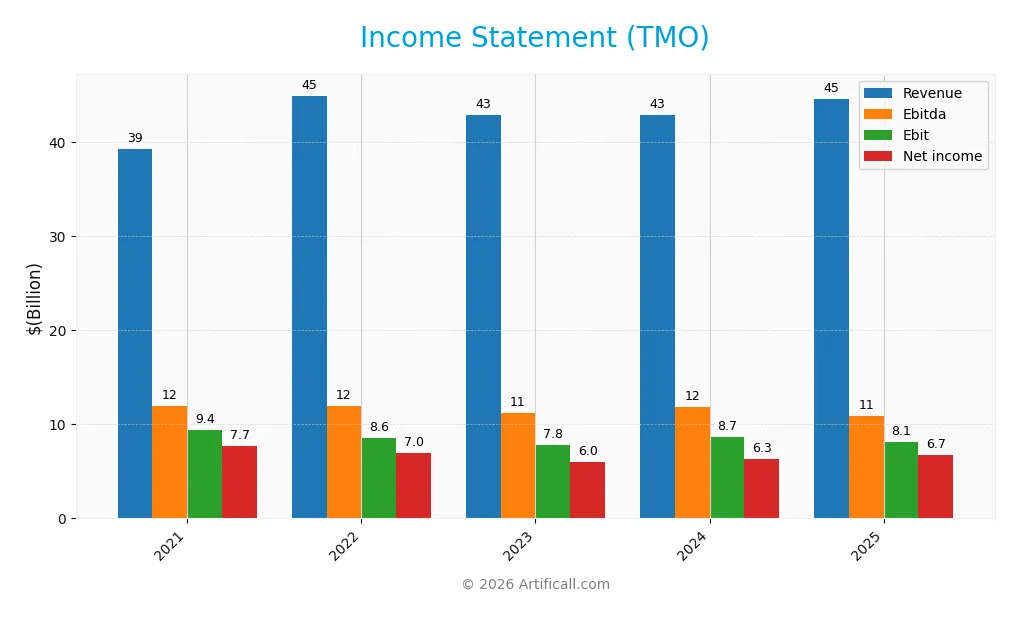
The table below presents Thermo Fisher Scientific Inc.’s key income statement figures for fiscal years 2021 through 2025, reflecting revenue, expenses, profits, and earnings per share.
| 2021 | 2022 | 2023 | 2024 | 2025 | |
|---|---|---|---|---|---|
| Revenue | 39.2B | 44.9B | 42.9B | 42.9B | 44.6B |
| Cost of Revenue | 19.6B | 25.9B | 25.7B | 25.2B | 27.8B |
| Operating Expenses | 9.3B | 10.5B | 9.7B | 10.1B | 8.7B |
| Gross Profit | 19.6B | 19.0B | 17.2B | 17.7B | 16.8B |
| EBITDA | 11.9B | 11.9B | 11.2B | 11.8B | 10.9B |
| EBIT | 9.4B | 8.6B | 7.8B | 8.7B | 8.1B |
| Interest Expense | 536M | 726M | 1.5B | 1.7B | 1.4B |
| Net Income | 7.7B | 7.0B | 6.0B | 6.3B | 6.7B |
| EPS | 19.61 | 17.73 | 15.53 | 16.58 | 17.77 |
| Filing Date | 2022-02-24 | 2023-02-23 | 2024-02-22 | 2025-02-20 | 2026-02-26 |
Income Statement Evolution
From 2021 to 2025, Thermo Fisher’s revenue rose 14% overall, showing steady top-line growth. Net income, however, declined nearly 13%, reflecting pressure on profitability. Gross margin contracted, while operating expenses grew in line with revenue. EBIT and net margins softened, indicating a mix of cost and efficiency challenges despite revenue expansion.
Is the Income Statement Favorable?
In 2025, revenue increased 3.9% year-on-year, but gross profit fell 5.4%, signaling margin compression. Operating expenses grew proportionally with revenue, helping contain cost pressures. EBIT declined 6.7%, yet net margin edged slightly higher by 2.3%, supported by favorable interest expense and tax rates. Overall, fundamentals appear favorable, balancing growth with margin resilience amid headwinds.
Financial Ratios
The table below summarizes key financial ratios for Thermo Fisher Scientific Inc. over the last five fiscal years, providing insight into profitability, liquidity, leverage, and valuation:
| Ratios | 2021 | 2022 | 2023 | 2024 | 2025 |
|---|---|---|---|---|---|
| Net Margin | 19.7% | 15.5% | 14.0% | 14.8% | 15.1% |
| ROE | 18.9% | 15.8% | 12.8% | 12.8% | 12.6% |
| ROIC | 10.7% | 9.0% | 8.0% | 8.0% | 7.6% |
| P/E | 34.0 | 31.1 | 34.2 | 31.4 | 32.3 |
| P/B | 6.44 | 4.91 | 4.38 | 4.01 | 4.08 |
| Current Ratio | 1.50 | 1.48 | 1.75 | 1.66 | 1.89 |
| Quick Ratio | 1.12 | 1.15 | 1.39 | 1.29 | 1.53 |
| D/E | 0.89 | 0.82 | 0.78 | 0.66 | 0.74 |
| Debt-to-Assets | 38.2% | 37.1% | 36.9% | 33.7% | 35.7% |
| Interest Coverage | 19.3 | 11.7 | 5.0 | 4.6 | 5.7 |
| Asset Turnover | 0.41 | 0.46 | 0.43 | 0.44 | 0.40 |
| Fixed Asset Turnover | 3.98 | 4.13 | 3.89 | 3.97 | 4.22 |
| Dividend Yield | 0.15% | 0.21% | 0.26% | 0.29% | 0.29% |
Evolution of Financial Ratios
Thermo Fisher’s Return on Equity (ROE) showed a gradual decline from 18.9% in 2021 to 12.6% in 2025, reflecting a slowdown in profitability growth. The Current Ratio steadily improved from 1.50 to 1.89, indicating stronger liquidity. Debt-to-Equity Ratio decreased from 0.89 to 0.74, suggesting moderate deleveraging and stable capital structure.
Are the Financial Ratios Fovorable?
In 2025, profitability ratios like net margin (15.1%) remain favorable, but ROE (12.6%) and ROIC (7.6%) are neutral, close to the WACC (7.25%). Liquidity is strong with current and quick ratios well above 1.5. Leverage ratios are neutral, with debt-to-equity at 0.74. Market valuation metrics such as P/E (32.3) and P/B (4.08) appear unfavorable, reflecting high price multiples. Overall, the ratios are slightly favorable.
Shareholder Return Policy
Thermo Fisher Scientific maintains a consistent dividend payout ratio around 9%, with dividends per share rising steadily from $1.00 in 2021 to $1.69 in 2025. The dividend yield remains modest near 0.29%, supported by a strong free cash flow coverage of dividends and capital expenditures, indicating prudent capital allocation.
The company also engages in share buybacks, complementing its dividend policy to return capital to shareholders. This balanced approach aligns with sustainable long-term value creation, minimizing risks of excessive payouts or over-leveraging while supporting steady shareholder returns.
Score analysis
The following radar chart illustrates Thermo Fisher Scientific’s key financial scores for a comprehensive overview:
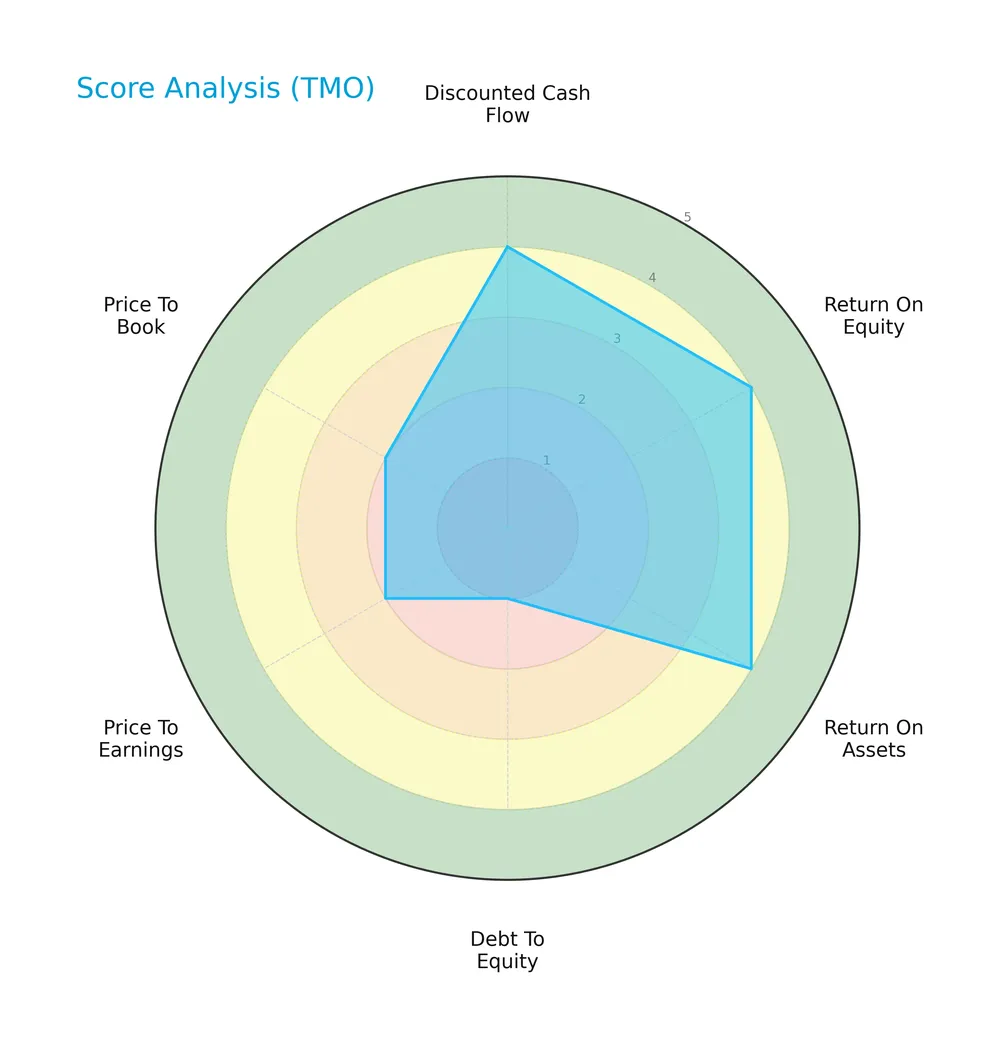
Thermo Fisher scores favorably on discounted cash flow, return on equity, and return on assets, indicating strong profitability. However, its debt-to-equity ratio and valuation metrics (PE and PB) are unfavorable, suggesting leverage concerns and valuation risk.
Analysis of the company’s bankruptcy risk
Thermo Fisher’s Altman Z-Score places it in the grey zone, indicating moderate bankruptcy risk and some financial uncertainty:

Is the company in good financial health?
This Piotroski diagram highlights Thermo Fisher’s overall financial strength based on multiple key criteria:
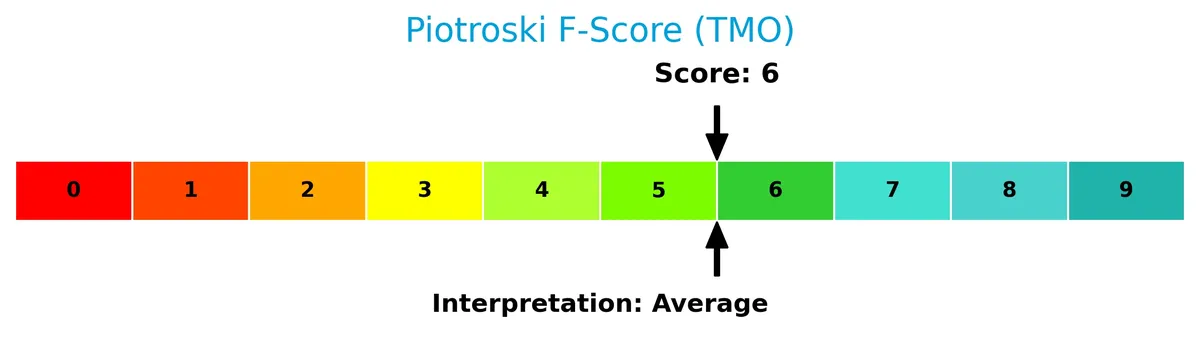
With a score of 6, Thermo Fisher shows average financial health. The score suggests solid fundamentals but leaves room for improvement in profitability or efficiency metrics.
Competitive Landscape & Sector Positioning
This section analyzes Thermo Fisher Scientific’s strategic positioning within the medical diagnostics and research sector. It covers revenue by segment, key products, main competitors, competitive advantages, and a SWOT analysis. I will assess whether Thermo Fisher holds a sustainable competitive advantage over its peers.
Strategic Positioning
Thermo Fisher Scientific operates a diversified portfolio spanning consumables (18.7B), instruments (7.3B), and services (18.6B) in 2025. Its geographic footprint covers North America (23B), Europe (11.8B), Asia Pacific (8.1B), and other regions, reflecting broad global exposure.
Revenue by Segment
The pie chart illustrates Thermo Fisher Scientific’s revenue distribution by segment for fiscal year 2025, highlighting the company’s diverse business model.
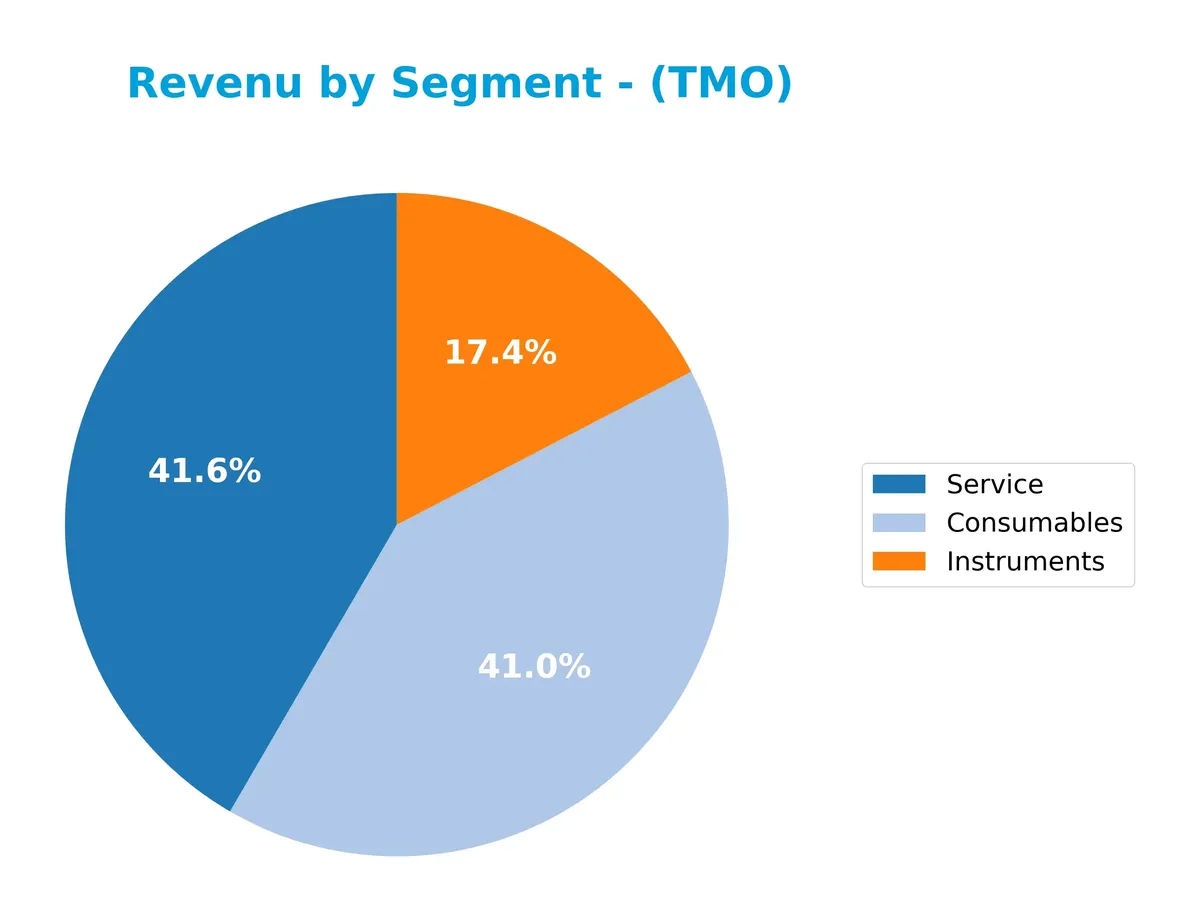
In 2025, Consumables and Service segments dominate, generating $18.7B and $18.6B respectively, reflecting a balanced mix of recurring and project-based revenue. Instruments contribute a smaller $7.3B, showing slight contraction from prior years. Recent trends reveal steady growth in Consumables and Service, signaling strong demand and operational stability, though Instruments face mild pressure, suggesting a need for innovation to maintain competitiveness.
Key Products & Brands
Thermo Fisher Scientific offers diverse products and services across key life sciences and diagnostics segments:
| Product | Description |
|---|---|
| Consumables | Reagents, instruments, and consumables for biological and medical research, drug and vaccine production, and diagnostics. |
| Instruments | Analytical instruments, consumables, software, and services for pharmaceutical, biotech, academic, and industrial markets. |
| Service | Laboratory products, clinical research, pharma services, and customer support across multiple healthcare sectors. |
Thermo Fisher’s product portfolio spans consumables, instruments, and services, reflecting its integrated approach to life sciences and diagnostics markets. This breadth supports pharmaceutical, biotech, clinical, and research customers worldwide.
Main Competitors
There are 11 competitors in total, with the table below showing the top 10 leaders by market capitalization:
| Competitor | Market Cap. |
|---|---|
| Thermo Fisher Scientific Inc. | 225B |
| Danaher Corporation | 165B |
| IDEXX Laboratories, Inc. | 53.5B |
| Agilent Technologies, Inc. | 39.1B |
| IQVIA Holdings Inc. | 38.4B |
| Mettler-Toledo International Inc. | 28.8B |
| Waters Corporation | 22.7B |
| Quest Diagnostics Incorporated | 19.4B |
| Revvity, Inc. | 11.6B |
| Charles River Laboratories International, Inc. | 10.0B |
Thermo Fisher Scientific ranks first among its 11 competitors. It holds a market cap 87% the size of the sector’s leader (likely itself, indicating a data nuance). The company trades well above both the average market cap of the top 10 competitors (61.3B) and the sector’s median of 28.8B. It maintains an 18.4% gap above its closest rival below, Danaher Corporation, underscoring its dominant scale in medical diagnostics and research.
Comparisons with competitors
Check out how we compare the company to its competitors:
Does Thermo Fisher Scientific Inc. have a competitive advantage?
Thermo Fisher Scientific currently shows a slightly unfavorable competitive advantage. Its return on invested capital (ROIC) is below its weighted average cost of capital (WACC), indicating value erosion and declining profitability over 2021-2025.
Looking ahead, the company is positioned in diverse markets including North America, Europe, and Asia-Pacific. It offers an extensive product range in life sciences and diagnostics, suggesting opportunities to leverage innovation and geographic expansion for future growth.
SWOT Analysis
This SWOT analysis highlights key internal and external factors shaping Thermo Fisher Scientific’s strategic position.
Strengths
- strong market leadership
- diversified product portfolio
- robust global footprint
Weaknesses
- declining ROIC trend
- unfavorable P/E and P/B ratios
- moderate debt-to-equity concerns
Opportunities
- expanding Asia-Pacific market
- biotech and pharma innovation growth
- increasing demand for diagnostics
Threats
- intensifying competition
- regulatory risks
- economic sensitivity in key markets
Thermo Fisher’s strengths in diversification and market presence provide resilience. However, declining profitability and valuation concerns warrant caution. The company must leverage growth in emerging markets and innovation while managing competitive and regulatory pressures.
Stock Price Action Analysis
The weekly stock chart displays the price movement of Thermo Fisher Scientific Inc. over the past 100 weeks, highlighting key highs and lows:
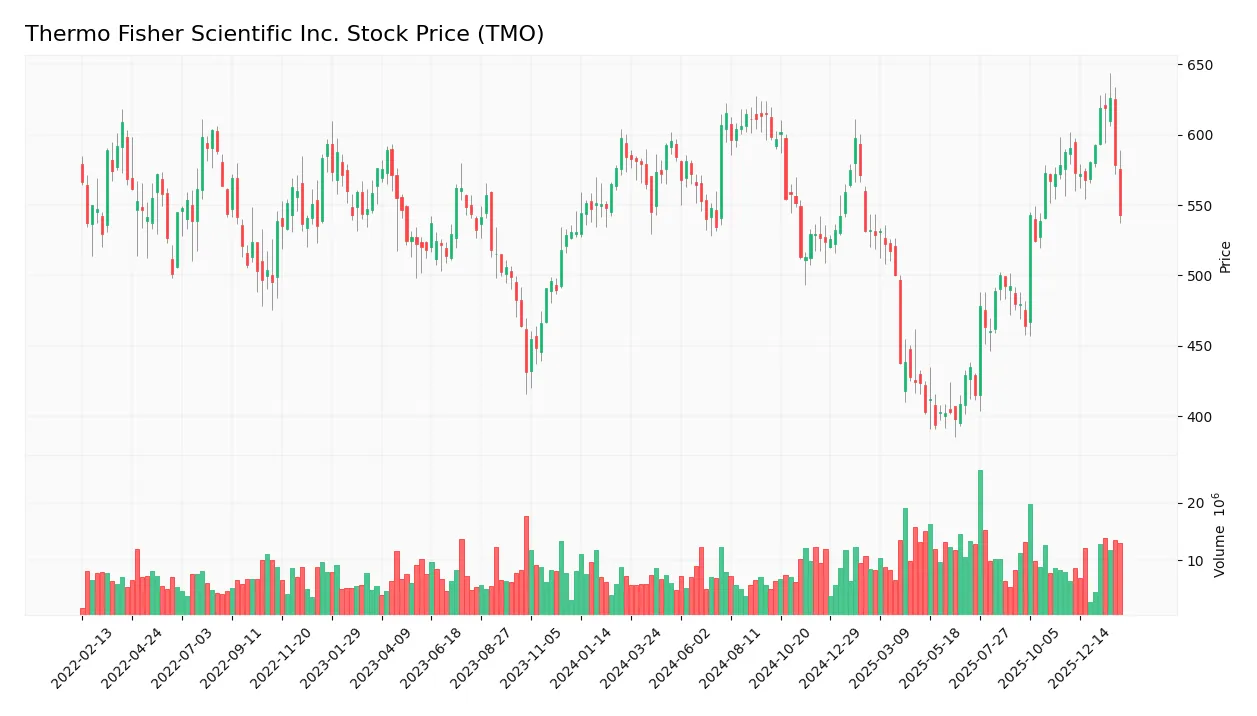
Trend Analysis
Over the past 12 months, the stock price declined by 10.24%, reflecting a bearish trend. The price range spans from a high of 625.98 to a low of 393.66. Volatility is significant, with a standard deviation of 64.06, and the downtrend shows deceleration.
Volume Analysis
In the last three months, seller volume dominated at 61.22%, indicating a seller-driven market. Trading volumes have increased, signaling heightened market participation but with prevailing bearish sentiment among investors.
Target Prices
Analysts project a robust target price range, reflecting strong confidence in Thermo Fisher Scientific’s growth prospects.
| Target Low | Target High | Consensus |
|---|---|---|
| 561 | 750 | 643.69 |
The target prices indicate a bullish consensus, with upside potential exceeding 15% from current levels, underscoring optimism in the company’s strategic execution.

Don’t Let Luck Decide Your Entry Point
Optimize your entry points with our advanced ProRealTime indicators. You’ll get efficient buy signals with precise price targets for maximum performance. Start outperforming now!
Analyst & Consumer Opinions
This section examines analyst ratings and consumer feedback to provide a balanced view of Thermo Fisher Scientific Inc.’s performance.
Stock Grades
Here is the recent stock grading summary for Thermo Fisher Scientific Inc. from leading financial institutions:
| Grading Company | Action | New Grade | Date |
|---|---|---|---|
| Barclays | Maintain | Overweight | 2026-01-30 |
| TD Cowen | Maintain | Buy | 2026-01-30 |
| Citigroup | Maintain | Buy | 2026-01-30 |
| Stifel | Maintain | Buy | 2026-01-09 |
| TD Cowen | Maintain | Buy | 2026-01-07 |
| Wells Fargo | Maintain | Overweight | 2025-12-15 |
| Citigroup | Upgrade | Buy | 2025-12-11 |
| Keybanc | Upgrade | Overweight | 2025-12-08 |
| Morgan Stanley | Maintain | Overweight | 2025-12-02 |
| HSBC | Upgrade | Buy | 2025-12-01 |
The grades show a consistent bullish sentiment with multiple recent upgrades and no downgrades. Analysts mainly maintain ‘Buy’ or ‘Overweight’ ratings, reflecting confidence in the stock’s outlook.
Consumer Opinions
Thermo Fisher Scientific Inc. enjoys a generally positive reputation among its users, reflecting its strong market presence and product reliability.
| Positive Reviews | Negative Reviews |
|---|---|
| “Reliable products with consistent performance.” | “Customer service response times can be slow.” |
| “Innovative solutions tailored to research needs.” | “Pricing feels high for smaller labs.” |
| “Excellent technical support and training.” | “Occasional shipping delays reported.” |
Overall, consumers praise Thermo Fisher’s innovation and product reliability. However, some express concerns about pricing and customer service speed, signaling areas for improvement despite a strong brand loyalty.
Risk Analysis
The table below summarizes key risks Thermo Fisher Scientific faces, highlighting likelihood and potential impact:
| Category | Description | Probability | Impact |
|---|---|---|---|
| Valuation Risk | High P/E (32.3) and P/B (4.08) ratios suggest overvaluation risk. | Medium | High |
| Leverage Risk | Debt-to-equity is high with a poor rating, increasing financial risk. | Medium | Medium |
| Market Volatility | Beta near 1 implies stock moves closely with market swings. | Medium | Medium |
| Operational Risk | Asset turnover is low (0.4), indicating suboptimal asset utilization. | Low | Medium |
| Bankruptcy Risk | Altman Z-score in grey zone (2.84) signals moderate financial distress risk. | Low | High |
The most pressing risks are valuation and leverage. The stretched valuation multiples could limit upside during market pullbacks. Meanwhile, debt levels require careful monitoring, as rising interest rates could strain coverage despite a current favorable ratio of 5.7. The Altman Z-score near distress warns of moderate financial vulnerability. These factors collectively suggest cautious optimism but warrant vigilance amid economic uncertainty.
Should You Buy Thermo Fisher Scientific Inc.?
Thermo Fisher appears to have robust operational efficiency but a slightly unfavorable moat, as declining ROIC suggests value erosion. Despite a manageable debt profile, mixed valuation metrics and a moderate overall rating of B call for cautious analytical interpretation.
Strength & Efficiency Pillars
Thermo Fisher Scientific Inc. maintains solid operational efficiency, reflected in a robust net margin of 15.12% and an EBIT margin of 18.2%. Its return on equity stands at a moderate 12.61%, while ROIC measures 7.6%, slightly above the WACC of 7.25%. This marginal excess suggests the company still creates modest value despite a declining ROIC trend. Favorable interest coverage at 5.71x underscores manageable financing costs, supporting operational resilience amid sector pressures.
Weaknesses and Drawbacks
While Thermo Fisher avoids financial distress with an Altman Z-Score of 2.84 in the grey zone, its valuation metrics raise caution. A high P/E ratio of 32.34 and a P/B of 4.08 indicate premium pricing that may limit upside. The current ratio at 1.89 is healthy, yet the debt-to-equity ratio at 0.74 signals moderate leverage. Recent seller dominance with buyer activity at 38.78% adds short-term market pressure, reinforcing the need for careful entry timing.
Our Final Verdict about Thermo Fisher Scientific Inc.
Thermo Fisher presents a fundamentally stable profile with operational profitability but faces valuation and market pressure headwinds. Despite a bearish recent trend and seller dominance, its grey zone solvency status avoids immediate distress concerns. This profile suggests potential but warrants caution; investors might consider a wait-and-see approach for a more favorable entry point amid ongoing market deceleration.
Disclaimer: This content is for informational purposes only and does not constitute financial, investment, or other professional advice. Investing in financial markets involves a significant risk of loss, and past performance is not indicative of future results.
Additional Resources
- Thermo Fisher Scientific Stock To $390? – Trefis (Feb 27, 2026)
- DNB Asset Management AS Decreases Stock Holdings in Thermo Fisher Scientific Inc. $TMO – MarketBeat (Feb 27, 2026)
- Here’s What Analysts Think About Thermo Fisher Scientific (TMO) Post Earnings – Finviz (Feb 27, 2026)
- Decoding Thermo Fisher Scientific Inc (TMO): A Strategic SWOT In – GuruFocus (Feb 27, 2026)
- Thermo Fisher Scientific Inc. (TMO) Carries a Mid-Single Digit Organic Growth Forecast – Yahoo Finance (Feb 24, 2026)
For more information about Thermo Fisher Scientific Inc., please visit the official website: thermofisher.com