Home > Analyses > Energy > The Williams Companies, Inc.
The Williams Companies, Inc. powers the flow of energy that fuels millions of American homes and industries daily. With an extensive network spanning 30,000 miles of pipelines and leading natural gas processing facilities, Williams dominates the U.S. midstream oil and gas sector. Its reputation for operational excellence and strategic asset management sets a high bar for industry peers. As energy markets evolve, I ask: does Williams’ robust infrastructure still justify its premium valuation and growth prospects?

Table of contents
Business Model & Company Overview
The Williams Companies, Inc., founded in 1908 and headquartered in Tulsa, Oklahoma, stands as a dominant player in the U.S. oil and gas midstream sector. It operates a vast energy infrastructure ecosystem, including 30,000 miles of pipelines and 29 processing facilities. This network integrates natural gas transmission, gathering, processing, and NGL storage, forming a cohesive system that supports energy flow across key regions.
Williams generates value through a balanced mix of transmission assets and marketing services. Its footprint spans critical U.S. basins—from the Gulf Coast to the Marcellus and Rocky Mountain regions—serving utilities, municipalities, and producers. The company’s deep infrastructure and integrated operations create a robust economic moat that underpins its role in shaping America’s energy future.
Financial Performance & Fundamental Metrics
I will analyze The Williams Companies, Inc.’s income statement, key financial ratios, and dividend payout policy to assess its financial health and shareholder value.
Income Statement
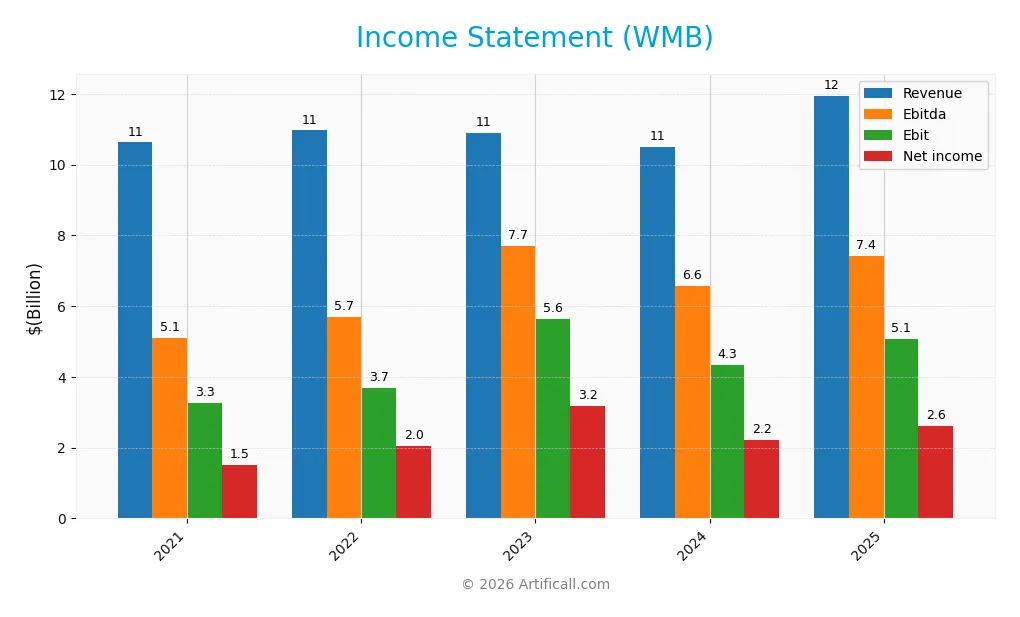
The table below presents The Williams Companies, Inc.’s key income statement figures from 2021 to 2025, providing a clear view of its financial performance and profitability trends.
| 2021 | 2022 | 2023 | 2024 | 2025 | |
|---|---|---|---|---|---|
| Revenue | 10.6B | 10.9B | 10.9B | 10.5B | 11.9B |
| Cost of Revenue | 5.9B | 5.5B | 4.1B | 4.3B | 6.8B |
| Operating Expenses | 2.1B | 2.5B | 2.5B | 2.8B | 0.7B |
| Gross Profit | 4.8B | 5.5B | 6.8B | 6.2B | 5.1B |
| EBITDA | 5.1B | 5.7B | 7.7B | 6.6B | 7.4B |
| EBIT | 3.3B | 3.7B | 5.6B | 4.4B | 5.1B |
| Interest Expense | 1.2B | 1.1B | 1.2B | 1.4B | 1.4B |
| Net Income | 1.5B | 2.0B | 3.2B | 2.2B | 2.6B |
| EPS | 1.25 | 1.68 | 2.61 | 1.82 | 2.14 |
| Filing Date | 2022-02-28 | 2023-02-27 | 2024-02-21 | 2025-02-25 | 2026-02-24 |
Income Statement Evolution
From 2021 to 2025, Williams Companies, Inc. grew revenue by 12.45%, with a notable 13.78% rise in 2025 alone. Net income surged 72.58% over the period, while net margins expanded 53.47%, reflecting improving profitability. However, gross profit declined 16.93% in 2025, indicating margin pressure despite favorable revenue and EBIT growth.
Is the Income Statement Favorable?
In 2025, the company reported $11.95B revenue and $2.62B net income, yielding a 21.91% net margin, marked favorable. EBIT margin stood at a strong 42.4%, supported by disciplined operating expenses growing in line with revenue. Interest expense at 12.07% of revenue remains a cautionary factor, though overall fundamentals appear favorable for the fiscal year.
Financial Ratios
The table below summarizes key financial ratios for The Williams Companies, Inc. (WMB) over the last five fiscal years:
| Ratios | 2021 | 2022 | 2023 | 2024 | 2025 |
|---|---|---|---|---|---|
| Net Margin | 14% | 19% | 29% | 21% | 22% |
| ROE | 13% | 18% | 26% | 18% | 20% |
| ROIC | 4.4% | 5.6% | 6.7% | 5.1% | 6.2% |
| P/E | 21 | 20 | 13 | 30 | 28 |
| P/B | 2.8 | 3.5 | 3.4 | 5.3 | 5.7 |
| Current Ratio | 0.91 | 0.78 | 0.77 | 0.50 | 0.53 |
| Quick Ratio | 0.84 | 0.71 | 0.73 | 0.45 | 0.48 |
| D/E | 2.07 | 1.99 | 2.13 | 2.18 | 2.29 |
| Debt-to-Assets | 50% | 47% | 50% | 50% | 50% |
| Interest Coverage | 2.2 | 2.6 | 3.5 | 2.4 | 3.1 |
| Asset Turnover | 0.22 | 0.23 | 0.21 | 0.19 | 0.20 |
| Fixed Asset Turnover | 0.36 | 0.35 | 0.32 | 0.27 | 0.28 |
| Dividend Yield | 6.3% | 5.2% | 5.1% | 3.5% | 3.3% |
Evolution of Financial Ratios
Return on Equity (ROE) has generally improved from 13.28% in 2021 to 20.44% in 2025, indicating stronger profitability. The Current Ratio declined steadily from 0.91 in 2021 to 0.53 in 2025, signaling deteriorating liquidity. Debt-to-Equity Ratio increased moderately from 2.07 in 2021 to 2.29 in 2025, reflecting higher financial leverage.
Are the Financial Ratios Fovorable?
Profitability ratios such as net margin (21.91%) and ROE (20.44%) are favorable, supported by a WACC below ROIC at 5.97%. However, liquidity ratios (current and quick) below 1.0 and high leverage (debt-to-equity 2.29, debt-to-assets 50.13%) are unfavorable. Market multiples like P/E (28.03) and P/B (5.73) also appear stretched. Overall, ratio evaluation leans unfavorable with caution warranted.
Shareholder Return Policy
The Williams Companies, Inc. maintains a consistently high dividend payout ratio near 93%, with dividends per share rising steadily to $2 in 2025. The annual yield hovers around 3.3%, supported by free cash flow, though coverage remains tight, signaling limited buffer for unexpected cash flow dips.
The company also conducts share buybacks, complementing its dividend strategy. Despite strong earnings margins, the near-full payout and buybacks require monitoring for sustainability, especially given modest free cash flow coverage. This policy balances shareholder income with potential risks to long-term value.
Score analysis
The following radar chart illustrates key financial performance scores for The Williams Companies, Inc.:

The company shows very favorable returns on equity (5) and favorable returns on assets (4). However, its leverage and valuation metrics score very unfavorably, reflecting high debt and expensive price multiples. The overall moderate discounted cash flow score balances these concerns.
Analysis of the company’s bankruptcy risk
The Altman Z-Score places the company in the distress zone, signaling a high risk of financial distress and potential bankruptcy:

Is the company in good financial health?
The Piotroski diagram summarizes the company’s financial strength based on nine criteria:

With a Piotroski Score of 6, the company demonstrates average financial health. This indicates some strengths but also areas requiring improvement to enhance investor confidence.
Competitive Landscape & Sector Positioning
This sector analysis explores The Williams Companies, Inc.’s strategic positioning, revenue streams, and key products. I will assess whether the company holds a competitive advantage over its main competitors.
Strategic Positioning
The Williams Companies, Inc. concentrates its operations within the U.S. energy midstream sector. It diversifies across four key segments: Transmission & Gulf of Mexico, Northeast G&P, West, and Gas & NGL Marketing Services, with a broad geographic footprint primarily in shale regions and the Gulf Coast.
Revenue by Segment
This pie chart displays The Williams Companies, Inc.’s revenue breakdown by segment for the fiscal year 2024, illustrating the relative size and contribution of each business unit.
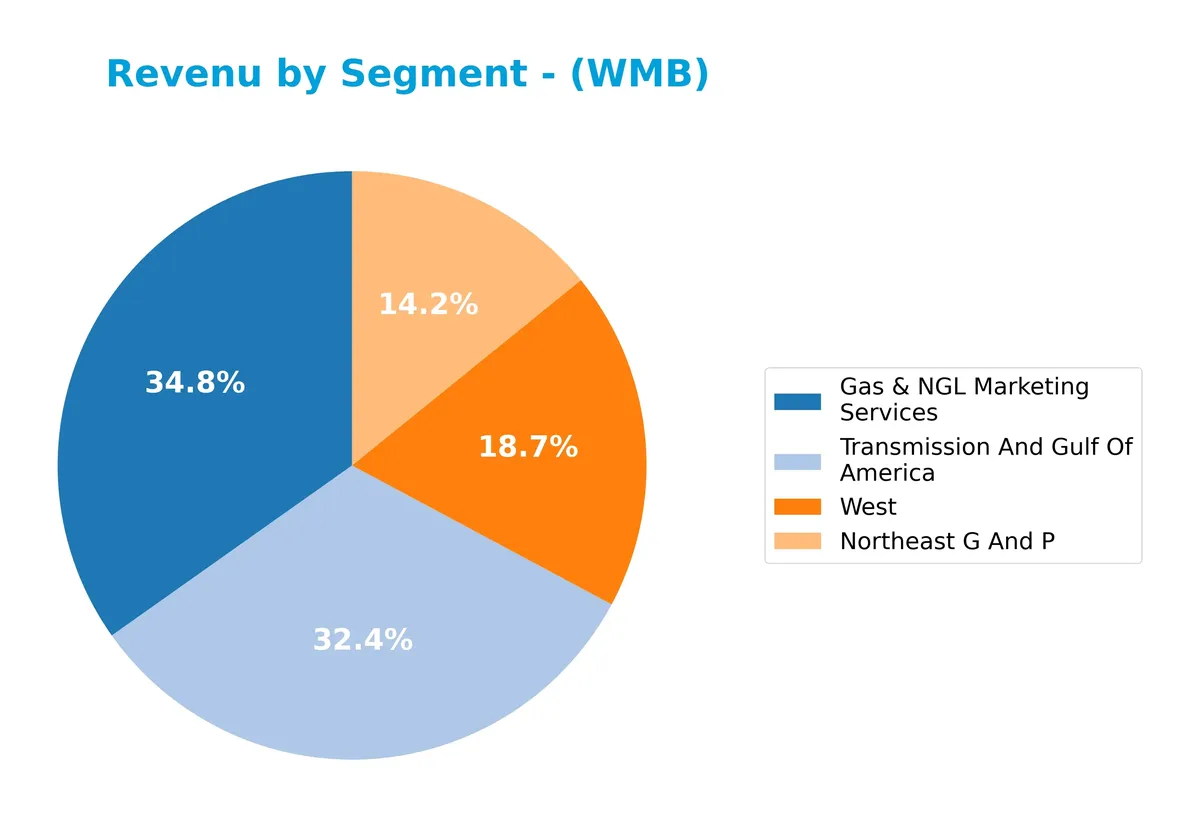
In 2024, Gas & NGL Marketing Services leads with $5B, reflecting strong growth from $2.9B in 2023. Transmission And Gulf Of America also contributes significantly with $4.6B. Northeast G And P and West segments generate $2B and $2.7B respectively. The recent year shows a clear acceleration in Gas & NGL Marketing, signaling a shift toward marketing services as a key growth driver.
Key Products & Brands
The Williams Companies, Inc. operates diverse energy infrastructure segments and services, including pipeline operations and marketing:
| Product | Description |
|---|---|
| Transmission & Gulf of Mexico | Operates Transco and Northwest natural gas pipelines; handles natural gas gathering, processing, and crude oil transport in the Gulf Coast. Includes petrochemical and feedstock pipelines. |
| Northeast G&P | Midstream gathering, processing, and fractionation in the Marcellus Shale (PA, NY) and Utica Shale (OH) regions. |
| West | Gas gathering, processing, and treating in Rocky Mountain, Barnett, Eagle Ford, Haynesville, and Mid-Continent basins. Also operates NGL fractionation and storage near Conway, KS. |
| Gas & NGL Marketing Services | Provides wholesale marketing, trading, storage, and transportation of natural gas and NGLs. Serves utilities, municipalities, power generators, and producers; includes risk and asset management. |
Williams deploys a broad asset base spanning 30,000 miles of pipelines and extensive processing and storage facilities. These segments reflect a comprehensive footprint in U.S. natural gas midstream infrastructure.
Main Competitors
The Energy sector features 4 main competitors, with the table below listing the top 4 leaders by market capitalization:
| Competitor | Market Cap. |
|---|---|
| The Williams Companies, Inc. | 74.3B |
| Kinder Morgan, Inc. | 61.6B |
| ONEOK, Inc. | 46.8B |
| Targa Resources Corp. | 40.1B |
The Williams Companies, Inc. ranks first among its 4 competitors. It holds a 20% larger market cap than the nearest rival, Kinder Morgan, Inc. The company stands above both the average market cap of the top 10 competitors (55.7B) and the sector median (54.2B). Its lead over the closest competitor underscores its dominant position in the Oil & Gas Midstream industry.
Comparisons with competitors
Check out how we compare the company to its competitors:
Does WMB have a competitive advantage?
WMB does not yet demonstrate a clear competitive advantage, as its ROIC remains below the WACC, indicating the company is currently shedding value. However, its growing ROIC trend suggests improving profitability.
Looking ahead, WMB’s extensive pipeline network and diversified midstream operations across key U.S. shale regions offer potential to capitalize on evolving energy markets. Opportunities in natural gas and NGL marketing services could support future growth.
SWOT Analysis
This SWOT analysis highlights The Williams Companies, Inc.’s current strategic position and investment considerations.
Strengths
- strong revenue growth
- favorable net margin at 21.9%
- large, diversified pipeline network
Weaknesses
- weak liquidity ratios (current 0.53, quick 0.48)
- high leverage (D/E 2.29)
- overvalued valuation metrics (P/E 28, P/B 5.73)
Opportunities
- expanding natural gas demand in US
- potential operational efficiencies from asset scale
- increasing profitability trend (ROIC growth)
Threats
- regulatory risks in energy sector
- commodity price volatility
- rising interest expenses impacting costs
Williams shows solid profitability and growth backed by extensive infrastructure. However, liquidity and leverage pose financial risks. The company’s strategy should focus on strengthening the balance sheet while capitalizing on midstream market growth. Vigilance on valuation and interest costs is critical for risk management.
Stock Price Action Analysis
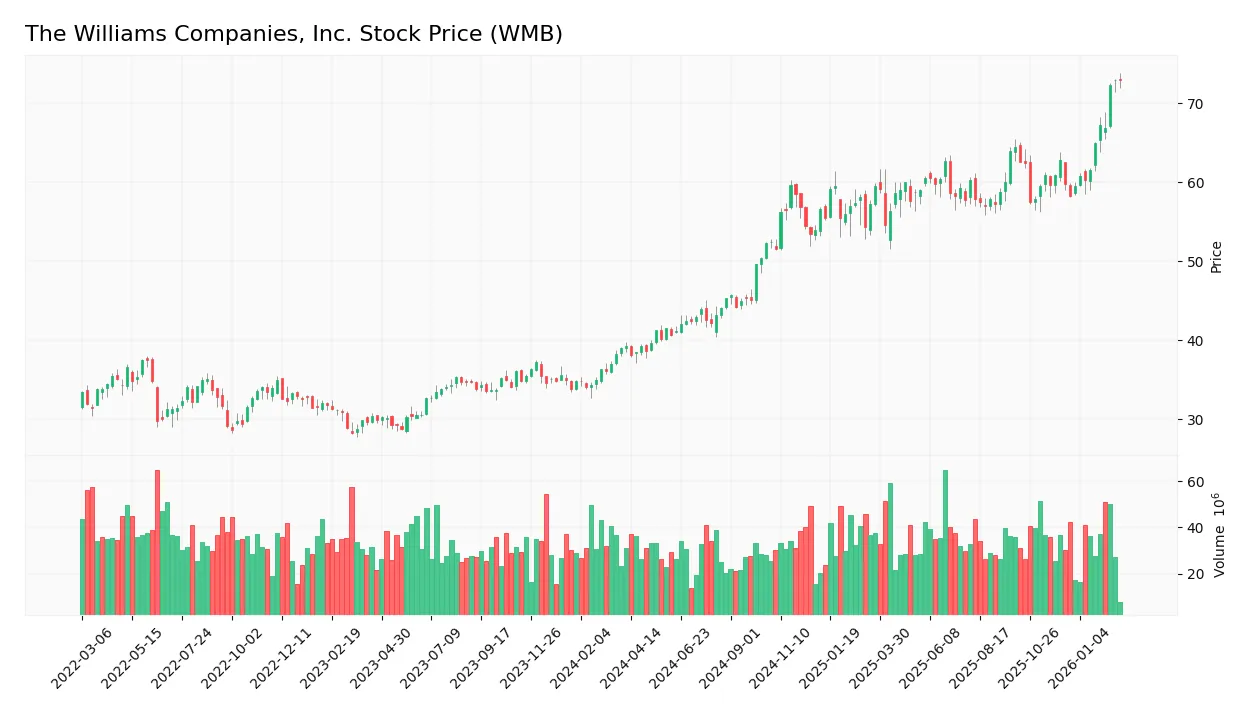
The weekly stock chart of The Williams Companies, Inc. (WMB) illustrates notable price momentum and volatility over the past 100 weeks:
Trend Analysis
Over the past 100 weeks, WMB’s stock price rose by 86.04%, indicating a strong bullish trend with accelerating momentum. The price fluctuated between a low of 38.08 and a high of 72.98. Volatility remains moderate, with an 8.4 standard deviation supporting sustained price swings.
Volume Analysis
Trading volume has increased, driven by a consistent buyer dominance of 60.54% overall. In the recent 12-week period, buyers remain slightly dominant at 57.18%, suggesting steady, though less aggressive, market participation and positive investor sentiment.
Target Prices
Analysts set a clear target consensus for The Williams Companies, Inc. (WMB).
| Target Low | Target High | Consensus |
|---|---|---|
| 66 | 89 | 78.5 |
The target range suggests moderate upside potential. Analysts expect steady performance aligned with sector trends.

Don’t Let Luck Decide Your Entry Point
Optimize your entry points with our advanced ProRealTime indicators. You’ll get efficient buy signals with precise price targets for maximum performance. Start outperforming now!
Analyst & Consumer Opinions
This section examines recent analyst grades and consumer feedback related to The Williams Companies, Inc. (WMB).
Stock Grades
Here are the latest verified analyst grades for The Williams Companies, Inc., reflecting current market sentiment:
| Grading Company | Action | New Grade | Date |
|---|---|---|---|
| Jefferies | Maintain | Buy | 2026-02-17 |
| UBS | Maintain | Buy | 2026-02-17 |
| Stifel | Maintain | Buy | 2026-02-13 |
| Scotiabank | Upgrade | Sector Outperform | 2026-02-13 |
| Citigroup | Maintain | Buy | 2026-02-12 |
| RBC Capital | Maintain | Outperform | 2026-02-11 |
| Wells Fargo | Maintain | Overweight | 2026-02-11 |
| Jefferies | Maintain | Buy | 2026-02-03 |
| Jefferies | Maintain | Buy | 2026-01-09 |
| Citigroup | Maintain | Buy | 2025-11-13 |
Most analysts maintain a Buy rating, with no recent downgrades. Scotiabank’s upgrade to Sector Outperform signals growing confidence in the company’s outlook.
Consumer Opinions
Consumer sentiment around The Williams Companies, Inc. (WMB) reflects a mix of appreciation for its infrastructure reliability and concerns over service responsiveness.
| Positive Reviews | Negative Reviews |
|---|---|
| “Consistently reliable natural gas delivery.” | “Customer service can be slow to respond.” |
| “Strong commitment to safety and environmental care.” | “Billing issues have occurred several times.” |
| “Transparent communication during outages.” | “Pricing seems higher compared to competitors.” |
Overall, consumers praise WMB’s dependable infrastructure and safety focus. However, repeated mentions of customer service delays and billing problems suggest areas needing improvement.
Risk Analysis
Below is a detailed table of key risks facing The Williams Companies, Inc., highlighting their likelihood and potential impact:
| Category | Description | Probability | Impact |
|---|---|---|---|
| Financial Leverage | High debt-to-equity ratio of 2.29 increases financial strain and limits flexibility. | High | High |
| Liquidity Risk | Low current ratio of 0.53 signals weak short-term liquidity and potential cash flow issues. | High | Medium |
| Valuation Risk | Elevated P/E of 28 and P/B of 5.73 suggest overvaluation relative to industry norms. | Medium | Medium |
| Bankruptcy Risk | Altman Z-score of 1.37 places the company in distress zone, raising concerns about solvency. | Medium | High |
| Market Volatility | Beta of 0.665 indicates moderate sensitivity to market swings, somewhat cushioning shocks. | Low | Low |
| Operational Risk | Asset turnover of 0.2 reflects inefficiency in asset utilization, pressuring margins. | Medium | Medium |
The most pressing risks are the high leverage and poor liquidity, which historically in energy midstream firms can amplify downturn effects. The distress-level Altman Z-score confirms solvency concerns despite steady profitability. Prudence dictates close monitoring of debt servicing and cash flow trends.
Should You Buy The Williams Companies, Inc.?
The Williams Companies, Inc. appears to be improving profitability with a slightly favorable moat supported by growing ROIC, yet struggles with a challenging leverage profile and liquidity constraints. Its overall B- rating suggests a moderate but cautious investment case.
Strength & Efficiency Pillars
The Williams Companies, Inc. maintains solid operational profitability with a net margin of 21.91% and return on equity (ROE) at 20.44%, both favorable. Return on invested capital (ROIC) stands at 6.16%, slightly above the weighted average cost of capital (WACC) at 5.97%, indicating modest value creation. The firm exhibits robust EBIT and gross margins exceeding 42%, underscoring efficient cost management. Revenue and net income growth remain strong, supporting a favorable overall income statement view despite some margin pressure.
Weaknesses and Drawbacks
The company is in financial distress, reflected by a precarious Altman Z-Score of 1.37, signaling a high bankruptcy risk. This solvency concern overshadows profitability metrics. Leverage is excessive with a debt-to-equity ratio of 2.29 and a low current ratio of 0.53, raising liquidity red flags. Valuation multiples are elevated, with a P/E of 28.03 and P/B of 5.73, suggesting a premium price that may not align with underlying fundamentals. Asset turnover is weak, indicating underutilized capital.
Our Final Verdict about The Williams Companies, Inc.
Despite operational strengths, The Williams Companies’ distress-level Z-Score makes the investment profile highly speculative and risky for conservative capital. The company’s growth and profitability might appear promising, but solvency risks and high leverage caution against entering at current valuations. Investors may consider a wait-and-see approach until financial health improves. Market trends remain bullish, yet fundamental risks dominate the outlook.
Disclaimer: This content is for informational purposes only and does not constitute financial, investment, or other professional advice. Investing in financial markets involves a significant risk of loss, and past performance is not indicative of future results.
Additional Resources
- Williams Companies, Inc. (The) (NYSE:WMB) Given Consensus Recommendation of “Moderate Buy” by Analysts – MarketBeat (Feb 24, 2026)
- Jefferies Raises its Price Target on The Williams Companies, Inc. (WMB) to $81 and Maintains a Buy Rating – Yahoo Finance (Feb 21, 2026)
- Parr Mcknight Wealth Management Group LLC Sells 45,021 Shares of Williams Companies, Inc. (The) $WMB – MarketBeat (Feb 24, 2026)
- Why Williams Companies (WMB) Is Up 8.0% After Stronger 2025 Earnings And What’s Next – simplywall.st (Feb 15, 2026)
- Williams Companies (WMB) Gains Analyst Confidence with Growth Outlook – Yahoo Finance (Feb 19, 2026)
For more information about The Williams Companies, Inc., please visit the official website: williams.com