Home > Analyses > Financial Services > The Travelers Companies, Inc.
The Travelers Companies, Inc. safeguards millions of businesses and individuals, shaping the backbone of risk management in everyday life. As a dominant force in property and casualty insurance, Travelers delivers comprehensive coverage through its Business, Bond & Specialty, and Personal Insurance segments. Renowned for its innovation and steadfast underwriting discipline, the company balances growth with prudence. The question is whether Travelers’ solid fundamentals still justify its premium valuation and growth expectations in today’s evolving insurance landscape.

Table of contents
Business Model & Company Overview
The Travelers Companies, Inc., founded in 1853 and headquartered in New York City, stands as a titan in the property and casualty insurance industry. It weaves a cohesive ecosystem through its three core segments: Business Insurance, Bond & Specialty Insurance, and Personal Insurance. This diversified portfolio serves businesses, government units, and individuals with tailored solutions, reinforcing its dominant market position.
Travelers drives value through a balanced revenue mix of commercial and personal insurance products. Its Business Insurance segment covers everything from workers’ compensation to energy risks, while Bond & Specialty Insurance offers surety and professional liability services. Personal Insurance focuses on automobile and homeowners coverage. With a strong presence across the Americas, Europe, and Asia, Travelers boasts a formidable economic moat rooted in its scale, underwriting discipline, and distribution network.
Financial Performance & Fundamental Metrics
I analyze The Travelers Companies, Inc.’s income statement, key financial ratios, and dividend payout policy to gauge its profitability and capital efficiency.
Income Statement
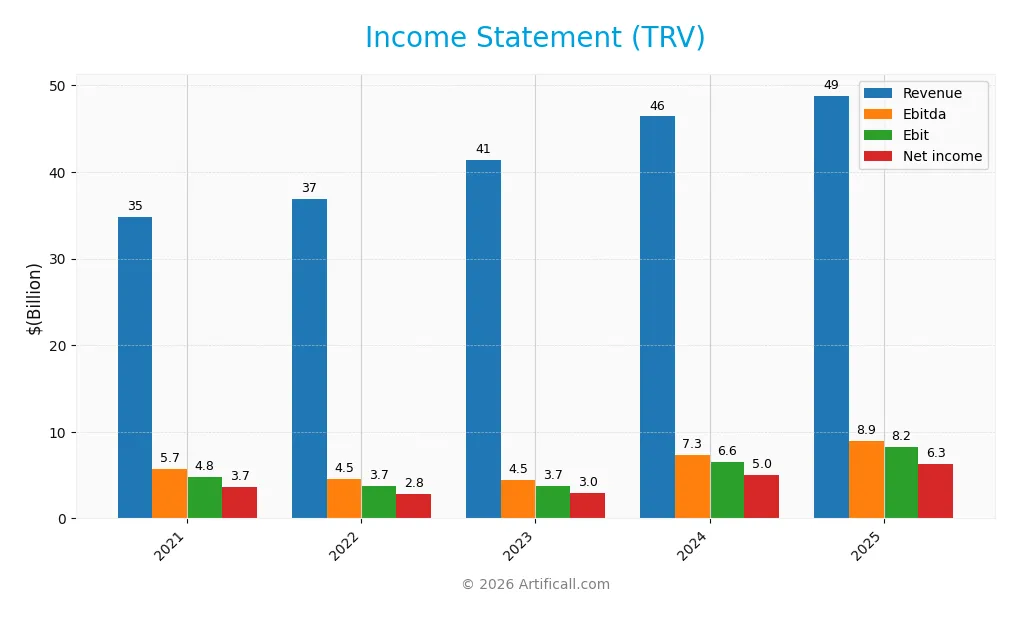
The table below summarizes The Travelers Companies, Inc.’s annual income statement figures over five fiscal years, reflecting revenue trends, profitability, and key expense items.
| 2021 | 2022 | 2023 | 2024 | 2025 | |
|---|---|---|---|---|---|
| Revenue | 34.8B | 36.9B | 41.4B | 46.4B | 48.8B |
| Cost of Revenue | 25.3B | 28.4B | 32.4B | 34.0B | 27.2B |
| Operating Expenses | 5.0B | 5.2B | 5.6B | 6.2B | 13.8B |
| Gross Profit | 9.5B | 8.5B | 8.9B | 12.4B | 21.6B |
| EBITDA | 5.7B | 4.5B | 4.5B | 7.3B | 8.9B |
| EBIT | 4.8B | 3.7B | 3.7B | 6.6B | 8.2B |
| Interest Expense | 0.3B | 0.4B | 0.4B | 0.4B | 0.4B |
| Net Income | 3.7B | 2.8B | 3.0B | 5.0B | 6.3B |
| EPS | 14.63 | 11.91 | 12.93 | 21.76 | 27.84 |
| Filing Date | 2022-02-17 | 2023-02-16 | 2024-02-15 | 2025-02-13 | 2026-02-12 |
Income Statement Evolution
From 2021 to 2025, The Travelers Companies, Inc. increased revenue by 40.25%, reflecting steady growth. Net income surged 71.71%, outpacing revenue expansion and lifting net margins by 22.43%. Gross and EBIT margins improved notably, signaling enhanced operational efficiency despite a slight unfavorable rise in operating expenses relative to revenue in the latest year.
Is the Income Statement Favorable?
In 2025, revenue grew 5.17%, with gross profit up 74.31%, driving a 25.09% rise in EBIT and a 19.6% net margin expansion. Interest expense remained low at 0.87% of revenue, supporting profitability. EPS jumped 27.76%. These fundamentals show strong earnings quality and margin improvement, underpinning a generally favorable income statement for investors.
Financial Ratios
The table below presents key financial ratios for The Travelers Companies, Inc. over the fiscal years 2021 to 2025:
| Ratios | 2021 | 2022 | 2023 | 2024 | 2025 |
|---|---|---|---|---|---|
| Net Margin | 10.5% | 7.7% | 7.2% | 10.8% | 12.9% |
| ROE | 12.7% | 13.2% | 12.0% | 17.9% | 19.1% |
| ROIC | 2.7% | 3.0% | -0.8% | -1.3% | 12.0% |
| P/E | 10.6 | 15.6 | 14.6 | 11.0 | 10.3 |
| P/B | 1.35 | 2.06 | 1.76 | 1.97 | 1.98 |
| Current Ratio | 4.97 | 0.00 | 0.00 | 0.00 | 0.23 |
| Quick Ratio | 4.97 | 0.00 | 0.00 | 0.00 | 0.23 |
| D/E | 0.25 | 0.34 | 0.32 | 0.29 | 0.28 |
| Debt-to-Assets | 6.1% | 6.3% | 6.4% | 6.0% | 6.4% |
| Interest Coverage | 13.1 | 9.6 | 9.0 | 15.8 | 18.3 |
| Asset Turnover | 0.29 | 0.32 | 0.33 | 0.35 | 0.34 |
| Fixed Asset Turnover | 0.00 | 0.00 | 0.00 | 0.00 | 0.00 |
| Dividend Yield | 2.24% | 1.97% | 2.08% | 1.73% | 1.51% |
Evolution of Financial Ratios
Return on Equity (ROE) for The Travelers Companies, Inc. improved steadily from 12.68% in 2021 to 19.12% in 2025, reflecting enhanced profitability. The Current Ratio showed a sharp decline from 4.97 in 2021 to 0.23 in 2025, indicating weakening liquidity. Debt-to-Equity Ratio remained relatively stable around 0.25-0.32, signaling consistent leverage management.
Are the Financial Ratios Favorable?
In 2025, profitability ratios including ROE (19.12%) and net margin (12.88%) are favorable, outperforming many industry peers. Liquidity ratios like Current and Quick Ratios at 0.23 are unfavorable, raising caution on short-term solvency. Leverage metrics such as Debt-to-Equity (0.28) and interest coverage (19.34) are favorable, indicating controlled debt risk. Asset turnover is low at 0.34, which is unfavorable, while valuation ratios like P/E (10.34) are favorable, and P/B (1.98) neutral. Overall, 57% of the key ratios are favorable.
Shareholder Return Policy
The Travelers Companies, Inc. maintains a consistent dividend payment with a payout ratio near 16% in 2025 and a dividend yield around 1.5%. Dividend per share has steadily increased from $3.50 in 2021 to $4.37 in 2025, indicating a cautious but upward distribution trend.
The company does not report share buybacks despite healthy free cash flow coverage of dividends and capital expenditures. This dividend policy, supported by solid earnings and cash flow, suggests a balanced approach aimed at sustainable long-term shareholder value, though the modest yield may limit income-focused appeal.
Score analysis
The following radar chart illustrates the company’s key financial evaluation scores:
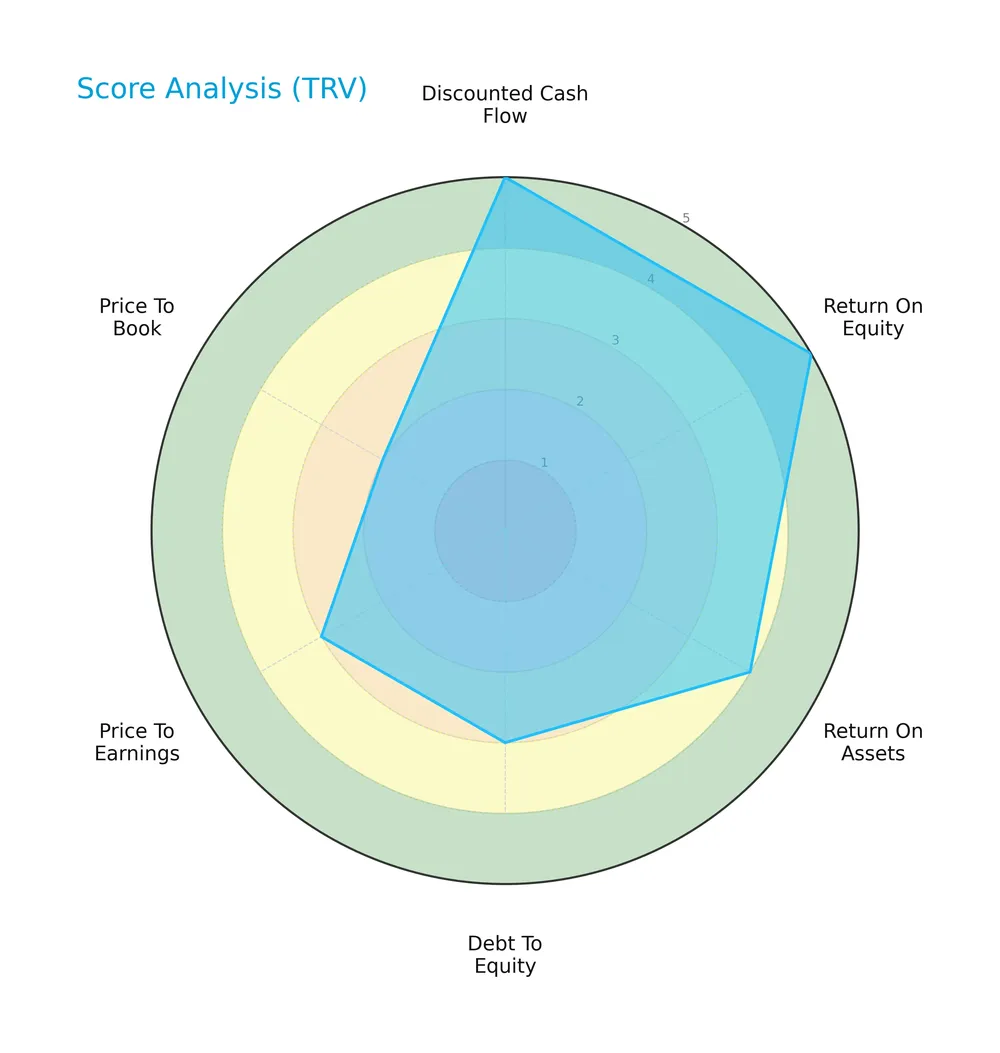
The company scores very favorably in discounted cash flow and return on equity, with moderate marks in debt to equity and price to earnings. The price to book ratio remains unfavorable, signaling valuation concerns.
Analysis of the company’s bankruptcy risk
The Altman Z-Score places the company in the distress zone, indicating a high risk of financial distress and potential bankruptcy:

Is the company in good financial health?
This Piotroski diagram assesses the company’s financial strength through nine key criteria:

With a Piotroski Score of 7, the company demonstrates strong financial health, suggesting solid profitability and operational efficiency despite some risks highlighted by other scores.
Competitive Landscape & Sector Positioning
This sector analysis examines The Travelers Companies, Inc.’s strategic positioning, revenue segments, key products, and main competitors. I will determine whether the company holds a competitive advantage over its industry peers.
Strategic Positioning
The Travelers Companies, Inc. maintains a diversified product portfolio with three main segments: Business Insurance ($24.7B), Personal Insurance ($17.4B), and Bond & Specialty Insurance ($4.4B) in 2024. Geographically, it is heavily concentrated in the U.S. ($43.9B), with smaller exposures in Canada and other non-U.S. markets.
Revenue by Segment
This pie chart illustrates The Travelers Companies, Inc.’s revenue distribution by segment for the fiscal year 2024, highlighting the contributions of Bond & Specialty, Business, and Personal Insurance.
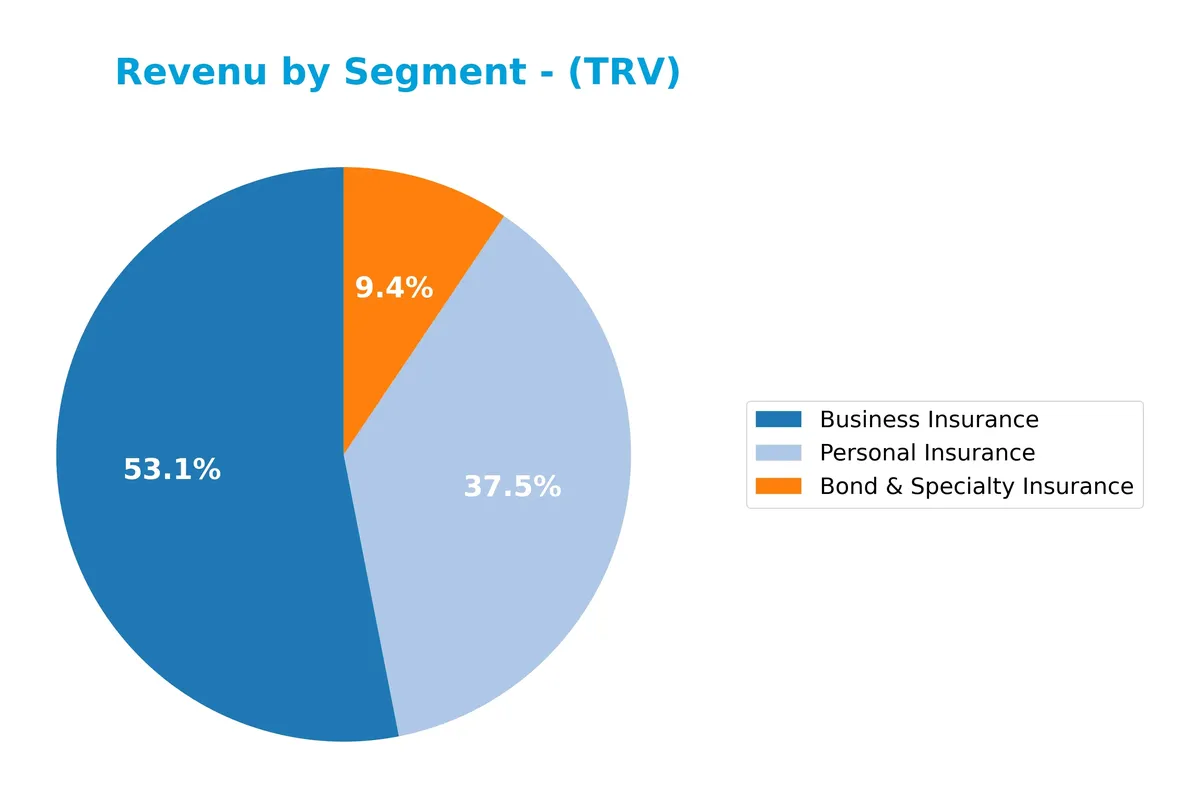
Business Insurance dominates with $24.7B in 2024, showing steady growth and driving the company’s top line. Personal Insurance also grew to $17.4B, reflecting expanding consumer demand. Bond & Specialty Insurance, while smaller at $4.4B, accelerated faster than other segments, signaling diversification. The overall trend reveals balanced growth but a strong reliance on Business Insurance, posing moderate concentration risk.
Key Products & Brands
The Travelers Companies, Inc. offers a diversified portfolio of insurance products across three main segments:
| Product | Description |
|---|---|
| Business Insurance | Covers workers’ compensation, commercial auto, property, liability, marine, aviation, energy, and specialty risks. Serves small to large businesses through brokers and program managers. |
| Bond & Specialty Insurance | Provides surety, fidelity, management and professional liability, and other property and casualty coverages via independent agencies and brokers. |
| Personal Insurance | Offers personal property and casualty insurance, primarily automobile and homeowners coverage for individuals through independent agencies. |
Travelers demonstrates a broad product mix serving commercial and personal insurance needs, with a strong distribution network rooted in independent agencies and brokers. The Business Insurance segment leads revenue, reflecting its extensive coverage scope and client base.
Main Competitors
There are 7 competitors in total, with the table listing the top 7 leaders by market capitalization:
| Competitor | Market Cap. |
|---|---|
| The Progressive Corporation | 124B |
| Chubb Limited | 124B |
| The Travelers Companies, Inc. | 64B |
| The Allstate Corporation | 54B |
| W. R. Berkley Corporation | 26B |
| Cincinnati Financial Corporation | 25B |
| Loews Corporation | 22B |
The Travelers Companies, Inc. ranks 3rd among its competitors. Its market cap is 53% of the leader’s size. The company stands above both the average market cap of the top 10 (63B) and the sector median (54B). It maintains a significant 87% gap from the next competitor above, highlighting strong positioning within the sector.
Comparisons with competitors
Check out how we compare the company to its competitors:
Does The Travelers Companies have a competitive advantage?
The Travelers Companies demonstrates a clear competitive advantage, evidenced by a very favorable moat status and a ROIC exceeding WACC by over 6%, signaling strong value creation. Its growing ROIC trend of 353% from 2021 to 2025 highlights increasing profitability and efficient capital use.
Looking ahead, The Travelers Companies benefits from a diversified insurance portfolio across business, bond & specialty, and personal segments, with steady revenue growth in the US and international markets. Continued expansion into niche specialty insurance products and international opportunities supports its robust future outlook.
SWOT Analysis
This analysis highlights The Travelers Companies, Inc.’s key strategic factors to guide investment decisions.
Strengths
- strong market position in U.S. insurance
- favorable ROIC vs. WACC indicating value creation
- diverse product segments including business and personal insurance
Weaknesses
- low current and quick ratios signaling liquidity risk
- asset turnover below industry norm
- moderate debt-to-equity ratio limiting financial flexibility
Opportunities
- expanding international revenue streams
- growing gross and net profit margins
- increasing EPS growth signaling operational efficiency
Threats
- competitive pressure in P&C insurance sector
- regulatory changes impacting underwriting
- economic downturn affecting premium growth
Travelers demonstrates robust profitability and a sustainable competitive advantage. However, liquidity constraints and asset utilization inefficiencies require cautious capital management. Strategic focus should leverage growth opportunities while mitigating sector-specific risks.
Stock Price Action Analysis
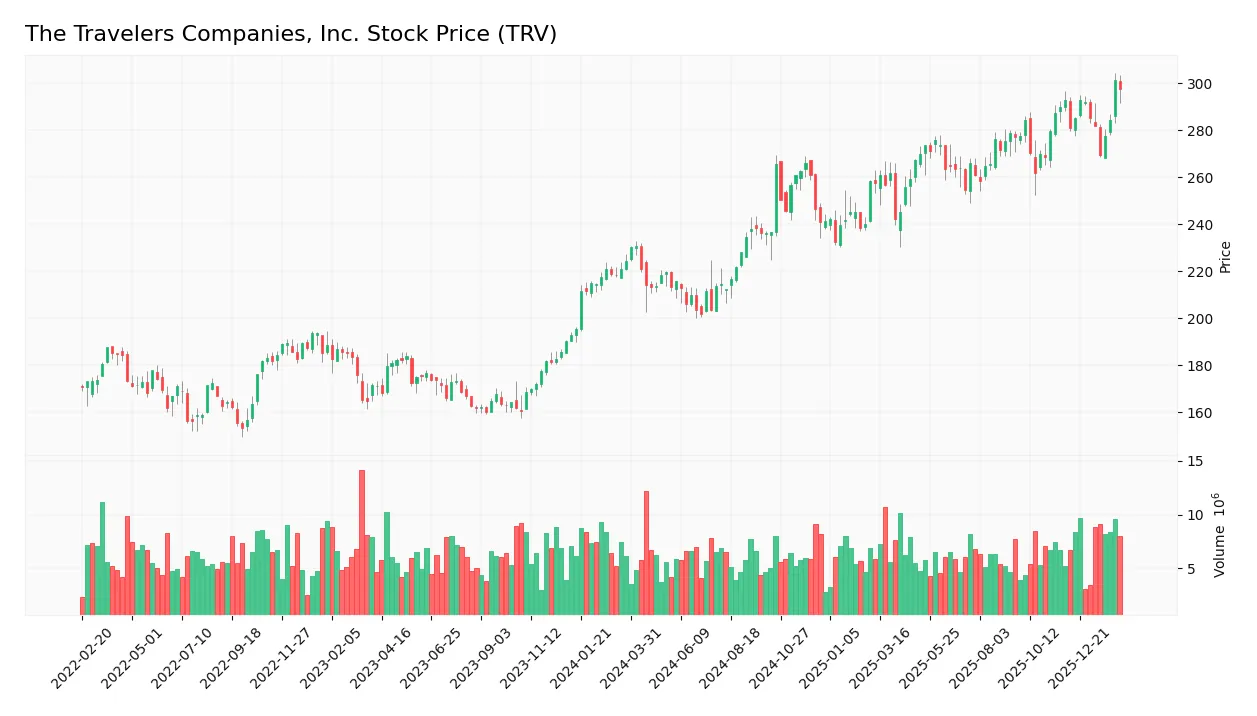
The following weekly stock chart illustrates The Travelers Companies, Inc.’s price movements over the past 12 months:
Trend Analysis
Over the past 12 months, TRV’s stock price rose 32.52%, indicating a bullish trend. Volatility is high with a 25.63 standard deviation. The price peaked at 301.49 and bottomed at 201.87. The upward trend shows deceleration, signaling slower momentum growth recently.
Volume Analysis
Trading volume is increasing, with buyers accounting for 61.2% overall. In the recent three months, buyer dominance eased to 55.83%, indicating a slightly buyer-driven market. This suggests moderate optimism and steady market participation among investors.
Target Prices
Analysts set a bullish consensus on The Travelers Companies, Inc. (TRV) with a tight target range.
| Target Low | Target High | Consensus |
|---|---|---|
| 304 | 317 | 312.75 |
The consensus reflects moderate upside potential, indicating confidence in TRV’s market position and growth prospects.

Don’t Let Luck Decide Your Entry Point
Optimize your entry points with our advanced ProRealTime indicators. You’ll get efficient buy signals with precise price targets for maximum performance. Start outperforming now!
Analyst & Consumer Opinions
This section reviews analyst ratings and consumer feedback to provide a balanced view of The Travelers Companies, Inc. (TRV).
Stock Grades
Here is a detailed overview of The Travelers Companies, Inc. recent analyst grades from recognized firms:
| Grading Company | Action | New Grade | Date |
|---|---|---|---|
| Cantor Fitzgerald | Maintain | Overweight | 2026-02-02 |
| Citigroup | Maintain | Sell | 2026-01-27 |
| Roth Capital | Maintain | Buy | 2026-01-23 |
| Keefe, Bruyette & Woods | Maintain | Outperform | 2026-01-23 |
| Mizuho | Maintain | Neutral | 2026-01-22 |
| Wells Fargo | Maintain | Equal Weight | 2026-01-22 |
| Cantor Fitzgerald | Maintain | Overweight | 2026-01-14 |
| Wells Fargo | Maintain | Equal Weight | 2026-01-13 |
| Barclays | Maintain | Equal Weight | 2026-01-08 |
| JP Morgan | Maintain | Underweight | 2026-01-07 |
The consensus across firms leans toward holding, with a balanced mix of buy and hold ratings and a few sell opinions. Most analysts maintain their previous views, indicating stable sentiment without recent shifts.
Consumer Opinions
Consumer sentiment around The Travelers Companies, Inc. reveals a mix of appreciation and concern. Here’s what users are saying:
| Positive Reviews | Negative Reviews |
|---|---|
| “Excellent claims service with prompt responses.” | “Premiums have increased significantly recently.” |
| “Strong financial stability gives me confidence.” | “Customer support can be slow during peak times.” |
| “Transparent policy options and clear communication.” | “Limited digital tools compared to competitors.” |
Overall, consumers praise Travelers for its reliability and solid claims handling. However, rising premiums and occasional support delays remain consistent pain points.
Risk Analysis
Below is a table summarizing key risks facing The Travelers Companies, Inc. with their likelihood and potential impact:
| Category | Description | Probability | Impact |
|---|---|---|---|
| Liquidity Risk | Current and quick ratios at 0.23 signal tight short-term liquidity. | High | Medium |
| Bankruptcy Risk | Altman Z-score of 0.84 places company in distress zone. | Medium | High |
| Operational Risk | Low asset turnover (0.34) may indicate inefficiencies in asset use. | Medium | Medium |
| Market Risk | Beta of 0.52 suggests lower volatility than market, but sensitivity remains. | Medium | Medium |
| Valuation Risk | Price-to-book ratio near 2 may indicate overvaluation risk. | Medium | Medium |
The most pressing concern is the distress-zone Altman Z-score, signaling financial vulnerability despite solid profitability. The extremely low current ratio heightens liquidity risk, a red flag in an insurance sector that requires ready cash for claims. Investors should weigh these risks against Travelers’ stable ROIC and favorable debt levels.
Should You Buy The Travelers Companies, Inc.?
The Travelers Companies, Inc. appears to be generating strong value creation supported by a very favorable moat with growing ROIC exceeding WACC. Despite a moderate leverage profile and distress-level Altman Z-Score, its overall rating of A suggests robust operational efficiency.
Strength & Efficiency Pillars
The Travelers Companies, Inc. exhibits robust operational efficiency with a net margin of 12.88% and a return on equity (ROE) of 19.12%. Its return on invested capital (ROIC) stands at 12.03%, comfortably exceeding the weighted average cost of capital (WACC) at 5.84%, confirming the company as a clear value creator. These metrics underscore a sustainable competitive advantage, reinforced by a favorable trend in ROIC growth. The company’s profitability and capital allocation strategies demonstrate disciplined execution in a competitive insurance sector.
Weaknesses and Drawbacks
The company currently resides in the Altman Z-Score distress zone with a low score of 0.84, signaling significant financial distress and a heightened risk of bankruptcy. This solvency concern trumps its operational strengths and demands caution. Additionally, liquidity ratios are alarmingly weak, with a current ratio and quick ratio both at 0.23, indicating potential short-term cash flow constraints. While valuation metrics like a price-to-earnings ratio of 10.34 and price-to-book at 1.98 appear reasonable, the critical solvency risks overshadow these positives.
Our Final Verdict about The Travelers Companies, Inc.
Despite solid margins and value creation signals, The Travelers Companies, Inc. faces a substantial solvency risk reflected by its Altman Z-Score of 0.84. This distress status makes the company’s investment profile highly speculative and too risky for conservative capital. Investors might consider waiting for a meaningful improvement in financial health before contemplating exposure. Operational strengths alone do not mitigate the critical bankruptcy risk at this stage.
Disclaimer: This content is for informational purposes only and does not constitute financial, investment, or other professional advice. Investing in financial markets involves a significant risk of loss, and past performance is not indicative of future results.
Additional Resources
- Rhumbline Advisers Sells 6,359 Shares of The Travelers Companies, Inc. $TRV – MarketBeat (Feb 12, 2026)
- Is The Travelers Companies, Inc.’s (NYSE:TRV) Recent Performance Tethered To Its Attractive Financial Prospects? – Yahoo Finance (Feb 07, 2026)
- 15,398 Shares in The Travelers Companies, Inc. $TRV Acquired by Caprock Group LLC – MarketBeat (Feb 12, 2026)
- 2 Reasons to Watch TRV and 1 to Stay Cautious – Finviz (Feb 09, 2026)
- TRV Stock Near 52-Week High: A Signal for Investors to Hold Tight? – Zacks Investment Research (Feb 09, 2026)
For more information about The Travelers Companies, Inc., please visit the official website: travelers.com