Home > Analyses > Consumer Cyclical > The TJX Companies, Inc.
Every day, The TJX Companies, Inc. transforms how millions shop for apparel and home fashions by offering brand-name products at unmatched value. As a dominant force in off-price retail, TJX operates a diverse portfolio including T.J. Maxx, Marshalls, and HomeGoods, blending innovation with a keen sense of consumer trends. I’m intrigued to explore whether its robust market presence and operational strengths still justify its premium valuation and future growth prospects.

Table of contents
Business Model & Company Overview
The TJX Companies, Inc., founded in 1962 and headquartered in Framingham, Massachusetts, dominates the off-price apparel and home fashions retail sector. Its core business operates through a cohesive ecosystem of stores like T.J. Maxx, Marshalls, and HomeGoods across the US, Canada, Europe, and Australia. This network offers a broad range of family apparel, home basics, and accessories, creating a seamless value proposition for cost-conscious consumers seeking quality at discounted prices.
TJX’s revenue engine combines brick-and-mortar retail with growing e-commerce platforms, balancing physical store sales and online demand across key global markets. Its scale—over 4,600 stores worldwide and 364K employees—fuels strong buying power and inventory turnover. This extensive footprint and agile supply chain form a robust economic moat, positioning TJX to shape the future of off-price retail.
Financial Performance & Fundamental Metrics
I will analyze The TJX Companies, Inc.’s income statement, key financial ratios, and dividend payout policy to evaluate its financial health and shareholder value.
Income Statement
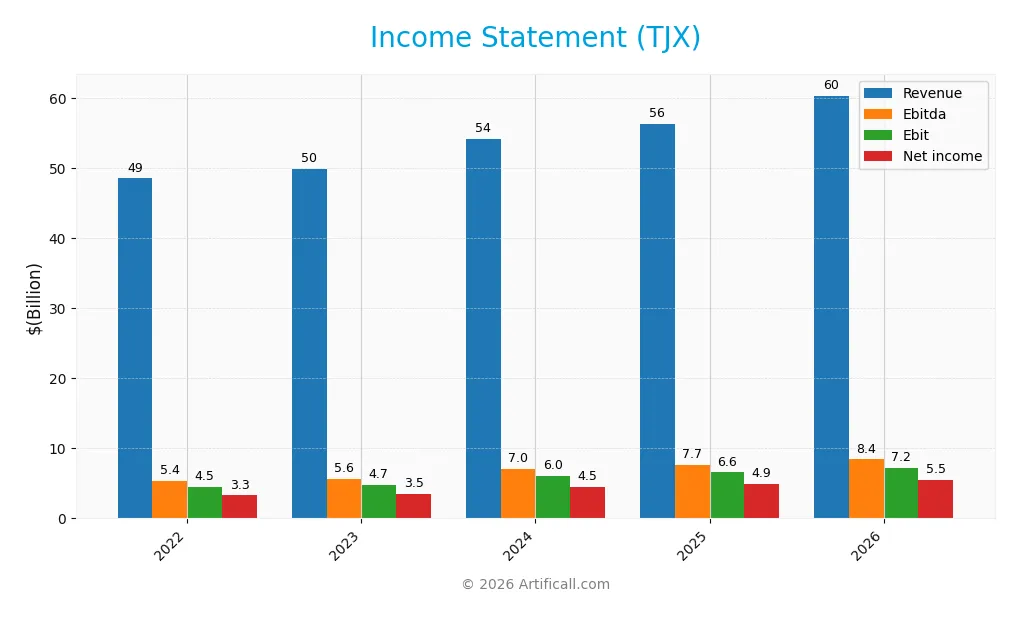
This table summarizes The TJX Companies, Inc.’s key income statement figures for the fiscal years 2022 through 2026. All values are reported in USD.
| 2022 | 2023 | 2024 | 2025 | 2026 | |
|---|---|---|---|---|---|
| Revenue | 48.6B | 49.9B | 54.2B | 56.4B | 60.4B |
| Cost of Revenue | 34.7B | 36.1B | 37.9B | 39.1B | 41.7B |
| Operating Expenses | 9.1B | 8.9B | 10.5B | 10.9B | 11.5B |
| Gross Profit | 13.8B | 13.8B | 16.3B | 17.2B | 18.7B |
| EBITDA | 5.4B | 5.6B | 7.0B | 7.7B | 8.4B |
| EBIT | 4.5B | 4.7B | 6.0B | 6.6B | 7.2B |
| Interest Expense | 119M | 84M | 79M | 76M | 0 |
| Net Income | 3.3B | 3.5B | 4.5B | 4.9B | 5.5B |
| EPS | 2.74 | 3.00 | 3.90 | 4.31 | 4.89 |
| Filing Date | 2022-03-30 | 2023-03-29 | 2024-04-03 | 2025-04-02 | 2026-02-25 |
Income Statement Evolution
From 2022 to 2026, TJX’s revenue rose steadily by 24%, reaching $60.4B in 2026. Net income surged 67% over the period, hitting $5.5B last year. Gross margin improved to 31%, reflecting efficient cost management. EBIT margin expanded to nearly 12%, signaling stronger operational profitability and stable expense control.
Is the Income Statement Favorable?
The 2026 income statement shows robust fundamentals. Revenue grew 7% year-over-year, while gross profit increased 8%, supporting margin expansion. Operating expenses rose in line with revenue, maintaining efficiency. Net margin reached 9.1%, with zero interest expense enhancing profitability. EPS jumped nearly 15%, confirming strong earnings growth and capital allocation effectiveness.
Financial Ratios
The following table summarizes key financial ratios for The TJX Companies, Inc. over the past five fiscal years:
| Ratios | 2022 | 2023 | 2024 | 2025 | 2026 |
|---|---|---|---|---|---|
| Net Margin | 6.76% | 7.00% | 8.25% | 8.63% | 9.10% |
| ROE | 54.69% | 54.97% | 61.27% | 57.95% | 15.36% |
| ROIC | 18.14% | 18.19% | 20.78% | 21.13% | 14.70% |
| P/E | 26.31 | 27.29 | 24.31 | 28.94 | 30.68 |
| P/B | 14.39 | 15.00 | 14.90 | 16.77 | 4.71 |
| Current Ratio | 1.27 | 1.21 | 1.21 | 1.18 | 1.14 |
| Quick Ratio | 0.70 | 0.64 | 0.64 | 0.60 | 0.59 |
| D/E | 2.08 | 2.00 | 1.72 | 1.52 | 0.38 |
| Debt-to-Assets | 44.95% | 44.95% | 42.16% | 40.25% | 37.71% |
| Interest Coverage | 39.96 | 57.86 | 73.38 | 82.92 | 49.08 |
| Asset Turnover | 1.71 | 1.76 | 1.82 | 1.78 | 1.69 |
| Fixed Asset Turnover | 3.44 | 3.36 | 3.40 | 3.32 | 3.25 |
| Dividend Yield | 1.45% | 1.40% | 1.36% | 1.17% | 1.10% |
Evolution of Financial Ratios
Return on Equity (ROE) showed a strong positive trend, peaking near 61% in 2024 before moderating to 15.36% in 2026. The Current Ratio steadily declined from 1.27 in 2022 to 1.14 in 2026, indicating slightly reduced liquidity. Debt-to-Equity Ratio improved notably, dropping from over 2.0 in 2022 to 0.38 in 2026, reflecting deleveraging and enhanced financial stability.
Are the Financial Ratios Favorable?
In 2026, profitability shows mixed signals: ROE and Return on Invested Capital (ROIC) are favorable, outperforming the 6.6% WACC, confirming value creation. Liquidity ratios are neutral to unfavorable; a Current Ratio of 1.14 is adequate, but a Quick Ratio of 0.59 suggests limited short-term coverage. Leverage is favorable with a low Debt-to-Equity of 0.38. Market valuation ratios, including P/E at 30.68 and P/B at 4.71, appear stretched, tempering the overall outlook to slightly favorable.
Shareholder Return Policy
The TJX Companies, Inc. maintains a consistent dividend payout ratio around 33-38%, with dividends per share rising steadily from $1.04 in 2022 to $1.65 in 2026. The annual dividend yield ranges roughly between 1.1% and 1.45%, supported by moderate free cash flow coverage.
TJX also engages in share buybacks, reinforcing its commitment to shareholder returns. This balanced approach, combining dividends and repurchases, appears sustainable and aligns with long-term value creation, given the company’s stable profit margins and manageable leverage ratios.
Score analysis
The following radar chart presents key valuation and profitability scores for The TJX Companies, Inc.:
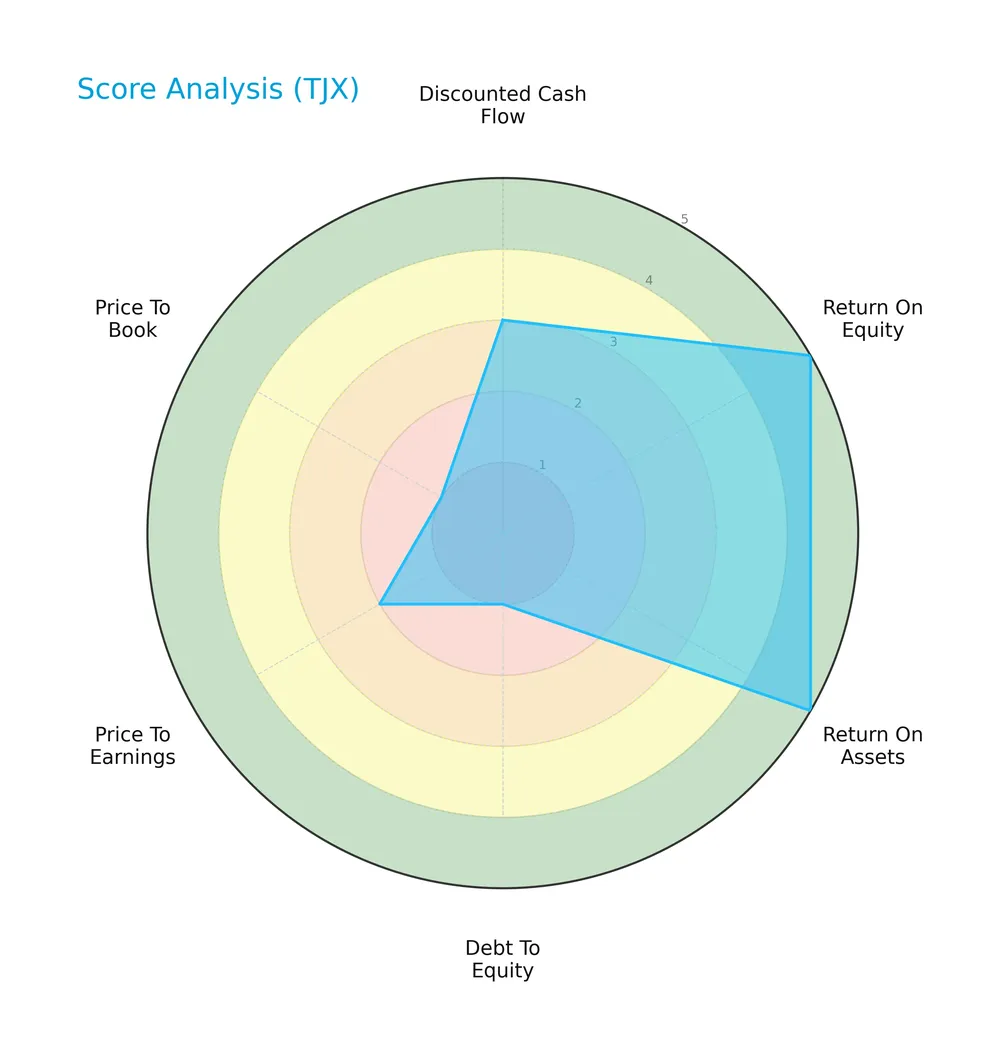
The company scores very favorably on return on equity and assets, indicating strong profitability. However, debt-to-equity, price-to-earnings, and price-to-book scores are very unfavorable or unfavorable, highlighting concerns around leverage and valuation. The discounted cash flow score is moderate.
Analysis of the company’s bankruptcy risk
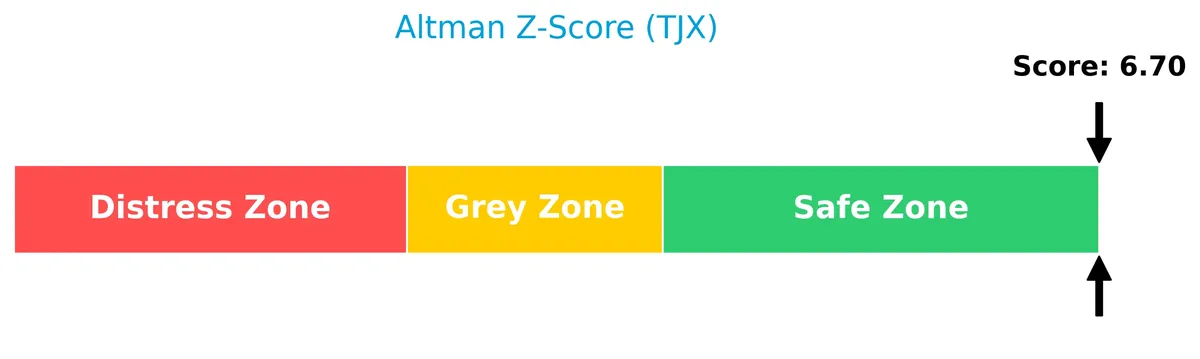
The Altman Z-Score places the company well within the safe zone, signaling a low risk of bankruptcy and strong financial stability:
Is the company in good financial health?
The Piotroski diagram below illustrates the company’s financial strength based on nine criteria:
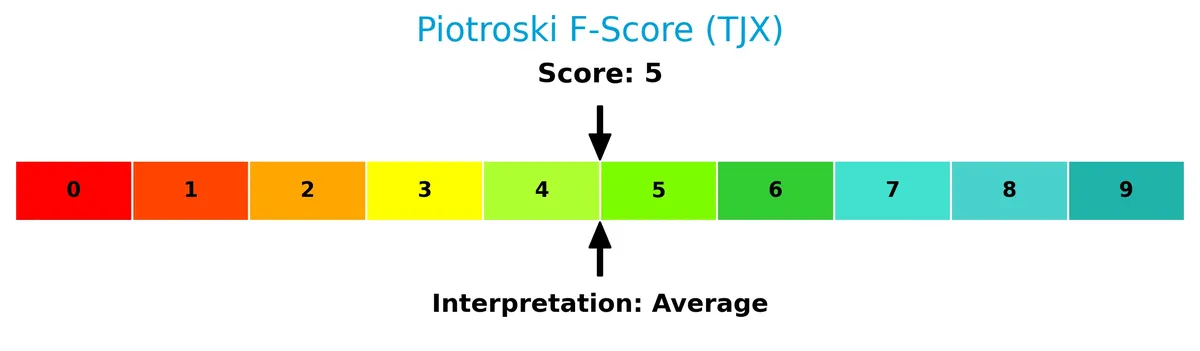
With a Piotroski Score of 5, the company shows average financial health. This suggests moderate strength but room for improvement in profitability, leverage, or efficiency metrics.
Competitive Landscape & Sector Positioning
This section analyzes The TJX Companies, Inc. within the apparel retail sector. It covers strategic positioning, revenue segments, key products, and main competitors. I will assess whether TJX holds a competitive advantage over its rivals.
Strategic Positioning
The TJX Companies, Inc. maintains a diversified product portfolio and geographic footprint. It operates four segments: Marmaxx (largest, $34.6B in 2025), HomeGoods ($9.4B), TJX Canada ($5.2B), and TJX International ($7.2B). This mix balances domestic and international exposure across apparel and home fashions.
Revenue by Segment
This pie chart displays The TJX Companies, Inc.’s revenue distribution by segment for fiscal year 2025, highlighting the relative size of each business unit.
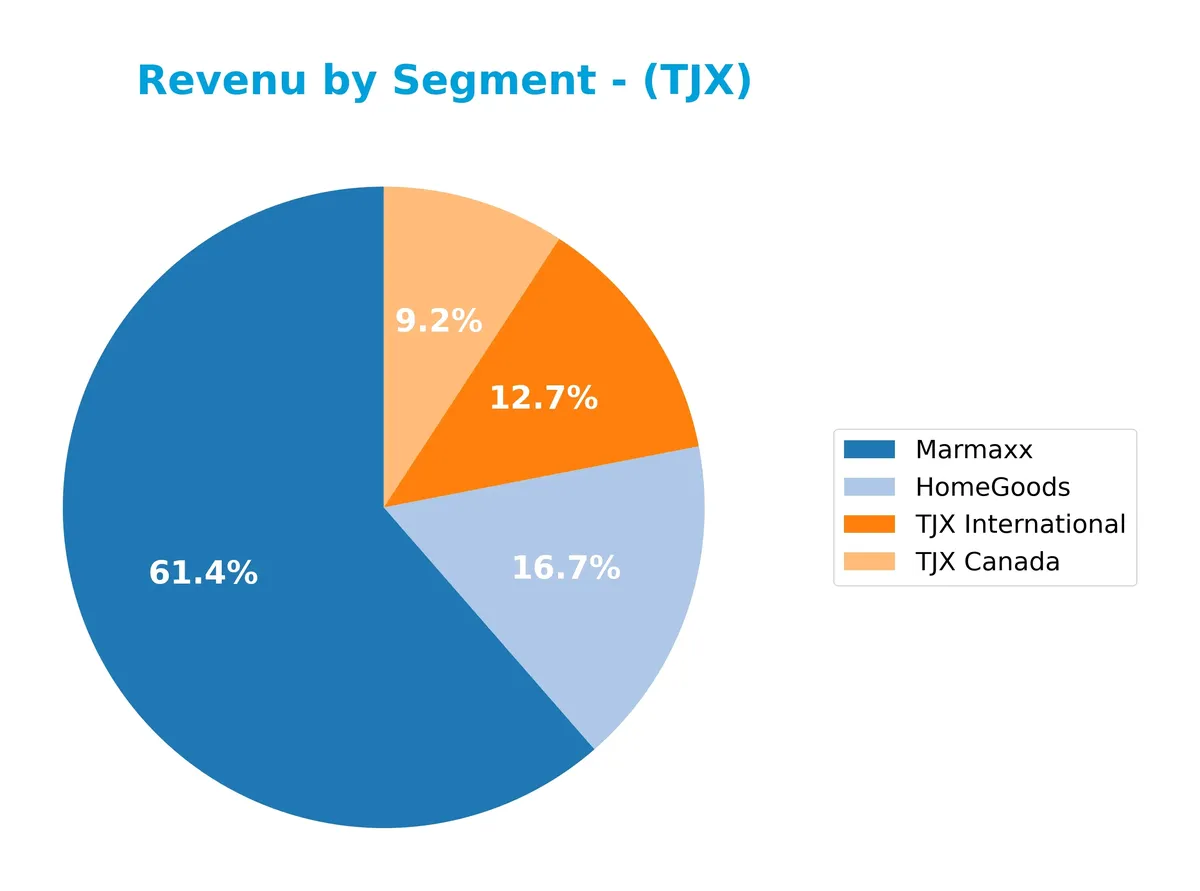
Marmaxx dominates TJX’s revenue with $34.6B in 2025, continuing steady growth from prior years. HomeGoods follows at $9.4B, showing solid expansion. TJX International and TJX Canada contribute $7.2B and $5.2B respectively, reflecting consistent international and regional market strength. The business remains diversified, with no segment showing alarming concentration risk, although Marmaxx clearly drives the top line. Recent acceleration in HomeGoods and TJX International suggests expanding moats in lifestyle and global retail.
Key Products & Brands
The TJX Companies, Inc. operates multiple retail segments and brands focused on apparel and home fashions:
| Product | Description |
|---|---|
| Marmaxx | Family apparel, footwear, accessories sold mainly through T.J. Maxx and Marshalls stores. |
| HomeGoods | Home fashions including furniture, rugs, lighting, giftware, cookware, and decorative items. |
| TJX Canada | Canadian retail operations featuring Winners, HomeSense, and Marshalls stores. |
| TJX International | International retail presence in Europe and Australia under T.K. Maxx and Homesense brands. |
TJX’s product portfolio spans apparel and home goods across distinct geographic segments. Marmaxx leads revenue, reflecting strong consumer demand for off-price apparel. HomeGoods and international units show steady growth, diversifying TJX’s retail footprint.
Main Competitors
There are 3 main competitors in the Apparel – Retail industry. The table below lists the top 3 leaders by market capitalization:
| Competitor | Market Cap. |
|---|---|
| The TJX Companies, Inc. | 172B |
| Ross Stores, Inc. | 59B |
| Lululemon Athletica Inc. | 24B |
The TJX Companies, Inc. ranks first among its three competitors with a market cap 1% above the leader benchmark. Its capitalization is well above both the average market cap of the top 10 in the sector (85B) and the median (59B). The distance to the next competitor below is significant at -192%, underscoring TJX’s dominant scale in the sector.
Comparisons with competitors
Check out how we compare the company to its competitors:
Does TJX have a competitive advantage?
TJX demonstrates a competitive advantage by creating value with an ROIC exceeding its WACC by 8.1%, indicating efficient capital use and consistent profitability. However, its ROIC trend shows a near 19% decline, signaling waning profitability that investors should monitor closely.
Looking ahead, TJX benefits from a diverse brand portfolio spanning multiple retail segments and geographies, supporting resilience and growth. Opportunities lie in expanding online channels and international stores to capture evolving consumer preferences and new markets.
SWOT Analysis
This SWOT analysis highlights The TJX Companies, Inc.’s key internal and external factors to guide strategic decisions.
Strengths
- Strong market position in off-price retail
- Favorable ROIC well above WACC
- Robust revenue and earnings growth
Weaknesses
- Declining ROIC trend signals profitability pressure
- High P/E and P/B ratios suggest valuation risk
- Low quick ratio indicates liquidity concerns
Opportunities
- Expansion in international markets
- Growing demand for value apparel and home goods
- E-commerce growth potential
Threats
- Intense competition in retail apparel
- Economic downturns impacting consumer spending
- Supply chain disruptions affecting inventory
TJX benefits from steady growth and value creation but faces margin pressure and liquidity risks. Its strategy should focus on enhancing operational efficiency and leveraging international and e-commerce expansion while managing competitive and macroeconomic headwinds.
Stock Price Action Analysis
The following weekly stock chart illustrates The TJX Companies, Inc.’s price movements and volatility over the past 12 months:
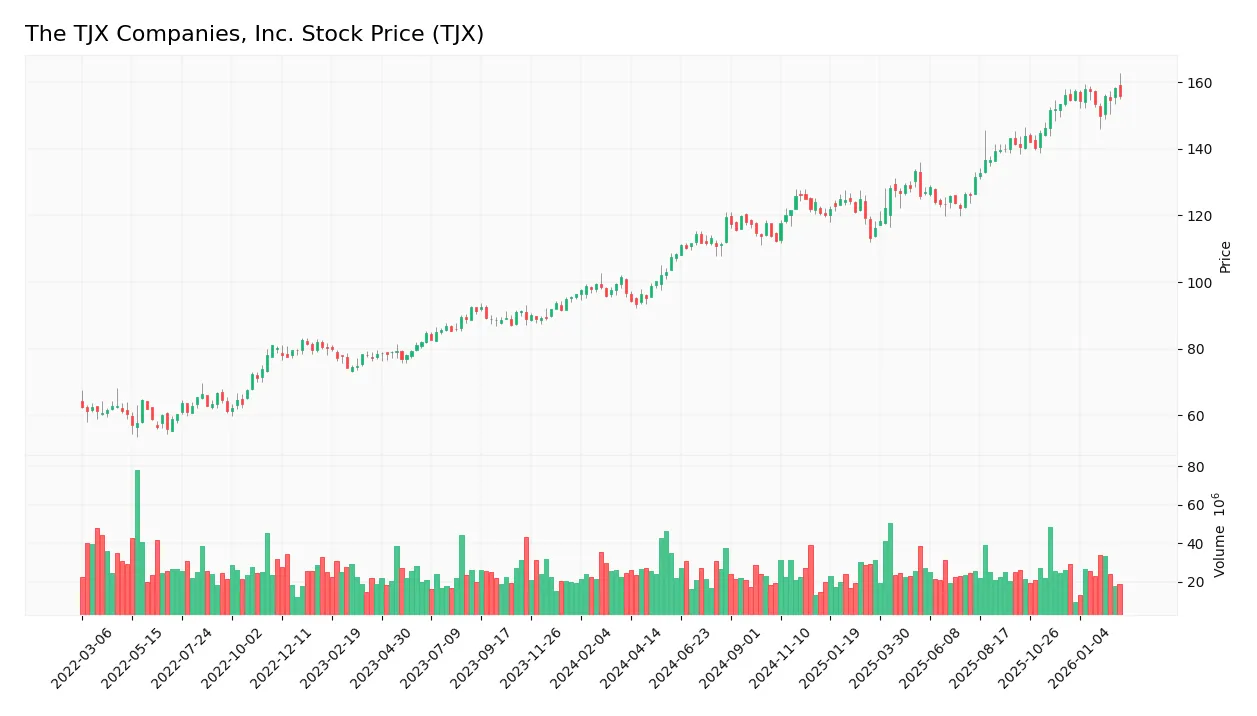
Trend Analysis
Over the past 12 months, TJX’s stock price rose 60.95%, confirming a bullish trend with decelerating momentum. The price ranged between 93.36 and 158.23, reflecting notable volatility (std dev 16.48). However, the recent three-month trend showed a slight decline of 0.2%, indicating a neutral short-term slope (-0.03).
Volume Analysis
Trading volume over the last three months decreased, with sellers slightly dominating at 59.63%. Buyer volume accounted for 113M shares versus 167M sellers, suggesting waning investor enthusiasm and a modest shift toward supply pressure despite the overall buyer advantage year-to-date.
Target Prices
Analysts set a solid target consensus for TJX, reflecting confidence in its growth trajectory.
| Target Low | Target High | Consensus |
|---|---|---|
| 150 | 193 | 172 |
The target range from 150 to 193 suggests an upside potential above the current price. The consensus at 172 indicates moderate optimism about TJX’s market position and earnings power.

Don’t Let Luck Decide Your Entry Point
Optimize your entry points with our advanced ProRealTime indicators. You’ll get efficient buy signals with precise price targets for maximum performance. Start outperforming now!
Analyst & Consumer Opinions
This section reviews analyst ratings and consumer feedback to provide insights on The TJX Companies, Inc.’s market perception.
Stock Grades
The following table summarizes recent verified analyst grades for The TJX Companies, Inc., highlighting consistent sentiment from top firms:
| Grading Company | Action | New Grade | Date |
|---|---|---|---|
| JP Morgan | Maintain | Overweight | 2026-02-23 |
| Telsey Advisory Group | Maintain | Outperform | 2026-02-18 |
| UBS | Maintain | Buy | 2026-01-08 |
| Wells Fargo | Maintain | Equal Weight | 2025-12-16 |
| Barclays | Maintain | Overweight | 2025-12-04 |
| Baird | Maintain | Outperform | 2025-12-04 |
| Telsey Advisory Group | Maintain | Outperform | 2025-12-04 |
| Evercore ISI Group | Maintain | Outperform | 2025-11-20 |
| B of A Securities | Maintain | Buy | 2025-11-20 |
| Bernstein | Maintain | Outperform | 2025-11-20 |
Analyst grades show a clear consensus favoring the stock, predominantly in the Buy to Outperform range, with only one Equal Weight and one Sell. This signals steady confidence across multiple reputable institutions.
Consumer Opinions
Consumer sentiment around The TJX Companies, Inc. reflects a strong appreciation for value and variety. Here’s a snapshot of what shoppers say:
| Positive Reviews | Negative Reviews |
|---|---|
| “Great deals on brand-name apparel every visit.” | “Store layouts can be confusing and cluttered.” |
| “Consistently excellent customer service.” | “Limited stock on popular sizes and items.” |
| “Enjoy the treasure hunt experience with new finds.” | “Checkout lines sometimes move slowly.” |
Overall, consumers praise TJX’s value proposition and diverse product mix. However, recurring complaints about store organization and stock availability suggest room for operational improvements.
Risk Analysis
Below is a summary table of key risks affecting The TJX Companies, Inc., with their likelihood and potential impact:
| Category | Description | Probability | Impact |
|---|---|---|---|
| Valuation Risk | Elevated P/E (30.68) and P/B (4.71) ratios indicate expensive stock. | Medium | High |
| Liquidity Risk | Low quick ratio (0.59) signals possible short-term liquidity pressure. | Medium | Medium |
| Leverage Risk | Debt-to-equity score very unfavorable; moderate debt levels (D/E 0.38). | Medium | Medium |
| Market Volatility | Beta of 0.74 shows below-average sensitivity to market swings. | Low | Low |
| Competitive Risk | Retail sector competition could pressure margins and growth. | Medium | Medium |
Valuation risk stands out as the most significant. Despite strong ROE (15.36%) and ROIC (14.7%) well above the 6.6% WACC, the high multiples suggest the market prices in robust growth. The quick ratio below 1 warns of limited short-term asset coverage. Meanwhile, TJX’s Altman Z-Score (6.7) confirms strong financial stability, mitigating bankruptcy concerns. Investors should weigh valuation premiums against liquidity and leverage risks carefully.
Should You Buy The TJX Companies, Inc.?
The TJX Companies, Inc. appears to be a moderately profitable firm with a slightly favorable moat, as it creates value despite declining ROIC. While its leverage profile could be seen as substantial, the overall rating suggests a very favorable investment profile tempered by valuation concerns.
Strength & Efficiency Pillars
The TJX Companies, Inc. delivers solid operational efficiency, with a net margin of 9.1% and a return on equity of 15.36%. Its return on invested capital (ROIC) stands at 14.7%, comfortably surpassing its weighted average cost of capital (WACC) at 6.6%, confirming that the company is a clear value creator. Additionally, a gross margin of 30.96% and an EBIT margin of 11.89% highlight robust profitability. These metrics demonstrate TJX’s ability to generate returns well above its capital costs, underpinning sustainable value creation.
Weaknesses and Drawbacks
While the financial footing is stable, valuation metrics present challenges. The price-to-earnings ratio at 30.68 signals a premium valuation, raising concerns about potential overextension. The price-to-book ratio of 4.71 corroborates this elevated pricing, suggesting limited margin of safety. Liquidity indicators are mixed: a current ratio of 1.14 is adequate, but a quick ratio of 0.59 flags potential short-term liquidity constraints. Although debt-to-equity at 0.38 is favorable, recent seller dominance at 59.63% could impose short-term price pressure and volatility.
Our Final Verdict about The TJX Companies, Inc.
TJX’s fundamentals appear attractive, reflecting strong profitability and disciplined capital allocation. Despite a bullish long-term price trend with a 60.95% gain, recent slight seller dominance suggests caution. Investors might consider a wait-and-see approach to identify a more favorable entry point. The company’s solid solvency profile, evidenced by an Altman Z-Score of 6.70 in the safe zone, supports confidence in its financial resilience and ongoing value creation potential.
Disclaimer: This content is for informational purposes only and does not constitute financial, investment, or other professional advice. Investing in financial markets involves a significant risk of loss, and past performance is not indicative of future results.
Additional Resources
- Why shares of TJX Companies hit an all-time high in Feb. 25 trading – MetroWest Daily News (Feb 25, 2026)
- The TJX Companies, Inc. Reports Q4 and Full Year FY26 Results; Q4 Comp Sales Growth, Pretax Profit Margin, and Diluted EPS All Well Above Plan; Expects to Increase Dividend by 13% and Buy Back $2.50 to $2.75 Billion of Stock in FY27 – Business Wire (Feb 25, 2026)
- TJX Q4 Earnings and Revenues Beat Estimates, Sales Increase 9% Y/Y – The Globe and Mail (Feb 26, 2026)
- The TJX Companies, Inc. Announces Advance In Q4 Profit – Nasdaq (Feb 25, 2026)
- TJX Companies reports strong demand for off-price apparel (TJX:NYSE) – Seeking Alpha (Feb 25, 2026)
For more information about The TJX Companies, Inc., please visit the official website: tjx.com