Home > Analyses > Utilities > The Southern Company
The Southern Company powers millions of homes and businesses across the Southeast, seamlessly blending traditional and renewable energy sources. Its vast portfolio spans hydroelectric, nuclear, solar, and wind facilities, making it a cornerstone in the regulated electric sector. Renowned for operational excellence and innovation, Southern Company shapes the future of energy delivery. Yet, as market dynamics evolve, I question whether its current fundamentals justify its sizable valuation and growth ambitions.

Table of contents
Business Model & Company Overview
The Southern Company, founded in 1945 and headquartered in Atlanta, Georgia, stands as a major player in the regulated electric industry. It operates a vast ecosystem of power generation, transmission, and distribution assets, including renewable energy facilities and natural gas infrastructure. Serving 8.7M electric and gas customers, it integrates traditional and clean energy solutions to fulfill its core mission of reliable utility service across multiple states.
Its revenue engine balances regulated electric utility operations with gas distribution, pipeline investments, and wholesale gas services. The company’s portfolio spans 30 hydroelectric, 24 fossil fuel, and 45 solar facilities, plus extensive natural gas pipelines totaling 76K miles. Operating across the Americas, The Southern Company leverages its competitive advantage in infrastructure scale and diversified energy sources, cementing a durable economic moat within the utilities sector.
Financial Performance & Fundamental Metrics
I analyze The Southern Company’s income statement, key financial ratios, and dividend payout policy to assess its underlying profitability and shareholder value creation.
Income Statement
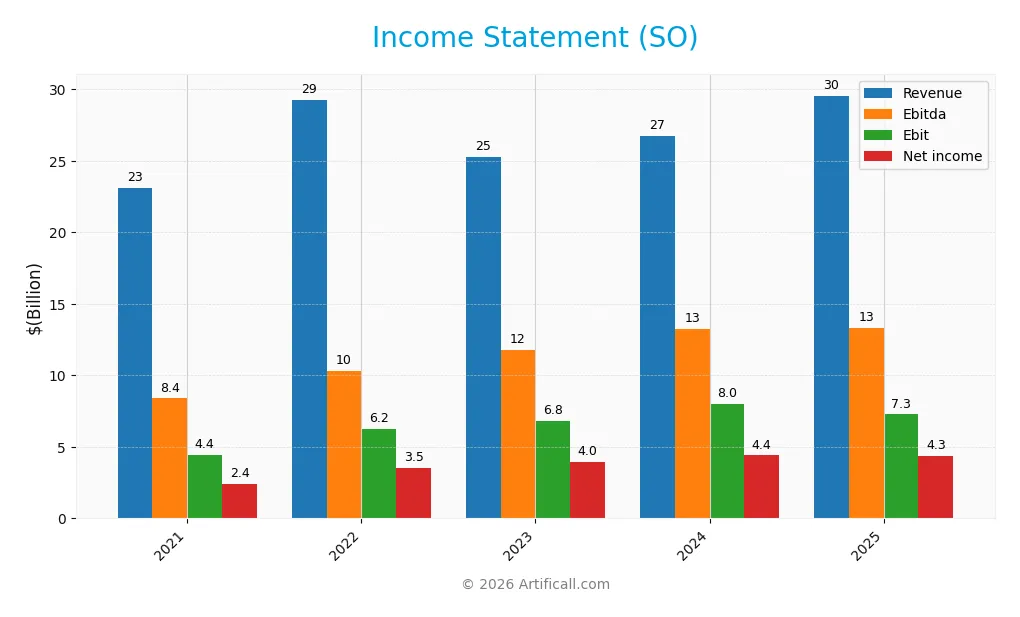
The table below presents The Southern Company’s key income statement figures for fiscal years 2021 through 2025, reported in USD.
| 2021 | 2022 | 2023 | 2024 | 2025 | |
|---|---|---|---|---|---|
| Revenue | 23.1B | 29.3B | 25.3B | 26.7B | 29.6B |
| Cost of Revenue | 12.9B | 18.7B | 13.5B | 13.4B | 7.5B |
| Operating Expenses | 6.5B | 5.3B | 5.9B | 6.3B | 22.3B |
| Gross Profit | 10.2B | 10.6B | 11.7B | 13.3B | 22.1B |
| EBITDA | 8.4B | 10.3B | 11.8B | 13.2B | 13.3B |
| EBIT | 4.4B | 6.2B | 6.8B | 8.0B | 7.3B |
| Interest Expense | 1.8B | 2.0B | 2.4B | 2.7B | 3.3B |
| Net Income | 2.4B | 3.5B | 4.0B | 4.4B | 4.3B |
| EPS | 2.26 | 3.28 | 3.64 | 4.02 | 3.94 |
| Filing Date | 2022-02-17 | 2023-02-16 | 2023-12-31 | 2025-02-20 | 2026-02-19 |
Income Statement Evolution
From 2021 to 2025, Southern Company’s revenue grew by 28% to $29.6B, with net income rising 80% to $4.3B. Gross margin improved significantly, reaching 74.7% in 2025. However, EBIT declined 8.8% in the last year, and net margin contracted 10.8%, indicating some pressure on profitability despite top-line expansion.
Is the Income Statement Favorable?
In 2025, fundamentals show mixed signals. Revenue growth of 10.6% is robust, supporting a favorable gross margin of 74.7%. EBIT margin remains strong at 24.6%, but interest expense at 11.2% of revenue is an unfavorable drag. Net margin stands at a healthy 14.7%, though it has slightly contracted. Overall, the income statement is broadly favorable, reflecting solid operational results tempered by financing costs.
Financial Ratios
The table below presents key financial ratios for The Southern Company over the last five fiscal years, highlighting profitability, liquidity, leverage, and valuation metrics:
| Ratios | 2021 | 2022 | 2023 | 2024 | 2025 |
|---|---|---|---|---|---|
| Net Margin | 10% | 12% | 16% | 16% | 15% |
| ROE | 9% | 12% | 13% | 13% | 12% |
| ROIC | 3% | 3% | 4% | 4% | 5% |
| P/E | 30.2 | 21.7 | 19.3 | 20.5 | 22.2 |
| P/B | 2.58 | 2.52 | 2.44 | 2.72 | 2.67 |
| Current Ratio | 0.82 | 0.66 | 0.77 | 0.67 | 0.65 |
| Quick Ratio | 0.61 | 0.49 | 0.53 | 0.46 | 0.45 |
| D/E | 1.97 | 1.94 | 2.02 | 2.00 | 1.83 |
| Debt-to-Assets | 43% | 44% | 46% | 46% | 42% |
| Interest Coverage | 2.01 | 2.66 | 2.38 | 2.58 | 2.20 |
| Asset Turnover | 0.18 | 0.22 | 0.18 | 0.18 | 0.19 |
| Fixed Asset Turnover | 0.25 | 0.30 | 0.25 | 0.25 | 0.26 |
| Dividend Yield | 3.8% | 3.8% | 4.0% | 3.3% | 3.1% |
Evolution of Financial Ratios
The Southern Company’s Return on Equity (ROE) showed moderate fluctuations, peaking in 2024 before easing slightly to 12.05% in 2025. The Current Ratio steadily declined from 0.82 in 2021 to 0.65 in 2025, indicating weakening short-term liquidity. Debt-to-Equity remained high and relatively stable, around 1.8 to 2.0, signaling persistent leverage without significant improvement in profitability margins.
Are the Financial Ratios Fovorable?
In 2025, Southern Company’s net margin of 14.7% is favorable, reflecting solid profitability. However, ROIC at 4.55% falls below WACC at 5.24%, marking an unfavorable capital efficiency. Liquidity ratios, including current (0.65) and quick (0.45), are unfavorable, suggesting potential short-term risk. Leverage is high with a debt-to-equity ratio of 1.83, rated unfavorable. Market valuation ratios such as P/E (22.16) and P/B (2.67) are neutral, while dividend yield (3.13%) remains favorable. Overall, the ratio profile is slightly unfavorable.
Shareholder Return Policy
The Southern Company maintains a dividend payout ratio near 70%, with dividends per share rising modestly to $2.73 in 2025, yielding about 3.13% annually. Share buybacks are also part of the capital return strategy, supported by consistent free cash flow coverage.
This policy balances steady income with capital allocation prudence, although the payout ratio suggests limited buffer against profit volatility. The combined dividend and buyback approach appears aligned with sustainable long-term shareholder value, given the company’s stable cash generation.
Score analysis
The radar chart below presents a comprehensive view of the company’s key financial scores:
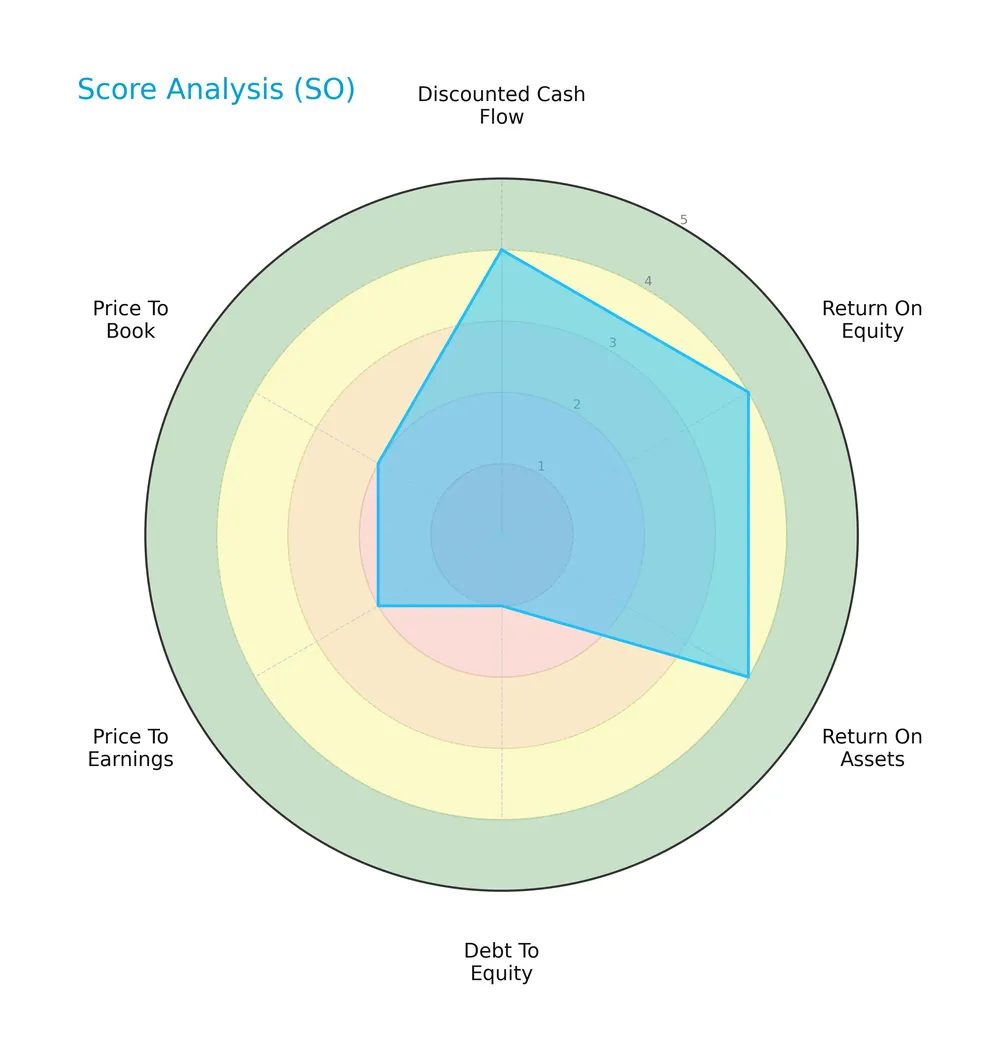
The company scores favorably on discounted cash flow, return on equity, and return on assets, each rated 4. However, its debt-to-equity score is very unfavorable at 1, with price-to-earnings and price-to-book scores also on the lower side at 2. The overall score is moderate at 3.
Analysis of the company’s bankruptcy risk
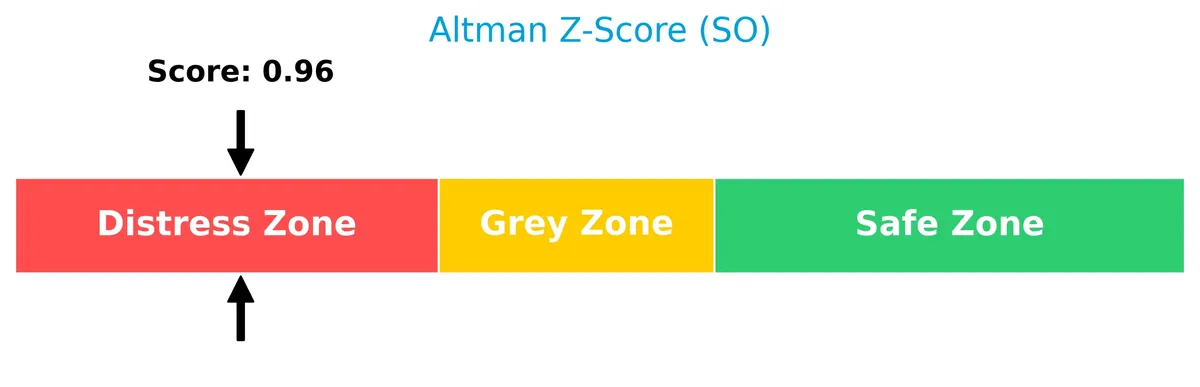
The Altman Z-Score places the company in the distress zone, indicating a high risk of bankruptcy and financial instability:
Is the company in good financial health?
The Piotroski Score diagram illustrates the company’s financial health based on nine key accounting criteria:

With a Piotroski Score of 6, the company shows average financial strength. This suggests moderate profitability and operational efficiency but leaves room for improvement in financial robustness.
Competitive Landscape & Sector Positioning
This sector analysis reviews The Southern Company’s strategic positioning, revenue segments, and key products. I will assess whether the company holds a competitive advantage over its main competitors.
Strategic Positioning
The Southern Company maintains a diversified portfolio across gas distribution, marketing, pipeline investments, and electric utilities. It operates regionally in the US with significant power generation assets including renewables, serving 8.7M utility customers and managing extensive gas infrastructure.
Revenue by Segment
This pie chart illustrates The Southern Company’s revenue distribution by segment for fiscal year 2025, highlighting the business’s core operational areas and their relative contributions.
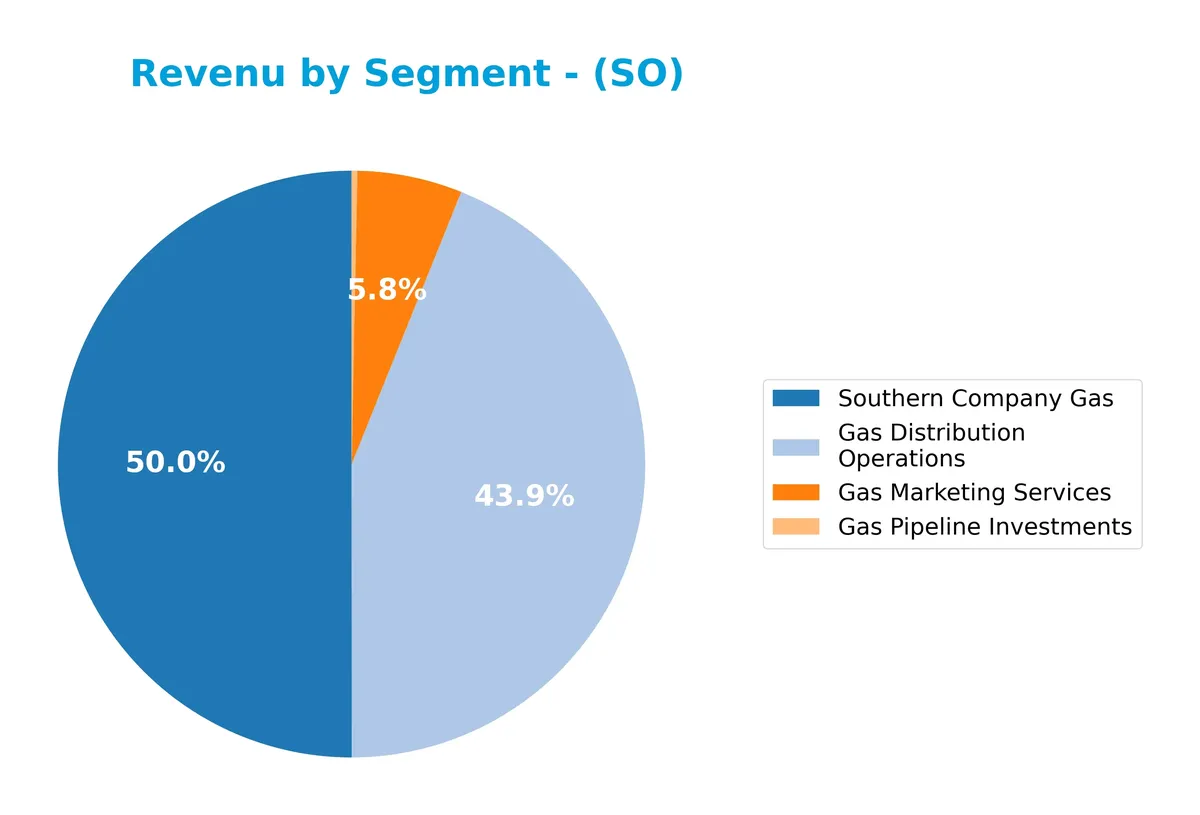
In 2025, Southern Company Gas dominates with $5B in revenue, driven by Gas Distribution Operations at $4.4B and Gas Marketing Services at $580M. The Gas Pipeline Investments segment remains minor at $32M. Compared to 2024, revenues in key gas segments accelerated, signaling growing reliance on gas operations. The concentration in gas-related segments suggests moderate concentration risk, despite steady diversification within the gas portfolio.
Key Products & Brands
The Southern Company’s key products and brands span electricity generation and natural gas services across multiple segments:
| Product | Description |
|---|---|
| Gas Distribution Operations | Distribution of natural gas to residential, commercial, and industrial customers in several states. |
| Gas Marketing Services | Marketing and wholesale services for natural gas, supporting commercial and industrial sales. |
| Gas Pipeline Investments | Ownership and operation of natural gas pipelines and storage facilities. |
| Southern Company Gas | Combined operations related to natural gas distribution, marketing, and pipeline investments. |
| Electric Utilities | Generation, transmission, and distribution of electricity through various power stations and renewable assets. |
| Southern Power | Power generation assets including renewable energy projects and wholesale electricity sales. |
These segments reflect Southern Company’s integrated approach to regulated electric and natural gas markets, serving approximately 8.7 million utility customers.
Main Competitors
The Utilities sector in Regulated Electric includes 23 competitors, with the table listing the top 10 leaders by market capitalization:
| Competitor | Market Cap. |
|---|---|
| NextEra Energy, Inc. | 169B |
| The Southern Company | 96B |
| Duke Energy Corporation | 91B |
| American Electric Power Company, Inc. | 62B |
| Dominion Energy, Inc. | 51B |
| Exelon Corporation | 44B |
| Xcel Energy Inc. | 44B |
| Entergy Corporation | 42B |
| Public Service Enterprise Group Incorporated | 40B |
| Consolidated Edison, Inc. | 36B |
The Southern Company ranks 2nd among 23 competitors, with a market cap at 62% of the leader, NextEra Energy. It stands above both the average market cap of the top 10 peers (67.5B) and the sector median (34B). The company leads its closest rival, Duke Energy, by a significant 62%, reinforcing its strong position in the sector.
Comparisons with competitors
Check out how we compare the company to its competitors:
Does SO have a competitive advantage?
The Southern Company currently lacks a strong competitive advantage, as its ROIC falls slightly below its WACC, indicating value destruction despite improving profitability. This suggests challenges in efficiently deploying capital relative to its cost.
Looking ahead, SO’s diverse power generation portfolio, including renewable energy and extensive natural gas infrastructure, positions it to capitalize on evolving energy markets and regulatory opportunities in clean energy and gas distribution.
SWOT Analysis
This SWOT analysis highlights The Southern Company’s strategic position by identifying key internal and external factors shaping its future.
Strengths
- diversified energy portfolio
- strong gross margin at 74.7%
- stable dividend yield at 3.13%
Weaknesses
- low liquidity ratios (current ratio 0.65, quick ratio 0.45)
- ROIC below WACC indicating value destruction
- high debt-to-equity ratio at 1.83
Opportunities
- growth in renewable energy assets
- expanding gas pipeline infrastructure
- increasing demand for clean energy solutions
Threats
- regulatory risks in utilities sector
- rising interest expenses at 11.18% of EBIT
- competition from decentralized energy producers
The Southern Company benefits from a robust asset base and steady cash flows but struggles with financial leverage and capital efficiency. Strategic focus on renewable expansion must be balanced with prudent debt management to mitigate regulatory and market risks.
Stock Price Action Analysis
The weekly stock chart of The Southern Company (SO) highlights price movements and key levels over the past 100 weeks:
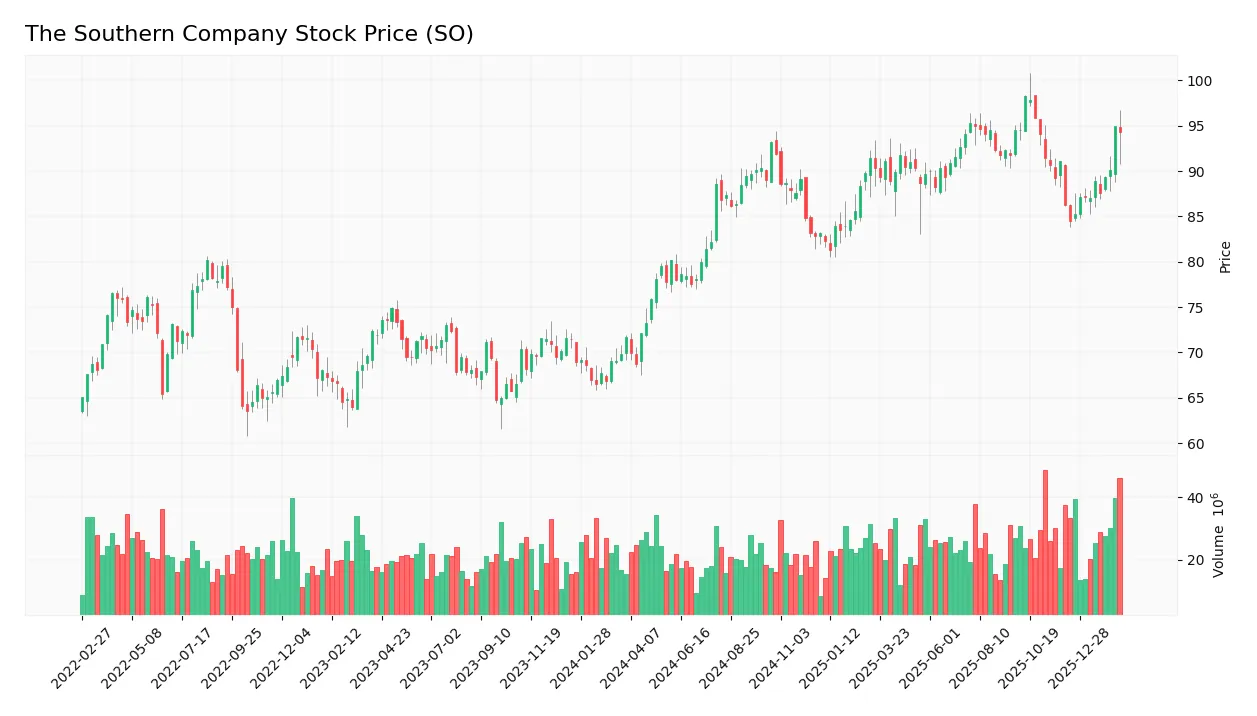
Trend Analysis
Over the past 12 months, SO’s stock price rose by 31.45%, indicating a clear bullish trend with accelerating momentum. The price ranged between a low of 68.73 and a high of 98.29. Volatility remains moderate, with a standard deviation of 6.16, confirming steady upward movement.
Volume Analysis
Trading volume shows an increasing trend, with buyer activity slightly dominant at 53.36% in the recent three months. This mild buyer dominance and rising volume suggest growing investor confidence and participation in SO’s shares.
Target Prices
Analysts set a clear target consensus for The Southern Company, reflecting moderate upside potential.
| Target Low | Target High | Consensus |
|---|---|---|
| 76 | 105 | 96.36 |
The target range suggests cautious optimism, with analysts expecting a steady appreciation aligned with sector trends.

Don’t Let Luck Decide Your Entry Point
Optimize your entry points with our advanced ProRealTime indicators. You’ll get efficient buy signals with precise price targets for maximum performance. Start outperforming now!
Analyst & Consumer Opinions
This section examines analyst grades and consumer feedback related to The Southern Company (SO) to provide balanced insights.
Stock Grades
Here are the latest verified grades from reputable financial institutions for The Southern Company:
| Grading Company | Action | New Grade | Date |
|---|---|---|---|
| Scotiabank | Maintain | Sector Perform | 2026-02-20 |
| Mizuho | Upgrade | Outperform | 2026-02-20 |
| Wells Fargo | Upgrade | Equal Weight | 2026-02-20 |
| Wells Fargo | Downgrade | Underweight | 2026-01-20 |
| Barclays | Maintain | Equal Weight | 2026-01-15 |
| UBS | Maintain | Neutral | 2025-12-17 |
| Jefferies | Maintain | Neutral | 2025-12-15 |
| JP Morgan | Maintain | Neutral | 2025-12-15 |
| Keybanc | Maintain | Underweight | 2025-12-12 |
| RBC Capital | Maintain | Sector Perform | 2025-12-12 |
The recent trend shows a modest shift toward more positive ratings, including upgrades from Mizuho and Wells Fargo. However, most firms maintain a neutral or cautious stance, reflecting a balanced market view.
Consumer Opinions
Consumer sentiment around The Southern Company (SO) reflects a mixture of appreciation and frustration.
| Positive Reviews | Negative Reviews |
|---|---|
| Reliable energy supply even during peak demand. | Occasional billing errors causing customer confusion. |
| Responsive customer service with helpful staff. | Slow resolution times for service outages. |
| Competitive pricing compared to regional peers. | Limited options for renewable energy plans. |
Overall, consumers praise The Southern Company for dependable service and competitive rates. However, recurring complaints focus on billing accuracy and slower outage responses, signaling areas needing operational improvement.
Risk Analysis
Below is a detailed table summarizing key risks facing The Southern Company in 2026:
| Category | Description | Probability | Impact |
|---|---|---|---|
| Financial Health | Altman Z-Score of 0.96 signals high bankruptcy risk (Distress Zone) | High | Severe |
| Liquidity | Current ratio at 0.65 and quick ratio at 0.45 indicate weak liquidity | High | Moderate |
| Leverage | Debt-to-equity ratio of 1.83 is high, raising solvency concerns | High | High |
| Profitability | ROIC (4.55%) below WACC (5.24%) suggests value destruction | Moderate | High |
| Market Valuation | PE and PB ratios neutral but not compelling for growth investors | Moderate | Moderate |
| Operational Efficiency | Low asset turnover (0.19) and fixed asset turnover (0.26) | Moderate | Moderate |
| Dividend Sustainability | Dividend yield 3.13% favorable, but cash flow constraints loom | Moderate | Moderate |
The most pressing risk is the distressed financial health indicated by the Altman Z-Score below 1.8, signaling a high probability of bankruptcy. This is coupled with weak liquidity and excessive leverage, which historically in utilities can precede credit rating downgrades and higher borrowing costs. Additionally, Southern Company’s ROIC below its WACC implies it struggles to generate returns above capital costs, risking shareholder value erosion if this persists. These combined factors warrant cautious risk management despite the company’s stable market position.
Should You Buy The Southern Company?
The Southern Company appears to have improving profitability and operational efficiency but is shedding value relative to its cost of capital, suggesting a slightly unfavorable moat. Despite significant leverage and liquidity concerns, its overall rating is a very favorable B, reflecting moderate investment appeal.
Strength & Efficiency Pillars
The Southern Company exhibits solid operational efficiency with a robust gross margin of 74.7% and an EBIT margin of 24.6%. Its net margin stands at a favorable 14.69%, reflecting disciplined cost management. Although the return on equity is a neutral 12.05%, the company’s return on invested capital (ROIC) at 4.55% trails its weighted average cost of capital (WACC) at 5.24%, indicating it is currently shedding value despite growing profitability trends.
Weaknesses and Drawbacks
The company is in financial distress, as signaled by an Altman Z-Score of 0.96, placing it deep in the “Distress Zone” and implying a high bankruptcy risk. Leverage is a critical concern, with a debt-to-equity ratio of 1.83 and weak liquidity reflected in a current ratio of 0.65. These metrics expose vulnerability to tightening credit conditions. Valuation ratios are neutral but highlight limited margin for error. Interest expense remains high at 11.18%, further pressuring earnings.
Our Final Verdict about The Southern Company
Despite operational strengths, The Southern Company’s solvency risk makes its profile highly speculative and too risky for conservative capital. The distress zone Z-Score overshadows favorable margins and growth. Investors should apply caution until financial health improves. The company’s challenges in leverage and liquidity temper any appeal from its bullish stock trend and modest buyer dominance.
Disclaimer: This content is for informational purposes only and does not constitute financial, investment, or other professional advice. Investing in financial markets involves a significant risk of loss, and past performance is not indicative of future results.
Additional Resources
- Southern Company reports fourth-quarter and full-year 2025 earnings – PR Newswire (Feb 19, 2026)
- Southern Company (SO) Maintains Stability Amid Shifting Landscape – Yahoo Finance (Feb 19, 2026)
- Southern Company wins two analyst upgrades after guidance ‘clearly ahead’ of expectations (SO:NYSE) – Seeking Alpha (Feb 20, 2026)
- The AI Utility: Southern Company (SO) and the New Energy Tsunami – FinancialContent (Feb 19, 2026)
- The Southern Company (NYSE:SO) Q4 2025 Earnings Call Transcript – Insider Monkey (Feb 20, 2026)
For more information about The Southern Company, please visit the official website: southerncompany.com