Home > Analyses > Basic Materials > The Sherwin-Williams Company
Sherwin-Williams paints the world’s colors, shaping environments from homes to industrial sites with unmatched precision. It commands the specialty chemicals sector through its comprehensive portfolio of architectural paints, coatings, and industrial finishes. Known for innovation and quality, Sherwin-Williams sets industry standards and commands a vast retail and commercial footprint. As market dynamics evolve, I question whether its current valuation fully reflects the company’s growth prospects and durable competitive advantages.

Table of contents
Business Model & Company Overview
The Sherwin-Williams Company, founded in 1866 and headquartered in Cleveland, Ohio, dominates the specialty chemicals sector with a comprehensive ecosystem of paints, coatings, and related products. Its three-segment structure—The Americas Group, Consumer Brands Group, and Performance Coatings Group—serves professionals, industries, and retail customers globally. This integrated approach underpins its market leadership in architectural, industrial, and automotive coatings.
Sherwin-Williams drives revenue through a balanced mix of proprietary hardware, branded paints, and recurring industrial coatings sales. Its strategic footprint spans the Americas, Europe, Asia, and Australia, supported by 5,000 company-operated stores and extensive distributor networks. I see its robust distribution and product innovation as a vital economic moat, ensuring dominance amid evolving industry demands.
Financial Performance & Fundamental Metrics
I will analyze The Sherwin-Williams Company’s income statement, key financial ratios, and dividend payout policy to assess its core financial health and shareholder value.
Income Statement
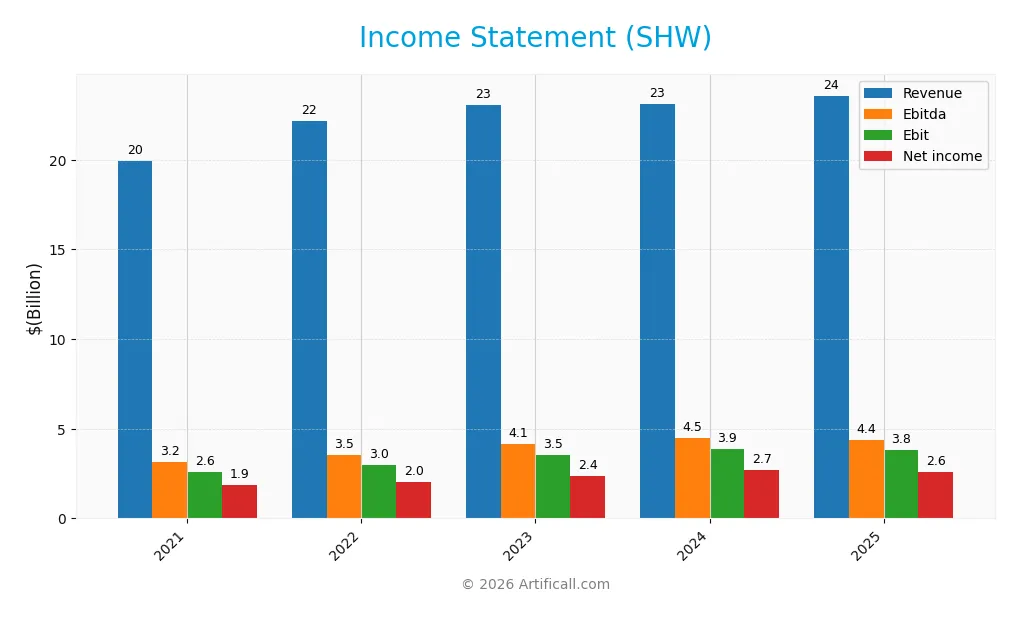
The table below details The Sherwin-Williams Company’s key income statement figures for fiscal years 2021 through 2025, highlighting revenue, expenses, and profitability metrics.
| 2021 | 2022 | 2023 | 2024 | 2025 | |
|---|---|---|---|---|---|
| Revenue | 19.9B | 22.1B | 23.1B | 23.1B | 23.6B |
| Cost of Revenue | 11.4B | 12.8B | 12.3B | 11.9B | 12.0B |
| Operating Expenses | 5.9B | 6.3B | 7.2B | 7.4B | 7.7B |
| Gross Profit | 8.5B | 9.3B | 10.8B | 11.2B | 11.5B |
| EBITDA | 3.2B | 3.5B | 4.1B | 4.5B | 4.4B |
| EBIT | 2.6B | 3.0B | 3.5B | 3.9B | 3.8B |
| Interest Expense | 345M | 403M | 433M | 431M | 469M |
| Net Income | 1.9B | 2.0B | 2.4B | 2.7B | 2.6B |
| EPS | 7.10 | 7.83 | 9.35 | 10.68 | 10.38 |
| Filing Date | 2022-02-17 | 2023-02-22 | 2024-02-20 | 2025-02-20 | 2026-02-19 |
Income Statement Evolution
From 2021 to 2025, Sherwin-Williams’ revenue rose 18.2% to $23.6B, reflecting steady top-line expansion. Net income grew 37.8% to $2.57B, indicating improving profitability. Margins showed mixed trends: gross margin stabilized near 49%, while net margin increased 16.6% overall but contracted slightly in the last year.
Is the Income Statement Favorable?
In 2025, Sherwin-Williams reported a 2.1% revenue increase but a 1.6% decline in EBIT, signaling margin pressure. Operating expenses rose proportionally with revenue, and net margin fell by 6.1% to 10.9%. Despite these short-term headwinds, the company maintains favorable profitability metrics, including a strong gross margin and controlled interest expenses, supporting a generally positive income statement assessment.
Financial Ratios
The following table summarizes key financial ratios for The Sherwin-Williams Company from 2021 to 2025, reflecting profitability, valuation, liquidity, leverage, and efficiency metrics:
| Ratios | 2021 | 2022 | 2023 | 2024 | 2025 |
|---|---|---|---|---|---|
| Net Margin | 9.3% | 9.1% | 10.4% | 11.6% | 10.9% |
| ROE | 76.5% | 65.1% | 64.3% | 66.2% | 55.9% |
| ROIC | 13.5% | 13.1% | 15.2% | 15.4% | 15.2% |
| P/E | 49.6 | 30.3 | 33.3 | 32.2 | 31.1 |
| P/B | 37.9 | 19.7 | 21.4 | 21.3 | 17.4 |
| Current Ratio | 0.88 | 0.99 | 0.83 | 0.79 | 0.87 |
| Quick Ratio | 0.55 | 0.55 | 0.48 | 0.46 | 0.53 |
| D/E | 4.72 | 4.03 | 3.18 | 2.94 | 3.16 |
| Debt-to-Assets | 56.0% | 55.4% | 51.4% | 50.4% | 56.1% |
| Interest Coverage | 7.7 | 7.4 | 8.3 | 8.7 | 8.1 |
| Asset Turnover | 0.97 | 0.98 | 1.00 | 0.98 | 0.91 |
| Fixed Asset Turnover | 5.41 | 5.44 | 4.88 | 4.21 | 5.70 |
| Dividend Yield | 0.64% | 1.01% | 0.78% | 0.84% | 0.99% |
Evolution of Financial Ratios
From 2021 to 2025, Sherwin-Williams’ Return on Equity (ROE) showed volatility but remained robust, peaking near 76% in 2021 before settling at 55.9% in 2025. The Current Ratio trended downward from 0.88 to 0.87, indicating tightening liquidity. Debt-to-Equity fluctuated notably, peaking around 4.7 in 2021, and stood at 3.16 in 2025, signaling sustained leverage with some reduction. Profitability remained strong but showed slight compression in margins.
Are the Financial Ratios Favorable?
In 2025, Sherwin-Williams posted favorable profitability metrics, including a 10.9% net margin, 55.9% ROE, and a 15.2% ROIC exceeding its 8.7% WACC, indicating efficient capital use. However, liquidity ratios were below 1.0, flagging potential short-term risk. Leverage remains high with a Debt-to-Equity of 3.16 and 56.1% debt-to-assets, posing solvency concerns. Market multiples (P/E 31.1, P/B 17.4) and dividend yield under 1% appear elevated. Overall, ratios are slightly unfavorable.
Shareholder Return Policy
The Sherwin-Williams Company maintains a consistent dividend policy with a payout ratio around 30% and a steadily rising dividend per share, reaching $3.21 in 2025. The annual dividend yield is just under 1%, supported by strong free cash flow coverage and moderate share buybacks.
This disciplined approach balances shareholder returns with reinvestment needs, preserving financial flexibility amid elevated debt levels. The dividend and buyback programs appear sustainable and aligned with long-term value creation, mitigating risks of over-distribution or excessive leverage.
Score analysis
The radar chart below illustrates key financial scores evaluating The Sherwin-Williams Company’s value and risk metrics:
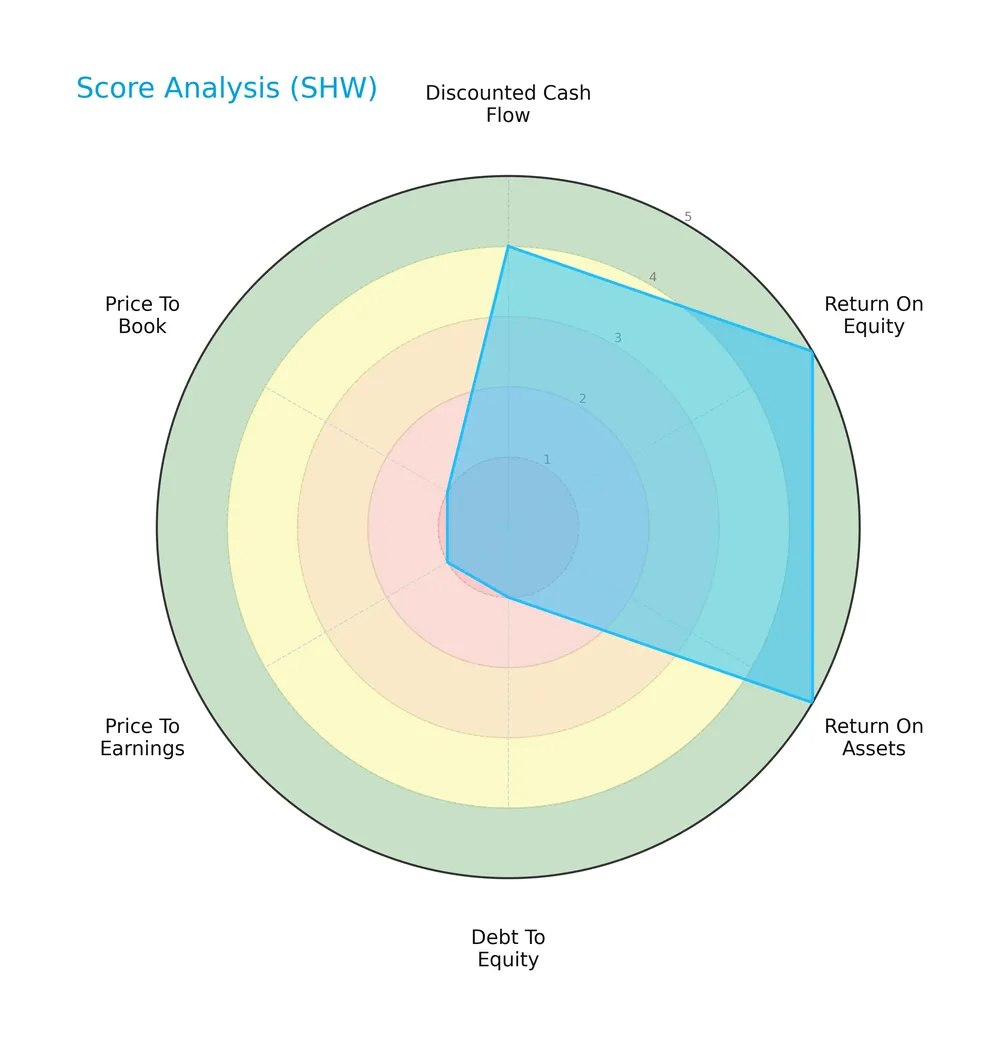
The company scores very favorably on return on equity and assets, indicating strong profitability. Discounted cash flow is favorable, but debt-to-equity, price-to-earnings, and price-to-book scores are very unfavorable, signaling valuation and leverage concerns.
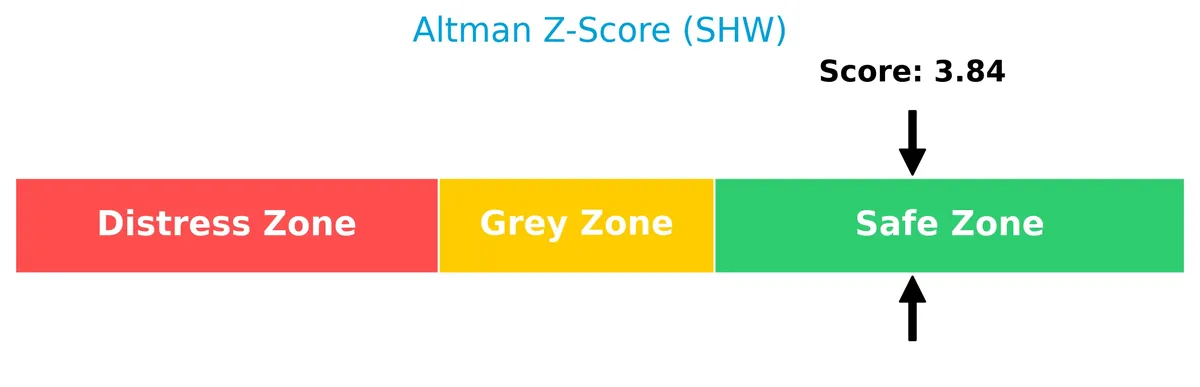
Analysis of the company’s bankruptcy risk
The Altman Z-Score places the company well within the safe zone, indicating a low risk of bankruptcy and solid financial stability:
Is the company in good financial health?
The Piotroski diagram below reflects a strong financial health score for the company:

With a Piotroski Score of 7, the company demonstrates strong profitability, liquidity, and operational efficiency, suggesting robust financial fundamentals and resilience.
Competitive Landscape & Sector Positioning
This section examines The Sherwin-Williams Company’s strategic positioning within the specialty chemicals sector. It covers revenue breakdown by segment, key products, and main competitors. I will assess whether Sherwin-Williams holds a competitive advantage over its peers.
Strategic Positioning
Sherwin-Williams concentrates its portfolio in paints, coatings, and related products, segmented into Consumer, Global Finishes, and Paint Stores groups. It primarily operates in the Americas, with modest non-US revenue of $4.6B in 2025, reflecting focused geographic exposure.
Revenue by Segment
This pie chart presents The Sherwin-Williams Company’s revenue distribution by segment for fiscal year 2025, highlighting the relative contributions of each business unit.
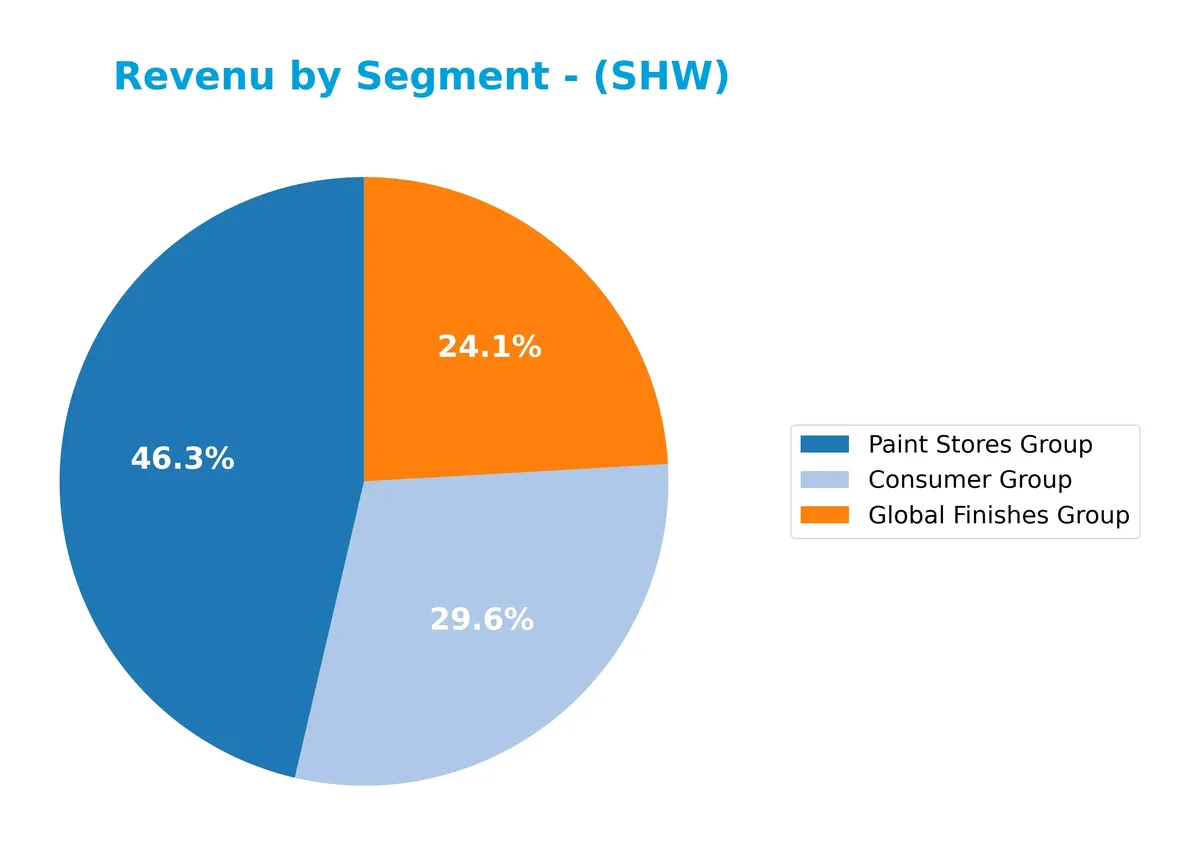
In 2025, the Paint Stores Group leads with $13.6B, showing steady growth and driving overall revenue expansion. The Consumer Group and Global Finishes Group contribute $8.6B and $6.8B respectively, maintaining stable performance. The negative Corporate and Eliminations figure at -$5.4B reflects internal adjustments but does not affect segment strength. The revenue mix reveals concentration in retail and consumer-facing segments, signaling consistent market demand and operational focus.
Key Products & Brands
The Sherwin-Williams Company operates with three main product groups generating significant revenue:
| Product | Description |
|---|---|
| Paint Stores Group | Operates approximately 5,000 company-operated stores selling architectural paints and coatings. |
| Consumer Group | Offers branded and private-label paints, stains, wood finishes, aerosols, caulks, and adhesives. |
| Global Finishes Group | Develops industrial coatings for wood, automotive refinish, protective, marine, and packaging applications. |
Sherwin-Williams relies heavily on its Paint Stores Group, the largest revenue contributor. The Consumer and Global Finishes Groups diversify its portfolio across retail and industrial markets. This multi-segment approach supports broad market coverage.
Main Competitors
The Basic Materials sector includes 9 key competitors, with the table showing the top 9 leaders by market capitalization:
| Competitor | Market Cap. |
|---|---|
| Linde plc | 200.4B |
| The Sherwin-Williams Company | 81.5B |
| Ecolab Inc. | 74.5B |
| Air Products and Chemicals, Inc. | 55.8B |
| PPG Industries, Inc. | 23.4B |
| International Flavors & Fragrances Inc. | 17.4B |
| DuPont de Nemours, Inc. | 17.1B |
| Albemarle Corporation | 16.9B |
| LyondellBasell Industries N.V. | 14.3B |
The Sherwin-Williams Company ranks 2nd among its competitors, holding 44.6% of the market cap of the leader, Linde plc. It stands well above both the average market cap of the top 10 (56B) and the sector median (23.4B). Sherwin-Williams enjoys a significant 124% market cap gap over its closest rival above, reflecting a strong competitive position.
Comparisons with competitors
Check out how we compare the company to its competitors:
Does SHW have a competitive advantage?
The Sherwin-Williams Company demonstrates a sustainable competitive advantage, evidenced by a ROIC exceeding WACC by 6.5% and a growing ROIC trend of 12.7% over 2021-2025. This indicates efficient capital use and consistent value creation in the specialty chemicals sector.
Looking ahead, Sherwin-Williams benefits from a diverse product portfolio across architectural, industrial, and performance coatings, serving multiple geographies including the Americas and Asia. Continued expansion in industrial coatings and innovation in product finishes offer avenues for future growth.
SWOT Analysis
This SWOT analysis highlights Sherwin-Williams’ core strategic position and challenges to inform investment decisions.
Strengths
- strong brand portfolio
- high ROIC above WACC
- diversified global operations
Weaknesses
- high debt-to-equity ratio
- low liquidity ratios
- expensive valuation multiples
Opportunities
- expanding industrial coatings market
- innovation in eco-friendly products
- growth in emerging markets
Threats
- raw material cost volatility
- intense industry competition
- regulatory compliance risks
Sherwin-Williams shows a durable competitive advantage with solid profitability but carries financial leverage risks. Strategic focus should balance growth investments with debt management.
Stock Price Action Analysis
The following weekly chart illustrates The Sherwin-Williams Company’s stock price movement over the last 100 weeks:
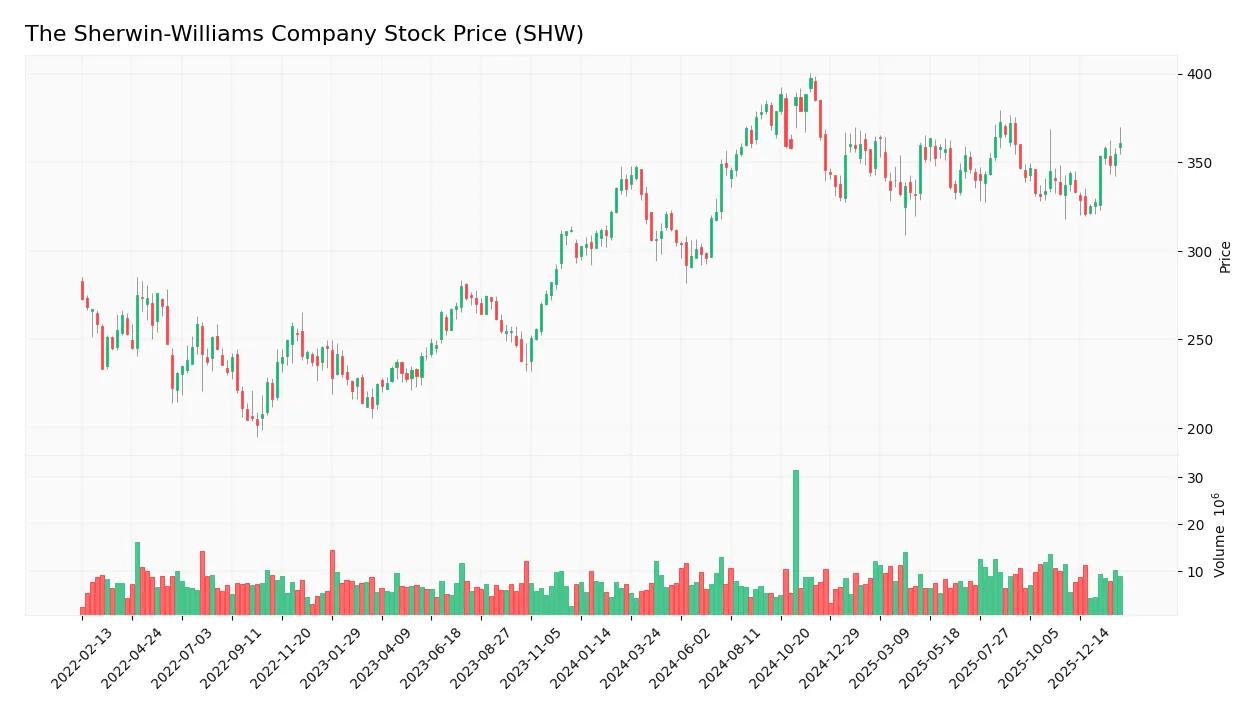
Trend Analysis
Over the past two years, SHW’s stock price increased by 3.83%, confirming a bullish trend with clear acceleration. The price peaked at 397.4 and bottomed at 291.95. Volatility remains elevated, with a standard deviation of 22.66, reflecting notable fluctuations.
Volume Analysis
In the last three months, trading volume has increased and shows slight buyer dominance at 58.22%. This buyer-driven activity suggests growing investor confidence and stronger market participation in SHW shares.
Target Prices
Analysts show a confident consensus on Sherwin-Williams’ price outlook for 2026.
| Target Low | Target High | Consensus |
|---|---|---|
| 371 | 420 | 396.83 |
The target range suggests moderate upside potential, reflecting steady growth expectations in a competitive sector.

Don’t Let Luck Decide Your Entry Point
Optimize your entry points with our advanced ProRealTime indicators. You’ll get efficient buy signals with precise price targets for maximum performance. Start outperforming now!
Analyst & Consumer Opinions
This section examines analyst grades and consumer feedback to provide a balanced view of The Sherwin-Williams Company.
Stock Grades
Here are the latest verified analyst grades for The Sherwin-Williams Company, showing consistent positive sentiment:
| Grading Company | Action | New Grade | Date |
|---|---|---|---|
| Mizuho | Maintain | Outperform | 2026-02-17 |
| RBC Capital | Maintain | Outperform | 2026-01-30 |
| UBS | Maintain | Buy | 2026-01-12 |
| Mizuho | Maintain | Outperform | 2025-12-18 |
| Citigroup | Upgrade | Buy | 2025-12-18 |
| Citigroup | Maintain | Neutral | 2025-10-30 |
| JP Morgan | Maintain | Overweight | 2025-10-29 |
| Wells Fargo | Maintain | Overweight | 2025-10-29 |
| UBS | Maintain | Buy | 2025-10-29 |
| RBC Capital | Maintain | Outperform | 2025-10-29 |
The trend reveals a stable to improving outlook, with most firms maintaining Outperform or Buy ratings. Citigroup’s recent upgrade highlights growing confidence in the stock’s prospects.
Consumer Opinions
Consumers express strong appreciation for The Sherwin-Williams Company’s product quality and wide color selection, though some note concerns about pricing and customer service responsiveness.
| Positive Reviews | Negative Reviews |
|---|---|
| Exceptional paint quality that lasts. | Higher price points compared to competitors. |
| Extensive color options to choose from. | Occasional delays in customer support responses. |
| Reliable performance for both professionals and DIYers. | Some customers find the store layout confusing. |
Overall, feedback praises Sherwin-Williams for durable, vibrant products and variety. However, pricing and customer service delays emerge as consistent issues.
Risk Analysis
Below is a summary table highlighting key risks facing The Sherwin-Williams Company (SHW) in 2026:
| Category | Description | Probability | Impact |
|---|---|---|---|
| Financial Leverage | High debt-to-equity ratio at 3.16 raises solvency concerns | High | High |
| Valuation | Elevated P/E of 31.1 and P/B of 17.4 suggest overvaluation | Medium | Medium |
| Liquidity | Current ratio of 0.87 and quick ratio of 0.53 indicate tight liquidity | High | Medium |
| Market Volatility | Beta of 1.26 exposes stock to above-market swings | Medium | Medium |
| Dividend Yield | Low yield at 0.99% may limit income appeal | Low | Low |
Sherwin-Williams’ most pressing risks stem from elevated leverage and weak liquidity. Despite strong returns on equity and invested capital, its debt load exceeds industry norms, increasing financial strain if market conditions worsen. High valuation multiples expose the stock to downside if growth slows. I recommend close monitoring of debt servicing capacity and market sentiment.
Should You Buy The Sherwin-Williams Company?
The Sherwin-Williams Company appears to be a very favorable investment candidate, demonstrating robust profitability and a durable competitive moat via growing ROIC well above WACC. Despite a challenging leverage profile, the overall B rating suggests strong value creation underpinned by solid operational efficiency.
Strength & Efficiency Pillars
The Sherwin-Williams Company exhibits solid operational efficiency, demonstrated by a net margin of 10.9%, a return on equity (ROE) of 55.86%, and a return on invested capital (ROIC) of 15.21%. With a weighted average cost of capital (WACC) at 8.66%, the company is a clear value creator, generating returns well above its capital costs. This reflects a sustainable competitive advantage and growing profitability, supported by a very favorable moat status and a strong Piotroski score of 7.
Weaknesses and Drawbacks
Despite operational strength, Sherwin-Williams faces notable valuation and leverage concerns. The price-to-earnings ratio sits at a steep 31.08, while the price-to-book ratio is an elevated 17.36, indicating premium market expectations that may pressure future returns. The debt-to-equity ratio of 3.16 and a current ratio of 0.87 signal high leverage and liquidity constraints, increasing financial risk. These factors warrant caution, especially as they contrast with the company’s otherwise robust profitability metrics.
Our Final Verdict about The Sherwin-Williams Company
Sherwin-Williams presents a fundamentally strong profile with clear value creation and operational efficiency. Its bullish long-term trend and increasing volume with 55.64% buyer dominance suggest underlying market confidence. However, elevated valuation multiples and leverage imply some risk, so investors might consider a wait-and-see approach for a more favorable entry point despite the company’s attractive long-term attributes.
Disclaimer: This content is for informational purposes only and does not constitute financial, investment, or other professional advice. Investing in financial markets involves a significant risk of loss, and past performance is not indicative of future results.
Additional Resources
- Sherwin-Williams Declares Dividend of $0.80 per Common Share – PR Newswire (Feb 18, 2026)
- Mizuho Raises Sherwin-Williams (SHW) Price Target to $410 after Earnings Review – Yahoo Finance UK (Feb 20, 2026)
- SHERWIN WILLIAMS CO SEC 10-K Report – TradingView (Feb 19, 2026)
- 3 Reasons to Sell SHW and 1 Stock to Buy Instead – Finviz (Feb 18, 2026)
- Decoding Sherwin-Williams Co (SHW): A Strategic SWOT Insight – GuruFocus (Feb 20, 2026)
For more information about The Sherwin-Williams Company, please visit the official website: sherwin-williams.com