Home > Analyses > Financial Services > The Progressive Corporation
The Progressive Corporation reshapes how millions protect their vehicles and homes daily, blending technology with insurance expertise. It dominates the U.S. property and casualty market through innovative personal and commercial auto policies. Known for its direct-to-consumer digital platforms and strong underwriting discipline, Progressive sets high industry standards in customer service and risk management. As we analyze its 2026 fundamentals, the key question remains: can Progressive sustain growth and justify its premium valuation in this evolving insurance landscape?

Table of contents
Business Model & Company Overview
The Progressive Corporation, founded in 1937 and headquartered in Mayfield, Ohio, dominates the U.S. property and casualty insurance market. It delivers a comprehensive ecosystem of personal and commercial auto, residential property, and specialty insurance products. This integrated approach serves diverse client needs, from personal vehicles to commercial fleets and property owners, underlining its competitive advantage in risk management and coverage breadth.
Progressive’s revenue engine balances premium income from Personal Lines, Commercial Lines, and Property segments. It leverages direct online sales alongside independent agencies to maximize market reach across the Americas. Its strategic footprint in the U.S. insurance space supports steady cash flow and recurring premiums. The company’s robust underwriting discipline and diversified portfolio create a powerful economic moat, shaping the industry’s future resilience and innovation.
Financial Performance & Fundamental Metrics
I analyze The Progressive Corporation’s income statement, key financial ratios, and dividend payout policy to assess its core financial health and shareholder value.
Income Statement
The table below summarizes The Progressive Corporation’s key income statement figures from 2021 to 2025, reflecting revenue growth and profitability trends.

| 2021 | 2022 | 2023 | 2024 | 2025 | |
|---|---|---|---|---|---|
| Revenue | 47.7B | 49.6B | 62.1B | 75.3B | 79.9B |
| Cost of Revenue | 37.3B | 42.0B | 50.3B | 54.4B | 55.3B |
| Operating Expenses | 6.1B | 6.6B | 6.9B | 10.2B | 11.8B |
| Gross Profit | 10.3B | 7.5B | 11.8B | 20.9B | 24.6B |
| EBITDA | 4.8B | 1.5B | 5.5B | 11.3B | 13.1B |
| EBIT | 4.4B | 1.2B | 5.2B | 11.0B | 12.8B |
| Interest Expense | 219M | 244M | 268M | 279M | 255M |
| Net Income | 3.4B | 722M | 3.9B | 8.5B | 10.2B |
| EPS | 5.69 | 1.19 | 6.61 | 14.45 | 17.27 |
| Filing Date | 2022-02-28 | 2023-02-27 | 2024-02-26 | 2025-03-03 | 2026-03-02 |
Income Statement Evolution
From 2021 to 2025, Progressive’s revenue surged 67.6% to $79.9B, showing robust top-line growth. Net income tripled, climbing 203%, reflecting improved profitability. Margins expanded significantly, with net margin rising 80.9% and gross margin steady near 31%. Operating efficiency enhanced EBIT margin to 16%, signaling strong cost control despite rising operating expenses.
Is the Income Statement Favorable?
In 2025, fundamentals remain solid with $79.9B revenue and $10.2B net income. Gross margin at 30.8% and EBIT margin at 16.1% both indicate healthy profitability. Interest expense is minimal at 0.3% of revenue, supporting net margin near 12.7%. Despite a slight unfavorable rise in operating expenses relative to revenue, the overall income statement is favorable, backed by strong earnings and margin growth.
Financial Ratios
The following table summarizes key financial ratios for The Progressive Corporation (PGR) over the last four fiscal years:
| Ratios | 2022 | 2023 | 2024 | 2025 |
|---|---|---|---|---|
| Net Margin | 1.5% | 6.3% | 11.3% | 12.7% |
| ROE | 4.5% | 19.2% | 33.1% | 223% |
| ROIC | 1.0% | 4.4% | 8.0% | 9.3% |
| P/E | 105 | 24 | 17 | 13 |
| P/B | 4.8 | 4.6 | 5.5 | 29.3 |
| Current Ratio | 12.0 | 0 | 0 | 0 |
| Quick Ratio | 12.0 | 0 | 0 | 0 |
| D/E | 0.40 | 0.34 | 0.27 | 0 |
| Debt-to-Assets | 8.5% | 7.8% | 6.5% | 0% |
| Interest Coverage | 3.8 | 18.3 | 38.4 | 50.3 |
| Asset Turnover | 0.66 | 0.70 | 0.71 | 0.88 |
| Fixed Asset Turnover | 48.0 | 70.5 | 95.4 | 0 |
| Dividend Yield | 0.3% | 0.3% | 0.5% | 0% |
Evolution of Financial Ratios
Return on Equity surged dramatically to 222.54% in 2025, indicating a sharp profitability increase. The Current Ratio remained at zero, signaling no available liquidity data or potential concerns. Debt-to-Equity Ratio dropped to zero, showing significant deleveraging. Overall profitability margins steadily improved, with net margin rising to 12.72%.
Are the Financial Ratios Favorable?
Profitability metrics such as ROE (222.54%) and net margin (12.72%) are favorable, reflecting strong earnings. Leverage ratios including debt-to-equity (0) and interest coverage (50.33) are also favorable, indicating low financial risk. However, liquidity ratios are unfavorable with a zero current ratio and quick ratio. Market valuation shows mixed signals: a favorable P/E of 13.18 contrasts with an unfavorable high price-to-book of 29.34. Overall, the financial ratios present a slightly favorable profile.
Shareholder Return Policy
The Progressive Corporation maintains a very low dividend payout ratio near zero, with negligible dividend per share and yield, indicating minimal cash returned via dividends. There is no indication of share buyback activity, suggesting a conservative capital distribution approach.
This policy aligns with preserving capital for reinvestment or operational needs, supporting long-term value creation. The extremely low payout reduces risk of unsustainable distributions, but investors seeking immediate income should note the limited cash returns.
Score analysis
The radar chart below illustrates key financial scores for The Progressive Corporation, highlighting areas of strength and weakness:

The company scores very favorably on return on equity and assets (both 5). However, debt-to-equity and price-to-book ratios show very unfavorable scores of 1, indicating leverage and valuation concerns. Discounted cash flow and price-to-earnings scores are moderate to unfavorable.
Analysis of the company’s bankruptcy risk
The Altman Z-Score places the company comfortably in the safe zone, signaling low bankruptcy risk:

Is the company in good financial health?
The Piotroski diagram below presents the company’s financial health based on nine criteria:

With a Piotroski Score of 4, the company is in an average financial health zone. This suggests moderate strength but highlights room for improvement in profitability and efficiency metrics.
Competitive Landscape & Sector Positioning
This sector analysis examines The Progressive Corporation’s strategic positioning, revenue segments, and key products. I will assess its competitive advantages and main competitors. The analysis aims to determine if the company holds a sustainable edge over peers.
Strategic Positioning
The Progressive Corporation concentrates its portfolio primarily in personal auto insurance, generating over $71B in 2025, complemented by $11B in commercial lines and a smaller property segment. It operates exclusively in the U.S., leveraging direct and independent agency channels to diversify distribution within a focused geographic footprint.
Revenue by Segment
The pie chart displays The Progressive Corporation’s revenue distribution across key segments for fiscal year 2025, highlighting the relative size of each business unit.
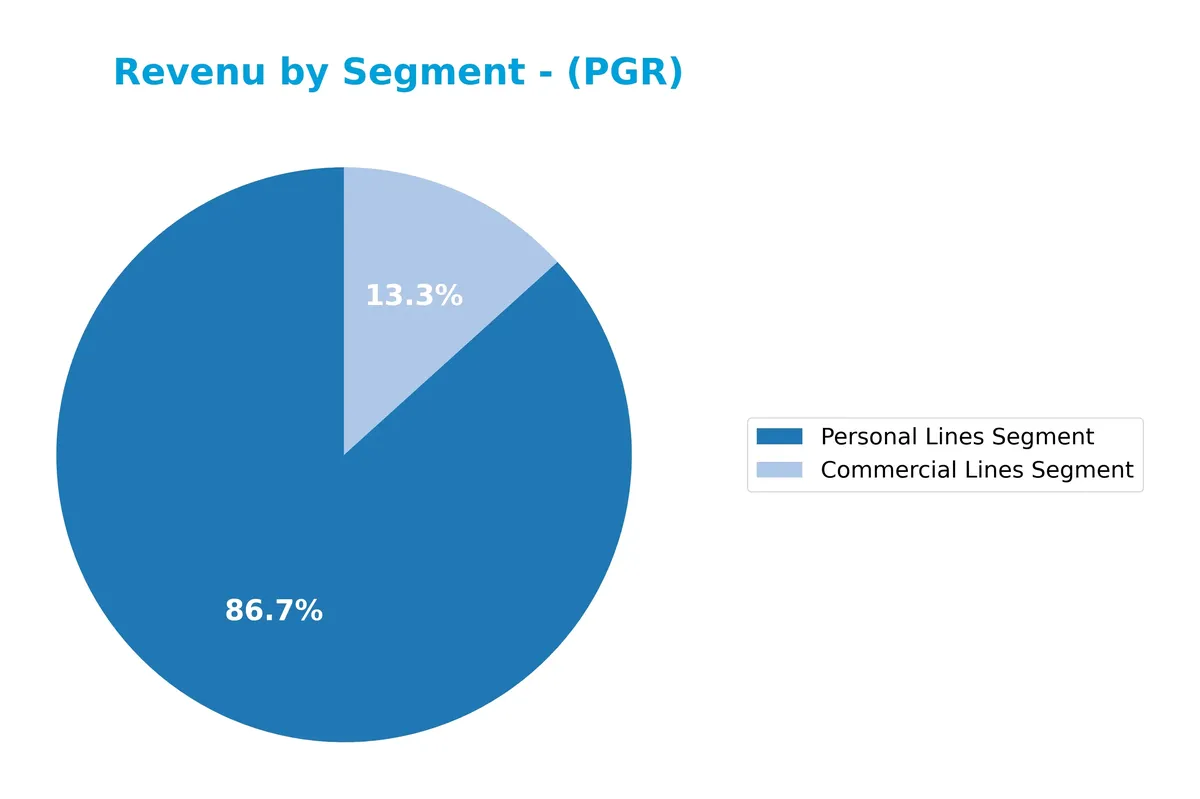
In 2025, Personal Lines dominate with $71.8B, reflecting robust growth and steady customer demand. Commercial Lines follow at $11B, showing consistent expansion but at a slower pace. The Property segment, once a smaller contributor, no longer appears in the latest data, indicating a strategic focus on core insurance lines. This concentration underscores Progressive’s reliance on personal insurance, signaling potential risk if market conditions shift.
Key Products & Brands
The Progressive Corporation offers a diversified portfolio of insurance products across three main segments:
| Product | Description |
|---|---|
| Personal Lines Segment | Insurance for personal autos, motorcycles, ATVs, RVs, watercrafts, snowmobiles, and related special lines products. |
| Commercial Lines Segment | Auto-related primary liability and physical damage insurance for small business vehicles, trucks, taxis, and specialized commercial fleets. |
| Property Segment | Residential property insurance for homeowners, renters, personal umbrella insurance, and flood insurance. |
| Policy Issuance & Claims | Services including policy issuance, claims adjusting, and agency representation for homeowner general liability and workers’ compensation. |
| Reinsurance Services | Provides reinsurance support to mitigate risks within its insurance operations. |
Progressive’s product mix spans personal auto to commercial and property insurance, supported by claims and reinsurance services. Personal Lines dominate revenue, reflecting the company’s strong foothold in personal auto insurance.
Main Competitors
There are 7 competitors in the Financial Services sector; the table lists the top 7 leaders by market capitalization:
| Competitor | Market Cap. |
|---|---|
| The Progressive Corporation | 124B |
| Chubb Limited | 124B |
| The Travelers Companies, Inc. | 64B |
| The Allstate Corporation | 54B |
| W. R. Berkley Corporation | 26B |
| Cincinnati Financial Corporation | 25B |
| Loews Corporation | 22B |
The Progressive Corporation ranks 1st among its 7 competitors. It holds a market cap 1.0062 times that of the top peer, Chubb Limited. The company is above both the average market cap of the top 10 competitors (63B) and the sector median (54B). There is no competitor above it, and it leads its closest rival by a narrow 0.87% margin.
Comparisons with competitors
Check out how we compare the company to its competitors:
Does Progressive have a competitive advantage?
Progressive demonstrates a clear competitive advantage, evidenced by a very favorable moat rating and a ROIC exceeding WACC by over 4%, indicating consistent value creation. The company’s ROIC trend shows strong growth, signaling increasing profitability and efficient capital use over 2021-2025.
Looking ahead, Progressive’s diversified insurance segments, including personal, commercial, and property lines, position it well to capture new market opportunities. Continued innovation in product offerings and digital distribution channels supports sustained growth and competitive resilience.
SWOT Analysis
This SWOT analysis highlights key internal and external factors shaping The Progressive Corporation’s strategic position.
Strengths
- strong ROE at 222%
- favorable net margin of 12.7%
- sustainable competitive advantage with growing ROIC
Weaknesses
- high price-to-book ratio at 29.34 signals overvaluation
- weak liquidity ratios, current and quick ratios at 0
- moderate Piotroski score of 4 indicates average financial health
Opportunities
- expanding digital sales channels
- growth in personal and commercial lines insurance
- potential to improve operational efficiency
Threats
- intense competition in property & casualty insurance
- regulatory changes in insurance industry
- exposure to catastrophic claims risk
Progressive shows robust profitability and a durable moat, but faces valuation and liquidity concerns. The company should leverage its market strength to capture growth while addressing financial flexibility and risk controls.
Stock Price Action Analysis
The following weekly chart illustrates The Progressive Corporation’s stock price movements and key levels over the past 12 months:

Trend Analysis
Over the past 12 months, PGR’s stock gained 4.66%, indicating a bullish trend with decelerating momentum. The price ranged between a low of 202.29 and a high of 286.03. The trend shows high volatility, reflected by a standard deviation of 24.29, signaling notable price swings but sustained upward direction.
Volume Analysis
In the past three months, trading volume has increased, with buyers slightly dominating at 53.96%. This buyer-driven activity suggests cautious optimism among investors, supporting price stability despite recent modest downtrends. Market participation appears robust, reflecting steady engagement in PGR shares.
Target Prices
Analysts set a solid target consensus reflecting confidence in The Progressive Corporation’s growth prospects.
| Target Low | Target High | Consensus |
|---|---|---|
| 214 | 265 | 234 |
The target range from 214 to 265 implies moderate upside potential. The consensus at 234 suggests steady appreciation aligned with sector expectations.

Don’t Let Luck Decide Your Entry Point
Optimize your entry points with our advanced ProRealTime indicators. You’ll get efficient buy signals with precise price targets for maximum performance. Start outperforming now!
Analyst & Consumer Opinions
This section examines recent analyst ratings and consumer feedback to gauge market sentiment toward Progressive Corporation.
Stock Grades
The following table presents the latest verified grades for The Progressive Corporation from reputable financial institutions:
| Grading Company | Action | New Grade | Date |
|---|---|---|---|
| UBS | Maintain | Neutral | 2026-02-23 |
| Evercore ISI Group | Maintain | In Line | 2026-02-19 |
| Wells Fargo | Maintain | Equal Weight | 2026-02-19 |
| Keefe, Bruyette & Woods | Maintain | Market Perform | 2026-02-19 |
| Citigroup | Maintain | Buy | 2026-02-04 |
| Keefe, Bruyette & Woods | Maintain | Market Perform | 2026-01-30 |
| Wells Fargo | Maintain | Equal Weight | 2026-01-29 |
| BMO Capital | Maintain | Market Perform | 2026-01-29 |
| Morgan Stanley | Maintain | Underweight | 2026-01-29 |
| BMO Capital | Maintain | Market Perform | 2026-01-15 |
The consensus reflects a mix of hold and moderate buy ratings, with no upgrades or downgrades recently. Overall, the stock demonstrates a stable outlook with cautious sentiment prevailing among analysts.
Consumer Opinions
Consumer sentiment around The Progressive Corporation reflects a mix of strong service appreciation and some concerns about pricing.
| Positive Reviews | Negative Reviews |
|---|---|
| Efficient claims process with quick turnaround times | Premium rates perceived as higher than peers |
| Friendly and knowledgeable customer service team | Occasional issues with policy transparency |
| Comprehensive coverage options tailored to needs | Mobile app interface can be confusing |
Overall, customers praise Progressive’s speedy claims handling and personalized service. However, pricing and digital usability emerge as common pain points, signaling areas for strategic improvement to boost satisfaction.
Risk Analysis
Below is a table summarizing the key risks facing The Progressive Corporation, highlighting probability and potential impact:
| Category | Description | Probability | Impact |
|---|---|---|---|
| Valuation Risk | Elevated price-to-book ratio (29.34) signals possible overvaluation risk in current market. | Medium | High |
| Liquidity Risk | Zero current and quick ratios indicate weak short-term liquidity, a notable red flag. | Low | Medium |
| Debt Risk | Debt-to-equity ratio is zero, reflecting minimal leverage and low financial risk. | Low | Low |
| Operational Risk | Moderate asset turnover (0.88) and unfavorable fixed asset turnover may constrain growth. | Medium | Medium |
| Dividend Risk | No dividend yield could deter income-focused investors and affect stock demand. | Medium | Low |
| Market Volatility | Low beta (0.318) suggests limited share price volatility versus the S&P 500, lowering risk. | Low | Low |
The most concerning risks are valuation and liquidity. Despite a safe Altman Z-Score (3.65), the sky-high price-to-book ratio may imply an overheated stock. Meanwhile, zero liquidity ratios contradict typical insurance sector norms and warrant careful monitoring. I advise cautious position sizing until liquidity metrics improve.
Should You Buy The Progressive Corporation?
The Progressive Corporation appears to be a financially healthy company with robust operational efficiency and a durable competitive moat supported by growing ROIC well above WACC. Despite a challenging leverage profile, its overall rating remains very favorable at B, suggesting a balanced investment profile.
Strength & Efficiency Pillars
The Progressive Corporation exhibits robust profitability with a net margin of 12.72% and an outstanding return on equity of 222.54%. Its return on invested capital (ROIC) stands at 9.3%, comfortably above the weighted average cost of capital (WACC) at 5.12%, confirming it as a clear value creator. The company’s growing ROIC trend underscores a sustainable competitive advantage and efficient capital allocation, reinforcing its strong operational foundation despite a moderate Piotroski score of 4.
Weaknesses and Drawbacks
The company faces notable valuation and liquidity concerns. Its price-to-book ratio at 29.34 signals an expensive valuation relative to book value, while an unfavorable current ratio and quick ratio of 0 raise red flags about short-term liquidity management. Although its debt-to-equity ratio is favorable, the high valuation multiples may pressure stock performance if earnings fail to meet elevated expectations. Recent market behavior shows a slightly buyer-dominant trend at 53.96%, indicating mild but cautious investor interest.
Our Final Verdict about The Progressive Corporation
The Progressive Corporation presents a fundamentally strong profile with value creation and solid profitability. Despite a bullish long-term stock trend, the recent slight deceleration and elevated valuation suggest a cautious stance. Investors might consider waiting for a more attractive entry point as the current premium and liquidity risks may temper near-term upside potential. Overall, the profile may appear suitable for patient investors valuing operational strength over immediate price momentum.
Disclaimer: This content is for informational purposes only and does not constitute financial, investment, or other professional advice. Investing in financial markets involves a significant risk of loss, and past performance is not indicative of future results.
Additional Resources
- Piper Sandler Maintains Overweight on PGR (The Progressive Corporation) Mar 2026 – Meyka (Mar 03, 2026)
- How Progressive’s Stronger Margins and Digital Push Will Impact Progressive (PGR) Investors – simplywall.st (Mar 03, 2026)
- Progressive (NYSE: PGR) outlines 2025 business scale and key risks – Stock Titan (Mar 02, 2026)
- BofA Lowers its Price Target on The Progressive Corporation (PGR) to $315 from $329 and Maintains a Buy Rating – Yahoo Finance (Feb 25, 2026)
- US Bancorp DE Cuts Stock Position in The Progressive Corporation $PGR – MarketBeat (Feb 27, 2026)
For more information about The Progressive Corporation, please visit the official website: progressive.com