Home > Analyses > Consumer Defensive > The Procter & Gamble Company
Every day, millions rely on Procter & Gamble’s trusted brands to enhance their personal care, home cleanliness, and health routines. As a dominant force in the household and personal products industry, P&G commands a diverse portfolio spanning beauty, grooming, healthcare, fabric, and family care segments. Renowned for innovation and consistent quality, the company shapes consumer habits worldwide. Yet, with evolving market dynamics, the critical question remains: does P&G’s solid foundation still justify its premium valuation and promise sustained growth?
Table of contents
Business Model & Company Overview
The Procter & Gamble Company, founded in 1837 and headquartered in Cincinnati, Ohio, commands a leading position in the household and personal products industry. Its core business is a cohesive ecosystem of branded consumer packaged goods spanning beauty, grooming, health care, fabric and home care, and baby, feminine & family care. This extensive portfolio delivers daily essentials under globally recognized brands such as Gillette, Tide, Pampers, and Olay, serving a vast consumer base worldwide.
P&G’s revenue engine balances the sale of physical products with a strong presence in recurring consumer purchases, distributed through mass merchandisers, e-commerce, and specialty stores across the Americas, Europe, and Asia. With a market cap of $351B and over 108K employees, the company’s diversified global footprint and trusted brand portfolio create a robust economic moat, positioning it as a cornerstone of the consumer defensive sector and a shaper of industry standards.
Financial Performance & Fundamental Metrics
In this section, I analyze The Procter & Gamble Company’s income statement, key financial ratios, and dividend payout policy to assess its overall financial health.
Income Statement
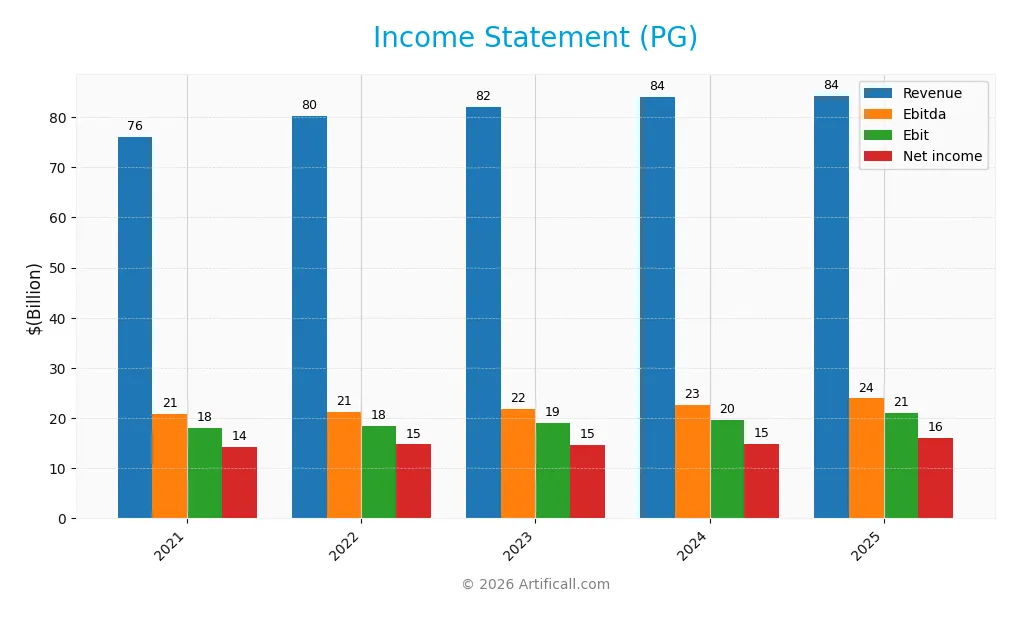
The following table summarizes The Procter & Gamble Company’s key financial results for the fiscal years ending June 30, 2021 to 2025, reported in USD.
| 2021 | 2022 | 2023 | 2024 | 2025 | |
|---|---|---|---|---|---|
| Revenue | 76.1B | 80.2B | 82.0B | 84.0B | 84.3B |
| Cost of Revenue | 37.1B | 42.2B | 42.8B | 40.8B | 41.2B |
| Operating Expenses | 21.0B | 20.2B | 21.1B | 24.6B | 22.7B |
| Gross Profit | 39.0B | 38.0B | 39.2B | 43.2B | 43.1B |
| EBITDA | 20.9B | 21.2B | 21.8B | 22.6B | 23.9B |
| EBIT | 18.1B | 18.4B | 19.1B | 19.7B | 21.1B |
| Interest Expense | 502M | 439M | 756M | 925M | 907M |
| Net Income | 14.3B | 14.7B | 14.7B | 14.9B | 16.0B |
| EPS | 5.69 | 6.00 | 6.07 | 6.18 | 6.67 |
| Filing Date | 2021-08-06 | 2022-08-05 | 2023-08-04 | 2024-08-05 | 2025-08-04 |
Income Statement Evolution
From 2021 to 2025, The Procter & Gamble Company’s revenue grew by 10.73% to reach $84.3B in 2025, showing a moderate but consistent increase. Net income rose by 11.66% over the period, hitting $16B in 2025. Margins remained stable, with a gross margin around 51%, an EBIT margin of 25%, and a net margin close to 19%, indicating maintained profitability despite slight fluctuations in growth rates.
Is the Income Statement Favorable?
The 2025 income statement reflects generally favorable fundamentals, with revenue growth slowing to 0.29% year-over-year but accompanied by a 7.05% increase in EBIT and net margin. Operating expenses grew in line with revenue, supporting operational efficiency. EPS improved by 8.14%, reinforcing profitability gains. The interest expense ratio remains low at 1.08%, contributing positively to financial health. Overall, 78.57% of income statement metrics are favorable, supporting a positive assessment.
Financial Ratios
The table below presents key financial ratios for The Procter & Gamble Company (PG) over the fiscal years 2021 to 2025, providing insights into profitability, valuation, liquidity, leverage, and efficiency:
| Ratios | 2021 | 2022 | 2023 | 2024 | 2025 |
|---|---|---|---|---|---|
| Net Margin | 18.8% | 18.4% | 17.9% | 17.7% | 18.9% |
| ROE | 30.8% | 31.6% | 31.3% | 29.6% | 30.7% |
| ROIC | 15.4% | 15.7% | 15.2% | 15.4% | 16.5% |
| P/E | 23.7 | 24.0 | 24.5 | 25.8 | 24.5 |
| P/B | 7.31 | 7.58 | 7.68 | 7.64 | 7.52 |
| Current Ratio | 0.70 | 0.65 | 0.63 | 0.73 | 0.70 |
| Quick Ratio | 0.52 | 0.45 | 0.44 | 0.53 | 0.49 |
| D/E | 0.71 | 0.69 | 0.76 | 0.66 | 0.68 |
| Debt-to-Assets | 27.5% | 27.6% | 29.3% | 27.3% | 28.3% |
| Interest Coverage | 35.8x | 40.6x | 24.0x | 20.0x | 22.5x |
| Asset Turnover | 0.64 | 0.68 | 0.68 | 0.69 | 0.67 |
| Fixed Asset Turnover | 3.51 | 3.78 | 3.74 | 3.79 | 3.53 |
| Dividend Yield | 2.44% | 2.48% | 2.50% | 2.42% | 2.52% |
Evolution of Financial Ratios
Between 2021 and 2025, The Procter & Gamble Company’s Return on Equity (ROE) showed a general upward trend, rising from 30.85% in 2021 to 30.71% in 2025, indicating stable and strong profitability. The Current Ratio fluctuated slightly but remained below 1.0, reflecting tight liquidity conditions. The Debt-to-Equity Ratio trended downward from 0.71 to 0.68, suggesting moderate improvement in leverage management.
Are the Financial Ratios Favorable?
In 2025, profitability ratios such as net margin (18.95%) and ROE (30.71%) are favorable, alongside a strong return on invested capital (16.47%) and an interest coverage ratio above 23. Liquidity ratios, including the Current Ratio (0.7) and Quick Ratio (0.49), are unfavorable, indicating potential short-term liquidity constraints. The Debt-to-Equity ratio is neutral at 0.68, while market valuation ratios show mixed signals with a neutral P/E of 24.48 but an unfavorable Price-to-Book ratio of 7.52. Overall, the global ratios evaluation is favorable with 57.14% of ratios positive.
Shareholder Return Policy
The Procter & Gamble Company maintains a consistent dividend payout ratio around 61-63%, with dividends per share steadily increasing from $3.29 in 2021 to $4.02 in 2025. The annual dividend yield hovers near 2.5%, supported by free cash flow coverage above 80%, indicating prudent distribution relative to cash generation.
The company also engages in share buybacks, complementing its dividend policy. The balanced approach of dividends and repurchases, backed by solid profitability and cash flow metrics, suggests a shareholder return strategy that aims for sustainable long-term value creation without overextending financial resources.
Score analysis
The following radar chart illustrates key financial scores to assess the company’s valuation and performance metrics:
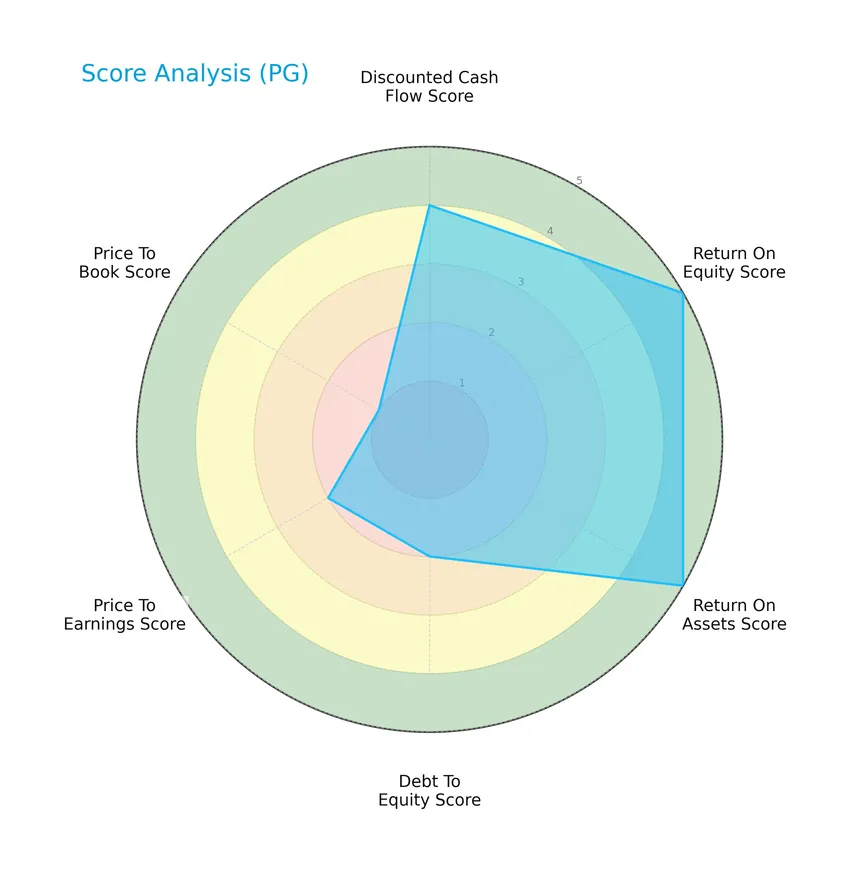
The Procter & Gamble Company shows a favorable discounted cash flow score of 4 and very favorable returns on equity and assets, both scoring 5. However, its debt-to-equity and price-to-earnings scores are moderate at 2, while the price-to-book score is very unfavorable at 1.
Analysis of the company’s bankruptcy risk
The Altman Z-Score indicates that the company is in the safe zone, suggesting a low risk of bankruptcy and stable financial health:

Is the company in good financial health?
The Piotroski Score diagram below provides insight into the company’s financial strength based on nine accounting-based criteria:

With a Piotroski score of 4, the company is rated as average in financial health, indicating moderate financial strength but room for improvement in profitability, leverage, liquidity, or efficiency factors.
Competitive Landscape & Sector Positioning
This sector analysis will examine The Procter & Gamble Company’s strategic positioning, revenue by segment, key products, main competitors, and competitive advantages. I will assess whether the company holds a competitive advantage relative to its peers in the Household & Personal Products industry.
Strategic Positioning
The Procter & Gamble Company maintains a diversified product portfolio across five segments, with Fabric & Home Care leading at $29.6B in FY2025, followed by Baby, Feminine & Family Care at $20.2B and Beauty at $14.9B. Geographically, sales are balanced between the US ($41.6B) and non-US markets ($42.7B), reflecting broad global exposure.
Revenue by Segment
This pie chart displays The Procter & Gamble Company’s revenue distribution by segment for the fiscal year 2025, illustrating the contribution of each business area to total sales.
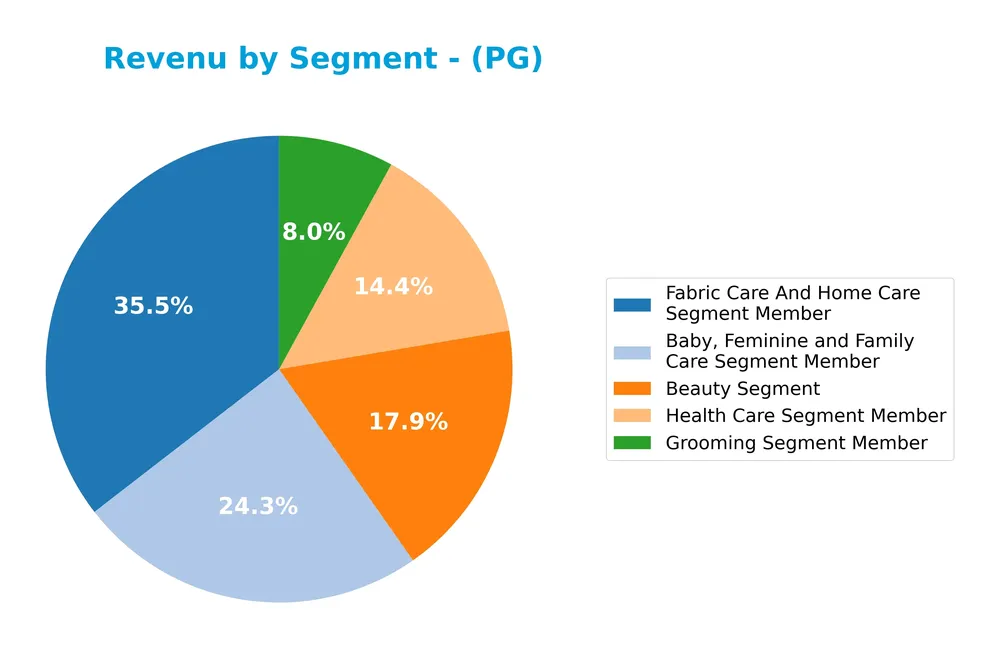
In 2025, Fabric Care and Home Care remains the leading revenue driver at 29.6B, followed by Baby, Feminine and Family Care at 20.2B, and Beauty at 14.9B. Health Care and Grooming contribute 12.0B and 6.7B respectively. The segment revenues show steady growth, with Fabric Care and Home Care accelerating slightly, indicating strong consumer demand. The portfolio is well diversified, reducing concentration risk among segments.
Key Products & Brands
The Procter & Gamble Company operates through key segments and brands as detailed below:
| Product | Description |
|---|---|
| Beauty Segment | Conditioners, shampoos, styling aids, treatments (Head & Shoulders, Herbal Essences, Pantene, Rejoice); antiperspirants, deodorants, skincare (Olay, Old Spice, Safeguard, Secret, SK-II). |
| Grooming Segment | Shave care products and appliances under Braun, Gillette, and Venus brands. |
| Health Care Segment | Oral care products (Crest, Oral-B); gastrointestinal, diagnostics, respiratory, vitamins, pain relief (Metamucil, Neurobion, Pepto-Bismol, Vicks). |
| Fabric & Home Care Segment | Fabric enhancers, laundry additives, detergents (Ariel, Downy, Gain, Tide); air care, dish care, professional, surface care (Cascade, Dawn, Fairy, Febreze, Mr. Clean, Swiffer). |
| Baby, Feminine & Family Care Segment | Baby wipes, diapers (Luvs, Pampers); adult incontinence, feminine care (Always, Always Discreet, Tampax); paper products (Bounty, Charmin, Puffs). |
P&G’s product portfolio spans multiple consumer packaged goods categories, marketed under strong, globally recognized brands across five core segments.
Main Competitors
There are 17 competitors in the Consumer Defensive sector; below are the top 10 leaders by market capitalization:
| Competitor | Market Cap. |
|---|---|
| The Procter & Gamble Company | 331.3B |
| Unilever PLC | 143.2B |
| Colgate-Palmolive Company | 62.6B |
| The Estée Lauder Companies Inc. | 38.5B |
| Kimberly-Clark Corporation | 33.7B |
| Kenvue Inc. | 33.2B |
| Church & Dwight Co., Inc. | 20.2B |
| The Clorox Company | 12.3B |
| e.l.f. Beauty, Inc. | 4.3B |
| Inter Parfums, Inc. | 2.7B |
The Procter & Gamble Company ranks 1st among its 17 competitors, with a market cap 5.9% above the next leader. It stands significantly Above both the average market cap of the top 10 competitors (68.2B) and the median market cap of the sector (4.3B). The company has a wide gap compared to its closest rival below, emphasizing its dominant market position.
Comparisons with competitors
Check out how we compare the company to its competitors:
Does PG have a competitive advantage?
The Procter & Gamble Company presents a clear competitive advantage, demonstrated by a very favorable moat status supported by a strong ROIC exceeding WACC by 11%, indicating consistent value creation. Additionally, the company shows a growing ROIC trend of 7%, reflecting increasing profitability and efficient capital usage.
Looking ahead, PG’s diverse product portfolio across five major segments and broad geographic revenue base, including significant U.S. and non-U.S. sales, supports stability and growth potential. Opportunities may arise from expanding its presence in emerging markets and leveraging innovation within its established brands to capture new consumer demands.
SWOT Analysis
This SWOT analysis highlights The Procter & Gamble Company’s key internal and external factors to guide investment decisions.
Strengths
- Strong global brand portfolio
- Robust profitability with 18.95% net margin
- Durable competitive advantage with growing ROIC
Weaknesses
- High price-to-book ratio at 7.52 signals overvaluation
- Low liquidity ratios (current 0.7, quick 0.49)
- Moderate Piotroski score of 4 indicates room for financial strength improvement
Opportunities
- Expansion in emerging markets
- Growth in e-commerce and direct-to-consumer sales
- Innovation in sustainable and health-conscious products
Threats
- Intense competition in consumer goods
- Supply chain disruptions and inflationary pressures
- Regulatory changes impacting product formulations and marketing
Overall, P&G’s solid profitability and brand strength provide a strong foundation, but valuation and liquidity warrant caution. Opportunities in market expansion and innovation should be leveraged while managing competitive and regulatory risks carefully.
Stock Price Action Analysis
The weekly stock price chart for The Procter & Gamble Company (ticker: PG) over the past 12 months reveals key price movements and volatility patterns:
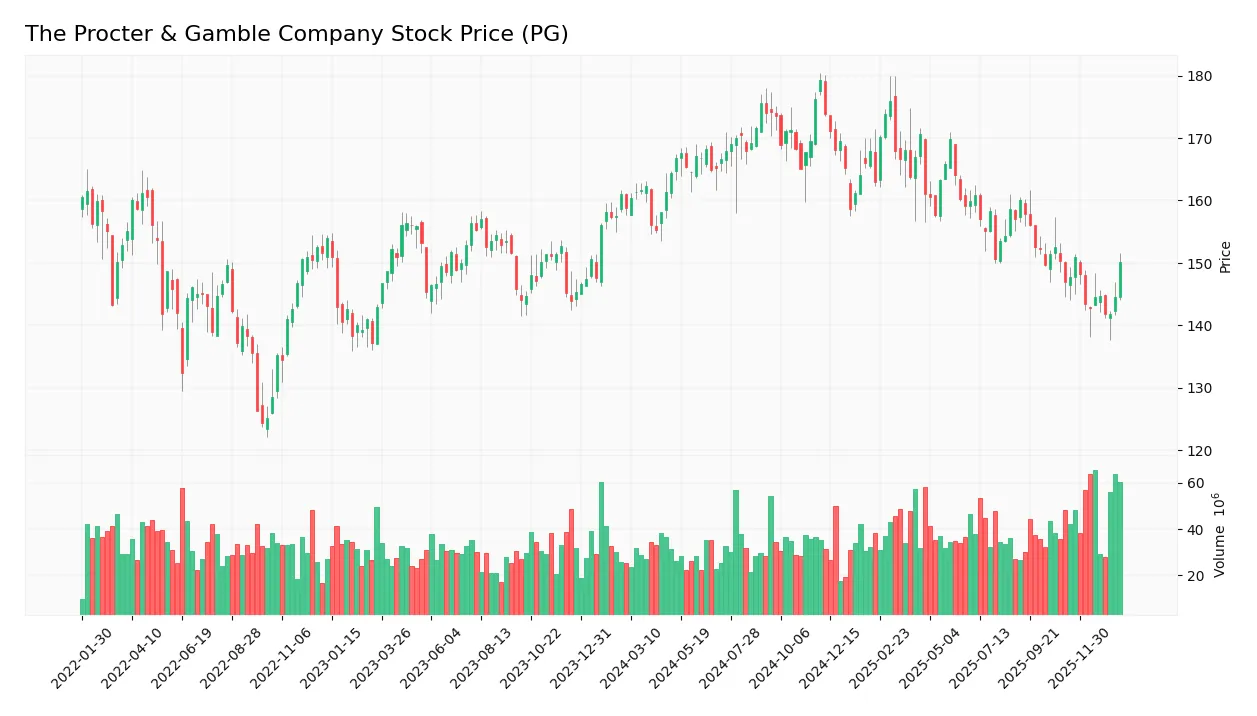
Trend Analysis
Over the past 12 months, PG’s stock price declined by 5.48%, indicating a bearish trend. The price showed a high of 179.26 and a low of 141.79, with volatility measured by an 8.79 standard deviation. The trend is decelerating, reflecting a slowing pace of decline.
Volume Analysis
Trading volume over the last three months shows buyer dominance with 60.83% of volume attributed to buyers. Volume is increasing, suggesting growing market participation and positive investor sentiment despite the overall bearish price trend.
Target Prices
The consensus target prices for The Procter & Gamble Company reflect moderate upside potential.
| Target High | Target Low | Consensus |
|---|---|---|
| 179 | 150 | 165.67 |
Analysts expect the stock to trade between $150 and $179, with an average consensus price near $166, indicating a cautiously optimistic outlook.

Don’t Let Luck Decide Your Entry Point
Optimize your entry points with our advanced ProRealTime indicators. You’ll get efficient buy signals with precise price targets for maximum performance. Start outperforming now!
Analyst & Consumer Opinions
This section reviews recent analyst ratings and consumer feedback regarding The Procter & Gamble Company (PG).
Stock Grades
Here are the latest grades for The Procter & Gamble Company from recognized financial institutions as of early 2026:
| Grading Company | Action | New Grade | Date |
|---|---|---|---|
| Wells Fargo | Maintain | Overweight | 2026-01-23 |
| JP Morgan | Upgrade | Overweight | 2026-01-23 |
| UBS | Maintain | Buy | 2026-01-23 |
| UBS | Maintain | Buy | 2026-01-14 |
| TD Cowen | Maintain | Buy | 2026-01-08 |
| Wells Fargo | Maintain | Overweight | 2026-01-05 |
| JP Morgan | Maintain | Neutral | 2025-12-18 |
| Jefferies | Upgrade | Buy | 2025-12-17 |
| JP Morgan | Maintain | Neutral | 2025-10-27 |
| Raymond James | Maintain | Outperform | 2025-10-20 |
The overall trend shows a positive tilt with multiple upgrades and sustained buy or overweight ratings, suggesting confidence among analysts in the stock’s prospects. JP Morgan notably upgraded from Neutral to Overweight recently, reinforcing an optimistic outlook.
Consumer Opinions
Consumer sentiment about The Procter & Gamble Company (PG) remains largely favorable, with appreciation for product quality balanced by concerns over pricing.
| Positive Reviews | Negative Reviews |
|---|---|
| “P&G products consistently deliver excellent quality.” | “Some items feel overpriced compared to competitors.” |
| “Reliable and widely available brands I trust daily.” | “Occasional delays in customer service response.” |
| “Innovative product lines that meet diverse needs.” | “Packaging could be more sustainable and eco-friendly.” |
| “Strong presence in essential household categories.” | “Limited variety in some niche product segments.” |
Overall, consumers praise P&G for dependable quality and brand trustworthiness, while pointing out pricing issues and a need for improved sustainability efforts as common concerns.
Risk Analysis
Below is a summary table highlighting key risks related to The Procter & Gamble Company (PG), focusing on their category, description, probability, and impact:
| Category | Description | Probability | Impact |
|---|---|---|---|
| Market Risk | Price volatility despite low beta (0.388) may affect investment value. | Medium | Medium |
| Financial Health | Unfavorable liquidity ratios (current ratio 0.7, quick ratio 0.49) risk cash flow issues. | High | High |
| Valuation | High price-to-book ratio (7.52) indicates potential overvaluation risk. | Medium | Medium |
| Debt Management | Moderate debt-to-equity (0.68) and good interest coverage reduce default risk. | Low | Low |
| Competitive Risk | Intense competition in consumer goods sector could pressure margins. | Medium | Medium |
| Dividend Stability | Dividend yield (2.52%) is favorable but sensitive to earnings fluctuations. | Low | Medium |
The most critical risks stem from P&G’s liquidity challenges and valuation concerns, despite strong profitability and a safe Altman Z-Score (5.45). Investors should monitor cash flow management and market valuation closely amid sector competition.
Should You Buy The Procter & Gamble Company?
The Procter & Gamble Company appears to be delivering robust profitability supported by a durable competitive moat with growing ROIC, suggesting strong value creation. Despite a moderate leverage profile, the overall rating of B+ could be seen as reflecting a very favorable investment quality.
Strength & Efficiency Pillars
The Procter & Gamble Company exhibits robust profitability with a net margin of 18.95% and a return on equity (ROE) of 30.71%, underscoring strong operational efficiency. Its return on invested capital (ROIC) stands at 16.47%, comfortably above the weighted average cost of capital (WACC) at 5.44%, confirming the company as a clear value creator. Financial health is supported by a strong Altman Z-Score of 5.45, placing PG in the safe zone, though its Piotroski score of 4 is average. These metrics collectively illustrate a firm with durable competitive advantages and improving profitability.
Weaknesses and Drawbacks
Despite favorable profitability, PG faces valuation and liquidity challenges. The price-to-book ratio is notably high at 7.52, signaling a premium valuation that may limit upside potential. Liquidity ratios are weak, with a current ratio of 0.7 and a quick ratio of 0.49, indicating potential short-term liquidity risks. Leverage is moderate with a debt-to-equity ratio of 0.68, but the stock’s overall trend remains bearish with a 5.48% decline over the past year, suggesting recent market pressure. These factors could pose headwinds for investors sensitive to valuation and market sentiment.
Our Verdict about The Procter & Gamble Company
The long-term fundamental profile of The Procter & Gamble Company appears favorable, supported by strong profitability and value creation. Coupled with a buyer-dominant recent period that shows 60.83% buyer volume, the stock may appear attractive for long-term exposure. However, the bearish overall trend and valuation concerns suggest that investors might consider a cautious, wait-and-see approach to identify a more opportune entry point.
Disclaimer: This content is for informational purposes only and does not constitute financial, investment, or other professional advice. Investing in financial markets involves a significant risk of loss, and past performance is not indicative of future results.
Additional Resources
- The Procter & Gamble Company (PG) Reports Mixed Second-Quarter 2026 Results Amid Weak Consumer Spending – Yahoo Finance (Jan 24, 2026)
- The Procter & Gamble Company (PG) Reports Mixed Second-Quarter 2026 Results Amid Weak Consumer Spending – Insider Monkey (Jan 24, 2026)
- The Procter & Gamble Company Q2 Profit Decreases, But Beats Estimates – Nasdaq (Jan 22, 2026)
- Procter & Gamble earnings top estimates, but shrinking demand weighs on sales – CNBC (Jan 22, 2026)
- Procter & Gamble Leans Into Digestive Health And Premium Diapers Growth – Sahm (Jan 24, 2026)
For more information about The Procter & Gamble Company, please visit the official website: pginvestor.com