Home > Analyses > Basic Materials > The Mosaic Company
The Mosaic Company fuels global food production by supplying essential crop nutrients that drive harvests worldwide. As a dominant player in agricultural inputs, Mosaic excels in phosphate and potash fertilizers, blending innovation with operational scale. Its products reach farmers, cooperatives, and distributors, underpinning the global food supply chain. As market dynamics evolve, I ask: does Mosaic’s current valuation fully capture its growth potential and strategic resilience in a volatile sector?

Table of contents
Business Model & Company Overview
The Mosaic Company, founded in 2004 and headquartered in Tampa, Florida, stands as a leader in the Agricultural Inputs sector. It operates a cohesive ecosystem centered on producing and marketing concentrated phosphate and potash crop nutrients. Through its three segments—Phosphates, Potash, and Mosaic Fertilizantes—the company supports global agriculture with essential crop and animal feed products, reinforcing its dominant market position.
Mosaic’s revenue engine balances mining operations with sales of phosphate, potash, and nitrogen-based nutrients across North America, Europe, and Asia. It generates value through a diversified customer base including distributors, retail chains, and cooperatives. This strategic global presence and integrated supply chain create a robust competitive advantage, positioning Mosaic as a vital player shaping the future of sustainable agriculture.
Financial Performance & Fundamental Metrics
I will analyze The Mosaic Company’s income statement, key financial ratios, and dividend payout policy to assess its overall financial health and shareholder value.
Income Statement
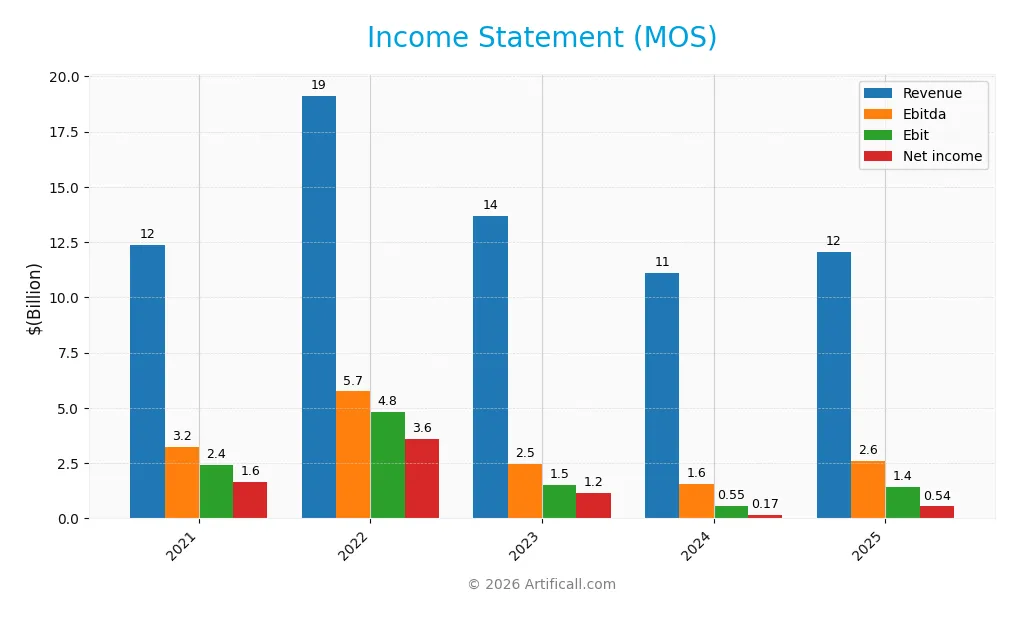
The table below summarizes The Mosaic Company’s key income statement figures for fiscal years 2021 through 2025, reflecting revenue, profitability, and earnings per share trends.
| 2021 | 2022 | 2023 | 2024 | 2025 | |
|---|---|---|---|---|---|
| Revenue | 12.36B | 19.13B | 13.70B | 11.12B | 12.05B |
| Cost of Revenue | 9.16B | 13.37B | 11.49B | 9.61B | 10.24B |
| Operating Expenses | 732M | 971M | 873M | 890M | 767M |
| Gross Profit | 3.20B | 5.76B | 2.21B | 1.51B | 1.82B |
| EBITDA | 3.23B | 5.75B | 2.48B | 1.57B | 2.61B |
| EBIT | 2.42B | 4.81B | 1.51B | 545M | 1.43B |
| Interest Expense | 194M | 169M | 189M | 230M | 218M |
| Net Income | 1.63B | 3.58B | 1.16B | 175M | 541M |
| EPS | 4.31 | 10.17 | 3.52 | 0.55 | 1.70 |
| Filing Date | 2022-02-23 | 2023-02-23 | 2024-02-22 | 2025-03-03 | 2026-02-27 |
Income Statement Evolution
From 2021 to 2025, The Mosaic Company’s revenue declined overall by 2.5%, despite an 8.4% growth in the latest year. Net income slid sharply by 67% over this period but more than doubled in 2025. Margins showed mixed signals: gross margin remained neutral at 15.1%, while EBIT margin improved favorably to 11.9%. Net margin stayed flat near 4.5%.
Is the Income Statement Favorable?
In 2025, revenue reached $12.1B, up 8.4% year-over-year, driven by a 20% rise in gross profit to $1.8B. Operating expenses grew proportionally, maintaining operational leverage. EBIT soared 163%, reflecting effective cost control and improved profitability. Interest expense remains low at 1.8% of revenue, supporting a favorable net margin of 4.5%. Overall, fundamentals appear solid with positive momentum.
Financial Ratios
The table below presents key financial ratios for The Mosaic Company (MOS) over the last five fiscal years, illustrating profitability, liquidity, leverage, and valuation metrics:
| Ratios | 2021 | 2022 | 2023 | 2024 | 2025 |
|---|---|---|---|---|---|
| Net Margin | 13.2% | 18.7% | 8.5% | 1.6% | 4.5% |
| ROE | 15.4% | 29.7% | 9.5% | 1.5% | 4.5% |
| ROIC | 9.9% | 18.7% | 5.9% | 1.6% | 2.3% |
| P/E | 9.1 | 4.3 | 10.2 | 44.9 | 14.1 |
| P/B | 1.4 | 1.3 | 1.0 | 0.7 | 0.6 |
| Current Ratio | 1.11 | 1.18 | 1.22 | 1.08 | 1.32 |
| Quick Ratio | 0.54 | 0.54 | 0.57 | 0.47 | 0.47 |
| D/E | 0.42 | 0.32 | 0.33 | 0.39 | 0.06 |
| Debt-to-Assets | 20.0% | 16.3% | 17.3% | 19.4% | 3.1% |
| Interest Coverage | 12.7x | 28.3x | 7.1x | 2.7x | 4.8x |
| Asset Turnover | 0.56 | 0.82 | 0.59 | 0.49 | 0.49 |
| Fixed Asset Turnover | 0.98 | 1.49 | 0.99 | 0.82 | 0.86 |
| Dividend Yield | 0.7% | 1.3% | 3.0% | 3.4% | 3.7% |
Evolution of Financial Ratios
From 2021 to 2025, Return on Equity (ROE) declined sharply from 15.38% to 4.47%. The Current Ratio improved moderately from 1.11 to 1.32, indicating better short-term liquidity. Meanwhile, the Debt-to-Equity Ratio decreased significantly, reaching a low 0.06 in 2025, reflecting a conservative leverage stance. Profitability showed a marked downward trend.
Are the Financial Ratios Fovorable?
In 2025, profitability ratios like net margin (4.49%) and ROE (4.47%) are unfavorable, lagging behind sector averages. Liquidity is mixed: a current ratio of 1.32 is neutral, but a quick ratio of 0.47 signals tight liquidity. Leverage metrics are favorable with a debt-to-equity of 0.06 and strong interest coverage at 6.58. Efficiency ratios such as asset turnover (0.49) remain weak. Overall, the ratio profile is neutral with balanced favorable and unfavorable indicators.
Shareholder Return Policy
The Mosaic Company maintains a consistent dividend payout with a 2025 payout ratio of 52%, yielding 3.67% annually. Dividend coverage by free cash flow is negative due to recent capital expenditures, while share buybacks are not explicitly reported.
This payout aligns moderately with shareholder value, though negative free cash flow coverage signals caution. Sustaining dividends alongside capex requires close monitoring to avoid unsustainable distributions or excessive financial strain.
Score analysis
The following radar chart presents a comprehensive view of the company’s key financial scores:
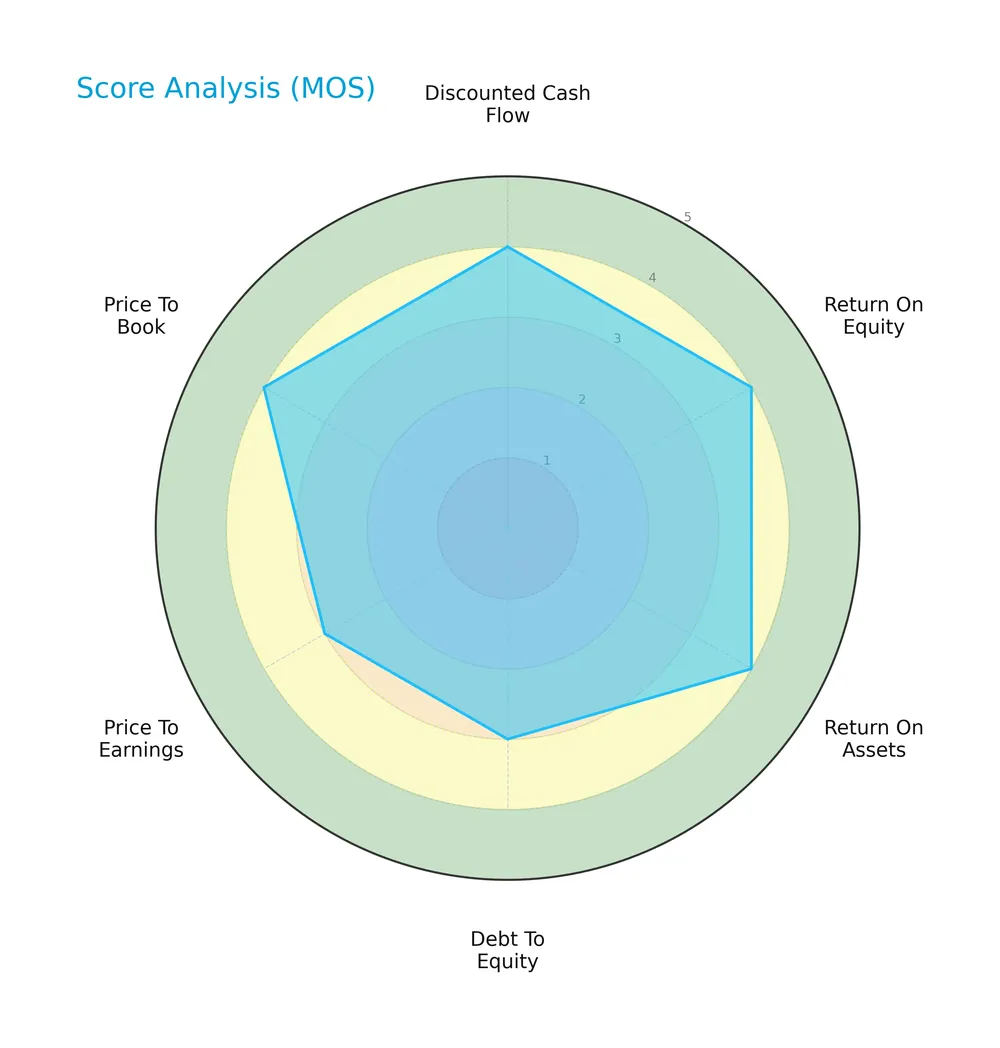
The discounted cash flow, return on equity, and return on assets scores all rate favorably at 4. Debt to equity and price to earnings scores hold moderate levels of 3, while price to book is again favorable at 4.
Analysis of the company’s bankruptcy risk
The Altman Z-Score places the company in the grey zone, indicating a moderate risk of financial distress:

Is the company in good financial health?
This Piotroski diagram illustrates the company’s financial strength based on nine key criteria:
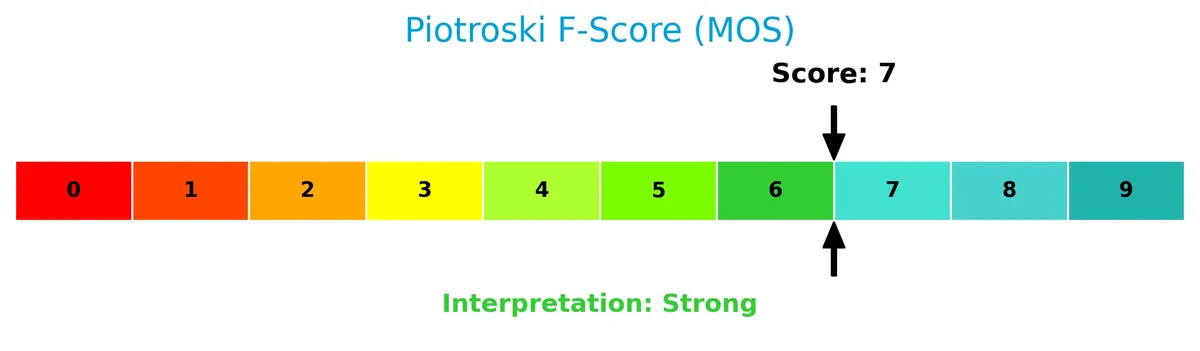
With a strong Piotroski Score of 7, the company demonstrates solid financial health, signaling effective profitability, leverage, and liquidity management.
Competitive Landscape & Sector Positioning
This section examines The Mosaic Company’s strategic positioning, revenue segments, key products, and main competitors. I will analyze whether the company holds a competitive advantage within the agricultural inputs industry.
Strategic Positioning
The Mosaic Company concentrates on crop nutrients, dividing revenue among Phosphates (~4.6B), Potash (~2.7B), and Mosaic Fertilizantes (~4.8B) segments. It operates globally, with significant international and North American exposure, reflecting a focused yet diversified product and geographic portfolio.
Revenue by Segment
This pie chart illustrates The Mosaic Company’s revenue distribution across its key segments for fiscal year 2025, highlighting the relative contribution of each product line.
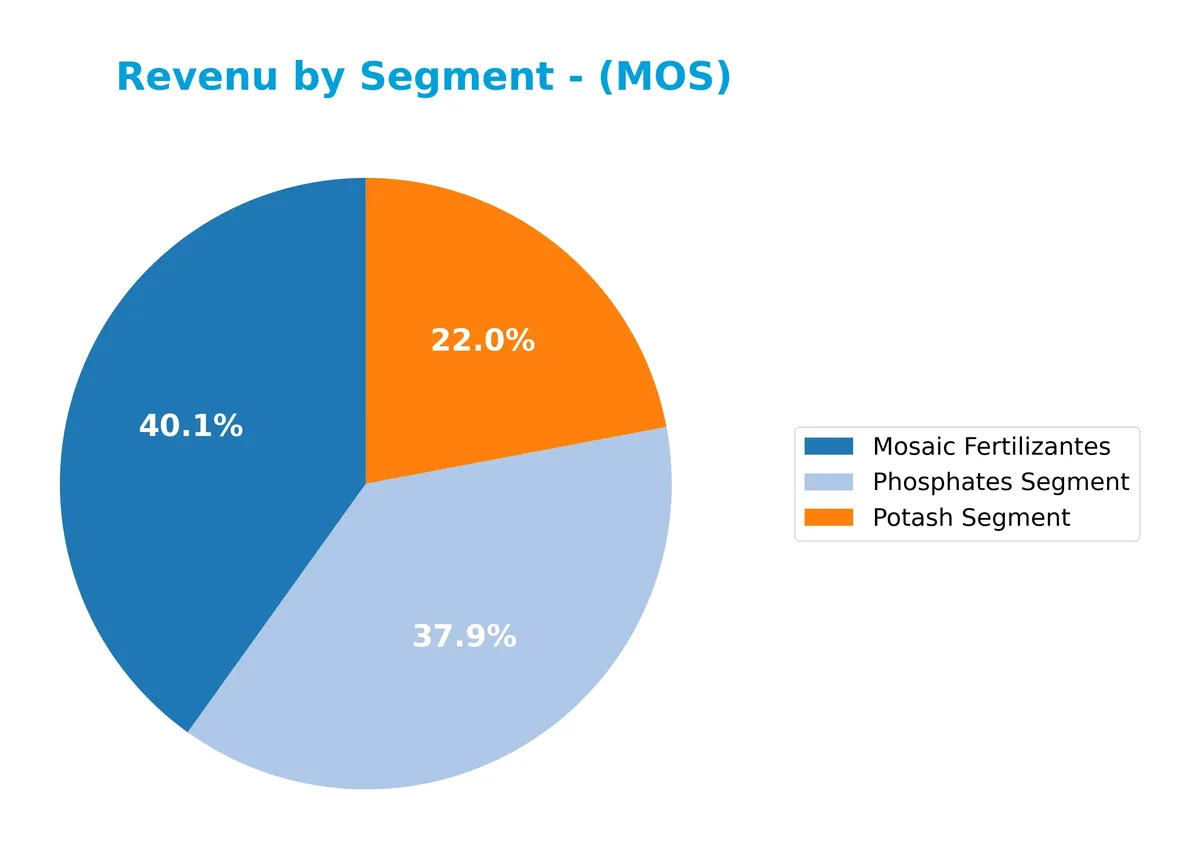
In 2025, Mosaic Fertilizantes leads with $4.85B, closely followed by Phosphates at $4.58B, while Potash contributes $2.66B. Historically, Fertilizantes and Phosphates have driven revenue growth, though Fertilizantes showed a moderate increase from $4.42B in 2024. The Potash segment remains smaller but stable. Recent data indicates a slight concentration risk toward Fertilizantes, reflecting shifting market dynamics and demand patterns.
Key Products & Brands
The Mosaic Company’s main products and brands focus on crop nutrients and related agricultural inputs:
| Product | Description |
|---|---|
| Phosphates Segment | Concentrated phosphate crop nutrients including diammonium phosphate, monoammonium phosphate, and ammoniated phosphate products. |
| Potash Segment | Potash products for mixed crop nutrients, animal feed ingredients, industrial use, de-icing, and water softening. |
| Mosaic Fertilizantes | Fertilizers marketed primarily in Latin America, covering phosphate and potash products tailored for regional agricultural needs. |
The company operates a diversified portfolio centered on essential crop nutrients. Phosphates and potash dominate revenue streams, supported by a growing Mosaic Fertilizantes segment targeting international markets.
Main Competitors
There are 3 main competitors in the Agricultural Inputs industry, with the table showing the top 3 leaders by market capitalization:
| Competitor | Market Cap. |
|---|---|
| Corteva, Inc. | 45.8B |
| CF Industries Holdings, Inc. | 13.3B |
| The Mosaic Company | 7.9B |
The Mosaic Company ranks 3rd among its peers, holding 19.3% of the market cap relative to the leader, Corteva. It sits below both the average market cap of 22.4B for the top competitors and the sector median of 13.3B. The company is 50.9% smaller than its closest rival, CF Industries Holdings, highlighting a significant scale gap within this competitive set.
Comparisons with competitors
Check out how we compare the company to its competitors:
Does MOS have a competitive advantage?
The Mosaic Company lacks a competitive advantage, as its ROIC is significantly below WACC and trending downward, indicating persistent value destruction and declining profitability. Despite favorable recent income statement growth metrics, the company struggles to generate returns exceeding its capital costs.
Looking ahead, Mosaic operates in agricultural inputs with established phosphate and potash products and a global footprint. Opportunities may arise from expanding international markets and developing innovative crop nutrient solutions, potentially improving future competitive positioning.
SWOT Analysis
This analysis identifies The Mosaic Company’s strategic position by highlighting internal and external factors.
Strengths
- diversified product portfolio
- strong market presence in phosphate and potash
- low debt levels
Weaknesses
- declining ROIC indicates value destruction
- weak liquidity quick ratio (0.47)
- net margin and ROE below industry benchmarks
Opportunities
- rising global fertilizer demand
- expansion in emerging markets
- innovation in sustainable crop nutrients
Threats
- commodity price volatility
- regulatory changes in agriculture
- environmental and geopolitical risks
Mosaic’s strengths in product diversity and low leverage support resilience. However, declining profitability demands strategic focus on operational efficiency. Growth hinges on capitalizing global demand while managing sector volatility.
Stock Price Action Analysis
The weekly stock chart for The Mosaic Company (MOS) highlights price movements and key levels over the past 12 months:
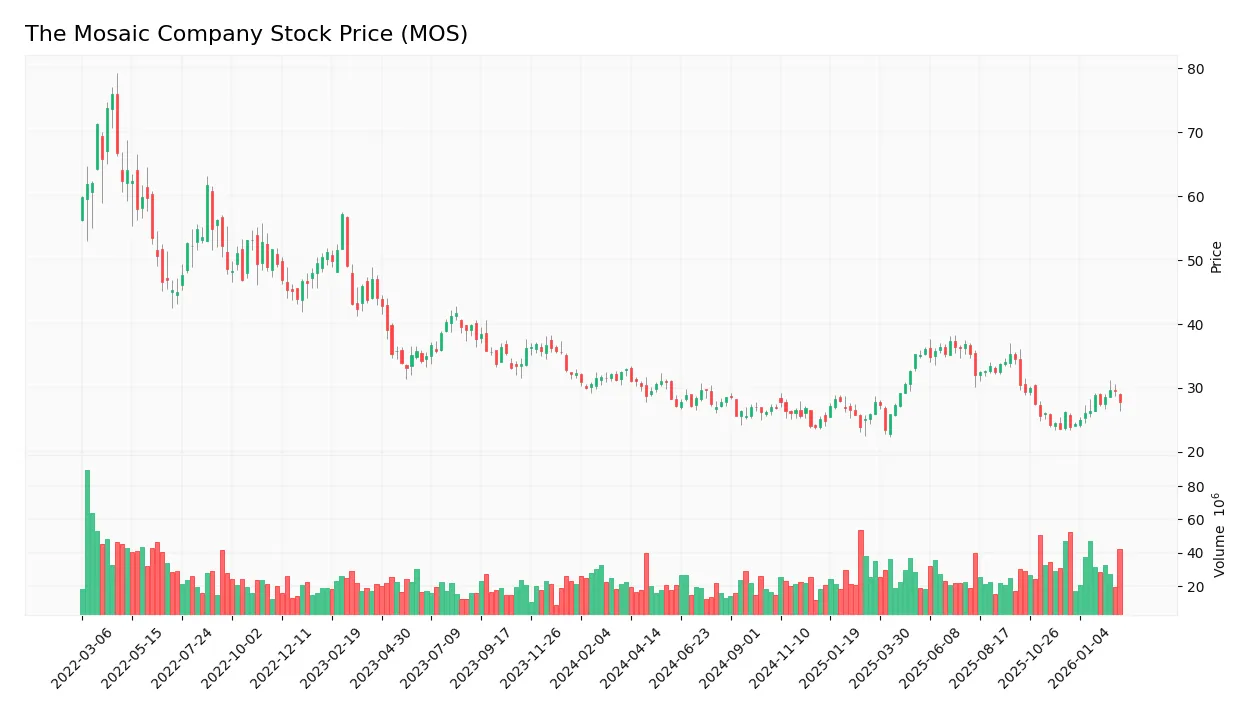
Trend Analysis
Over the past 12 months, MOS stock declined by 15.51%, indicating a bearish trend with accelerating downward momentum. The price ranged from a high of 37.27 to a low of 23.45, showing notable volatility with a 3.65 standard deviation. Recent months show a 6.22% recovery with a moderate upward slope.
Volume Analysis
Trading volume has increased lately, totaling 2.9B shares overall. Buyer volume leads at 51.74% historically, surging to 64.54% dominance recently. This buyer-driven activity suggests strengthening investor interest and higher market participation since December 2025.
Target Prices
The analyst consensus for The Mosaic Company targets a price range between $27 and $44.
| Target Low | Target High | Consensus |
|---|---|---|
| 27 | 44 | 33.8 |
This range reflects moderate upside potential while acknowledging sector volatility and commodity price sensitivity.

Don’t Let Luck Decide Your Entry Point
Optimize your entry points with our advanced ProRealTime indicators. You’ll get efficient buy signals with precise price targets for maximum performance. Start outperforming now!
Analyst & Consumer Opinions
This section examines analyst ratings and consumer feedback to provide a comprehensive view of The Mosaic Company.
Stock Grades
Here is a summary of recent analyst grades for The Mosaic Company from leading firms:
| Grading Company | Action | New Grade | Date |
|---|---|---|---|
| JP Morgan | Downgrade | Underweight | 2026-02-26 |
| RBC Capital | Maintain | Sector Perform | 2026-02-26 |
| Scotiabank | Upgrade | Sector Outperform | 2026-02-02 |
| Wells Fargo | Maintain | Equal Weight | 2026-01-23 |
| RBC Capital | Maintain | Sector Perform | 2026-01-20 |
| Morgan Stanley | Maintain | Equal Weight | 2026-01-14 |
| UBS | Maintain | Buy | 2026-01-12 |
| Mizuho | Maintain | Neutral | 2025-12-18 |
| Barclays | Maintain | Overweight | 2025-12-09 |
| JP Morgan | Maintain | Neutral | 2025-12-05 |
The grading trend shows a mixed outlook, with a recent downgrade by JP Morgan contrasting earlier upgrades and steady holds by other major firms. Most ratings cluster around neutral to sector perform, reflecting cautious sentiment.
Consumer Opinions
Consumer sentiment around The Mosaic Company (MOS) reflects a blend of appreciation for its product quality and concerns about service consistency.
| Positive Reviews | Negative Reviews |
|---|---|
| High-quality fertilizer products that boost crop yields. | Delivery delays impacting planting schedules. |
| Responsive customer service resolving issues quickly. | Pricing volatility creates budgeting challenges. |
| Strong commitment to sustainable agricultural practices. | Limited availability of certain specialty products. |
Overall, consumers praise Mosaic’s product effectiveness and sustainability focus. However, recurring issues with delivery and pricing stability temper enthusiasm.
Risk Analysis
Below is a summary table highlighting key risks facing The Mosaic Company in 2026:
| Category | Description | Probability | Impact |
|---|---|---|---|
| Market Volatility | Fluctuations in commodity prices affecting revenue | High | High |
| Operational Risk | Inefficiencies due to low asset turnover and fixed assets | Medium | Medium |
| Financial Health | Moderate bankruptcy risk indicated by Altman Z-Score | Medium | High |
| Liquidity Risk | Low quick ratio signals potential short-term liquidity issues | Medium | Medium |
| Regulatory Risk | Changes in environmental and agricultural policies | Medium | Medium |
The most pressing risks are market volatility and financial health concerns. Mosaic’s grey zone Altman Z-score of 2.04 signals moderate bankruptcy risk, coupled with unfavorable returns on invested capital (2.3% vs. 8.9% WACC). Low quick ratio (0.47) also raises liquidity red flags. These factors demand cautious monitoring despite favorable valuation metrics.
Should You Buy The Mosaic Company?
The Mosaic Company appears to be a profitable entity with moderate operational efficiency but shows a very unfavorable, declining moat, indicating value erosion. Despite manageable leverage, its overall A rating suggests a cautiously favorable profile, tempered by financial cycle risks.
Strength & Efficiency Pillars
The Mosaic Company exhibits operational resilience with an EBIT margin of 11.89% and favorable interest expense at 1.81%. Despite a modest net margin of 4.49% and ROIC at 2.34%, these efficiency metrics are underwhelming relative to the WACC of 8.86%. I note that the company is not a value creator, as ROIC lags WACC. However, debt-to-equity at 0.06 and interest coverage of 6.58 indicate prudent leverage management, supporting operational stability amid challenging profitability.
Weaknesses and Drawbacks
The company’s Altman Z-Score of 2.04 places it in the grey zone, signaling moderate bankruptcy risk that warrants caution. Net margin (4.49%), ROE (4.47%), and ROIC (2.34%) are all unfavorable, highlighting profitability struggles. Asset turnover ratios also remain weak, indicating inefficient use of assets. While valuation metrics such as P/E at 14.14 and P/B at 0.63 appear reasonable, the bearish overall stock trend (-15.51%) and recent cautious market behavior suggest limited momentum, creating near-term headwinds.
Our Final Verdict about The Mosaic Company
Despite operational strengths and a strong Piotroski score of 7, The Mosaic Company’s grey zone Z-Score of 2.04 signals moderate solvency risk. The profile might appear suitable for investors comfortable with some financial uncertainty. However, ongoing profitability challenges and bearish stock trend suggest a cautious stance. This company could warrant a wait-and-see approach until clearer signs of financial stabilization and improved returns emerge.
Disclaimer: This content is for informational purposes only and does not constitute financial, investment, or other professional advice. Investing in financial markets involves a significant risk of loss, and past performance is not indicative of future results.
Additional Resources
- Decoding The Mosaic Co (MOS): A Strategic SWOT Insight – GuruFocus (Feb 28, 2026)
- Mosaic (MOS) Is Down 5.4% After Q4 Loss Highlights Profit Squeeze Amid Cost-Cutting Pivot – simplywall.st (Feb 28, 2026)
- RBC Capital Lowers Mosaic (MOS) Outlook Following Earnings Miss and Cash Flow Concerns – Yahoo Finance (Feb 27, 2026)
- AXQ Capital LP Has $373,000 Stock Position in The Mosaic Company $MOS – MarketBeat (Feb 26, 2026)
- MOSAIC ANNOUNCES FOURTH QUARTER AND FULL YEAR 2025 RESULTS – TradingView (Feb 24, 2026)
For more information about The Mosaic Company, please visit the official website: mosaicco.com