Home > Analyses > Consumer Defensive > The Kroger Co.
Kroger shapes how millions access daily essentials, blending convenience with quality across its vast supermarket network. As a dominant force in U.S. grocery retail, it innovates through diverse store formats—from organic-focused markets to price-impact warehouses—and integrates fresh, pharmacy, and fuel services. Kroger’s brand commands loyalty and scale in a fiercely competitive industry. Now, investors must ask: does Kroger’s operational strength still justify its current valuation and growth outlook?
Table of contents
Business Model & Company Overview
The Kroger Co., founded in 1883 and headquartered in Cincinnati, Ohio, commands a dominant position in the U.S. grocery sector. With 2,726 supermarkets across 35 states and the District of Columbia, it operates a diverse retail ecosystem. This spans combination food and drug stores, multi-department outlets, marketplace stores, and price impact warehouses, all designed to meet broad consumer needs from fresh organic produce to general merchandise.
Kroger’s revenue engine blends retail sales with food manufacturing, fueling growth through both hardware—its vast store network—and recurring services like its pharmacy and fuel centers. Its footprint spans the Americas with strategic penetration in key urban and suburban markets. The company’s economic moat lies in its integrated supply chain and brand portfolio, shaping the future of grocery retail with scale and efficiency unmatched by peers.
Financial Performance & Fundamental Metrics
I will analyze The Kroger Co.’s income statement, key financial ratios, and dividend payout policy to assess its core financial health and shareholder value.
Income Statement
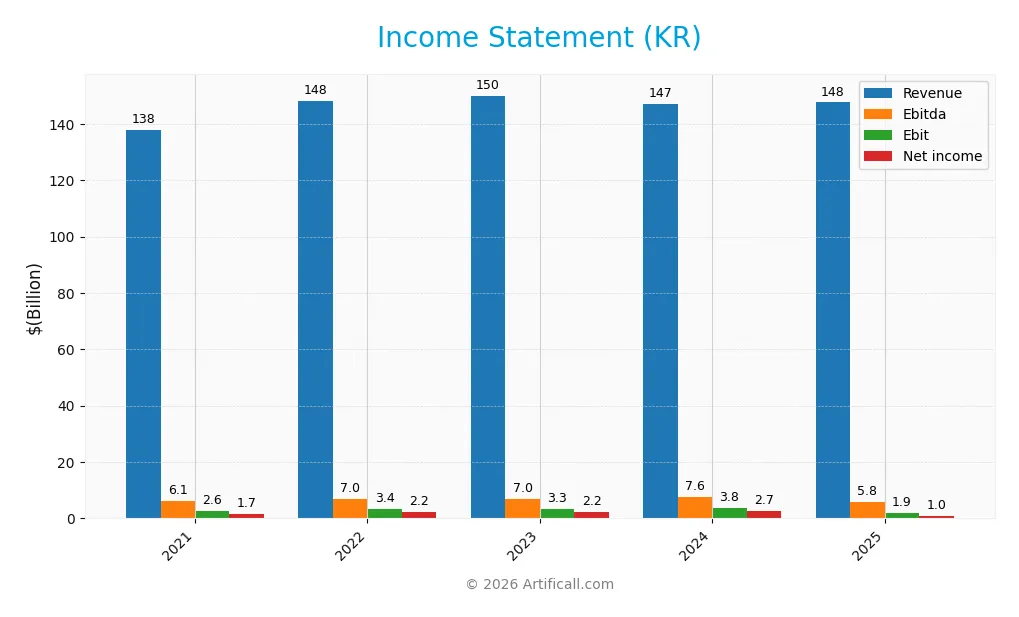
The following table presents The Kroger Co.’s annual income statement highlights from fiscal years 2021 through 2025.
| 2021 | 2022 | 2023 | 2024 | 2025 | |
|---|---|---|---|---|---|
| Revenue | 137.9B | 148.3B | 150.0B | 147.1B | 147.6B |
| Cost of Revenue | 107.5B | 116.5B | 116.7B | 113.7B | 116.6B |
| Operating Expenses | 26.9B | 27.7B | 30.3B | 29.6B | 29.2B |
| Gross Profit | 30.3B | 31.8B | 33.4B | 33.4B | 31.1B |
| EBITDA | 6.1B | 7.0B | 7.0B | 7.6B | 5.8B |
| EBIT | 2.6B | 3.4B | 3.3B | 3.8B | 1.9B |
| Interest Expense | 581M | 544M | 449M | 459M | 639M |
| Net Income | 1.7B | 2.2B | 2.2B | 2.7B | 1.0B |
| EPS | 2.20 | 3.10 | 2.99 | 3.70 | 1.56 |
| Filing Date | 2022-03-29 | 2023-03-28 | 2024-04-02 | 2025-04-01 | 2026-03-05 |
Income Statement Evolution
From 2021 to 2025, Kroger’s revenue grew modestly by 7.1%, showing stability amid sector pressures. However, net income declined sharply by 38.6%, reflecting squeezed profitability. Gross margins remained relatively steady around 21%, but net margins deteriorated significantly, indicating rising costs or margin compression despite stable top-line growth.
Is the Income Statement Favorable?
Kroger’s 2025 income statement reveals weakening fundamentals. Revenue edged up just 0.35%, while gross profit fell nearly 7%. Operating expenses grew in line with revenue, yet EBIT dropped over 50%, signaling operational strain. Net margin fell to 0.69%, with earnings per share down 58%. Interest expense remains low, but overall, the income statement trends appear unfavorable.
Financial Ratios
The table below presents key financial ratios of The Kroger Co. (KR) for the fiscal years 2021 to 2025, reflecting profitability, liquidity, valuation, leverage, and efficiency metrics:
| Ratios | 2021 | 2022 | 2023 | 2024 | 2025 |
|---|---|---|---|---|---|
| Net Margin | 1.2% | 1.5% | 1.4% | 1.8% | 0.7% |
| ROE | 17.5% | 22.3% | 18.6% | 32.2% | 17.1% |
| ROIC | 8.3% | 9.3% | 6.7% | 8.2% | 4.7% |
| P/E | 19.5 | 14.4 | 15.3 | 16.5 | 40.3 |
| P/B | 3.4 | 3.2 | 2.9 | 5.3 | 6.9 |
| Current Ratio | 0.75 | 0.74 | 0.81 | 0.96 | 0.80 |
| Quick Ratio | 0.33 | 0.30 | 0.36 | 0.52 | 0.42 |
| D/E | 2.16 | 2.03 | 1.66 | 3.03 | 4.16 |
| Debt-to-Assets | 42% | 41% | 38% | 48% | 49% |
| Interest Coverage | 6.0x | 7.6x | 6.9x | 8.4x | 3.0x |
| Asset Turnover | 2.81 | 2.99 | 2.97 | 2.80 | 2.96 |
| Fixed Asset Turnover | 4.52 | 4.72 | 4.70 | 4.52 | 4.77 |
| Dividend Yield | 1.8% | 2.1% | 2.4% | 2.0% | 2.2% |
Evolution of Financial Ratios
Over recent years, Kroger’s Return on Equity (ROE) showed a mixed trend, peaking at 32.17% in 2024 before settling to 17.12% in 2025. The Current Ratio declined from 0.96 in 2024 to 0.80 in 2025, indicating weakening liquidity. Meanwhile, the Debt-to-Equity Ratio sharply increased to 4.16 in 2025, signaling rising leverage and financial risk.
Are the Financial Ratios Fovorable?
In 2025, Kroger’s profitability ratios present challenges, with net margin at 0.69% marked unfavorable despite a favorable 17.12% ROE. Liquidity ratios remain weak; the Current Ratio (0.8) and Quick Ratio (0.42) are unfavorable. Leverage is high with Debt-to-Equity at 4.16, also unfavorable, while asset turnover (2.96) and fixed asset turnover (4.77) are favorable. Dividend yield (2.16%) is attractive. Overall, ratios lean slightly unfavorable.
Shareholder Return Policy
The Kroger Co. maintains a dividend payout ratio near 87% in 2025, with dividends per share rising consistently to $1.36. The annual dividend yield hovers around 2.16%, supported by free cash flow coverage, though high payout levels could pressure financial flexibility.
The company also executes share buybacks, balancing distributions with capital needs. This combined strategy suggests a commitment to returning value, but the elevated payout ratio requires monitoring to ensure sustainable, long-term shareholder value creation.
Score analysis
The following radar chart illustrates key financial metric scores for The Kroger Co.:
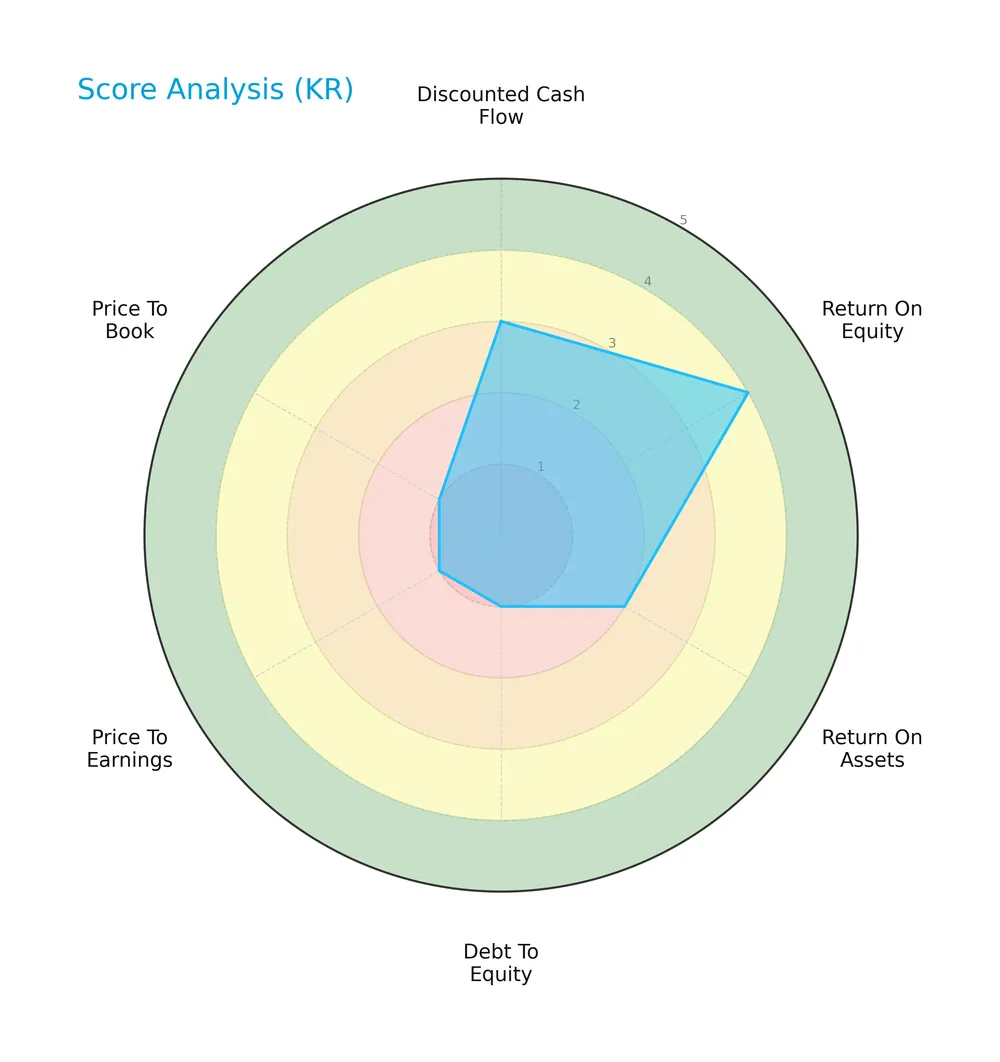
The company shows a moderate discounted cash flow score and a favorable return on equity. However, its return on assets is unfavorable. Debt-to-equity, price-to-earnings, and price-to-book scores are very unfavorable, indicating concerns on leverage and valuation.
Analysis of the company’s bankruptcy risk
The Altman Z-Score places The Kroger Co. firmly in the safe zone, suggesting low bankruptcy risk:

Is the company in good financial health?
The Piotroski Score chart highlights the company’s financial strength based on profitability, leverage, liquidity, and efficiency:

With a strong score of 7, The Kroger Co. demonstrates solid financial health, reflecting robust fundamentals despite some valuation and leverage challenges.
Competitive Landscape & Sector Positioning
This analysis explores The Kroger Co.’s strategic positioning, revenue streams, key products, and main competitors in the grocery sector. I will assess whether Kroger holds a competitive advantage over its rivals based on these factors.
Strategic Positioning
The Kroger Co. maintains a diversified product portfolio spanning perishables, non-perishables, pharmacy, fuel, and other goods. It operates primarily in the US across 35 states and DC, leveraging multiple store formats including supermarkets, multi-department, marketplace, and warehouse stores.
Revenue by Segment
This pie chart illustrates The Kroger Co.’s revenue distribution by product segment for fiscal year 2024, highlighting the company’s focus areas in its latest reported period.
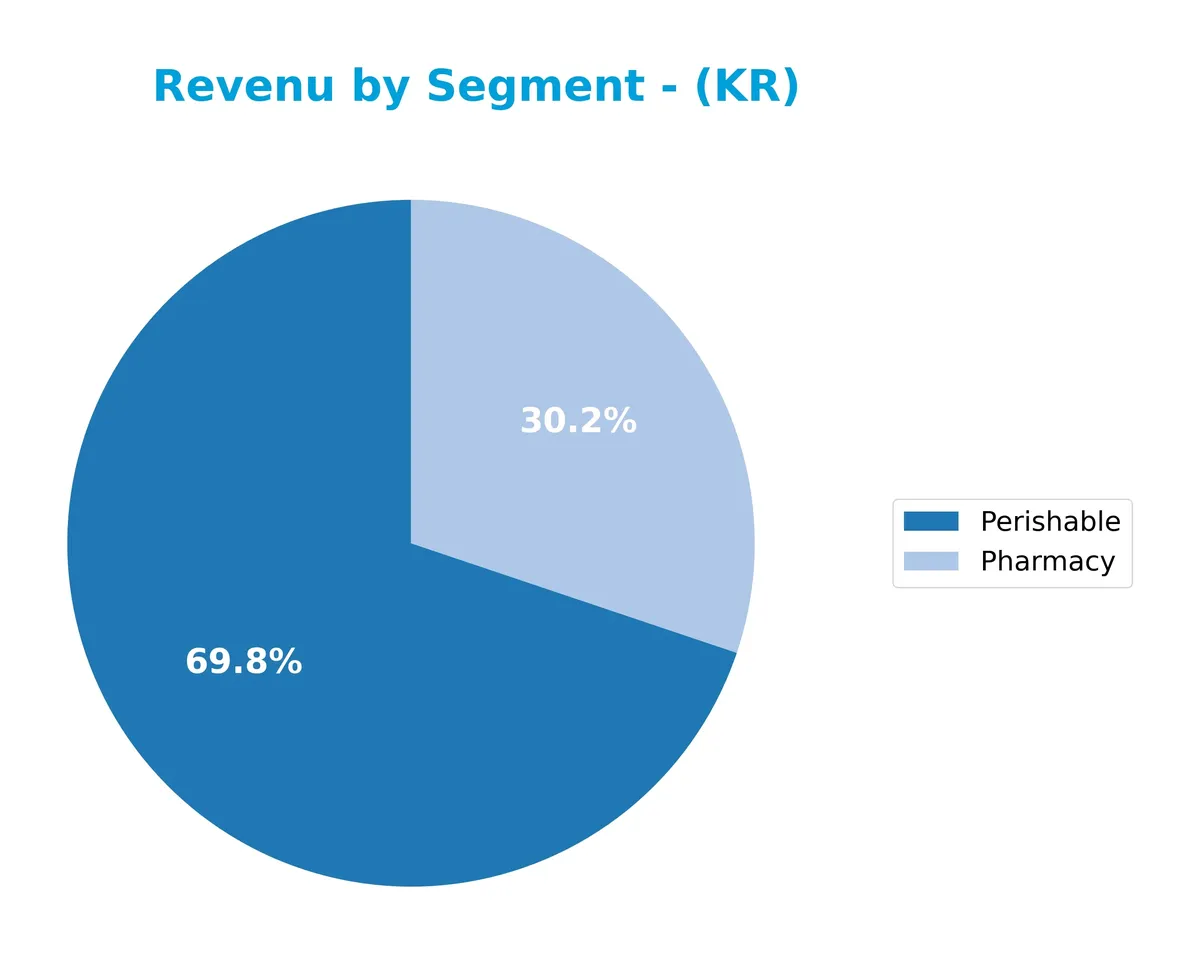
In 2024, Perishable goods generated $36.3B, and Pharmacy contributed $15.7B, marking the only two disclosed segments. Historically, Non Perishable and Fuel segments drove substantial revenue but were excluded in 2024’s data. The latest figures indicate a possible strategic shift toward Perishable and Pharmacy segments, suggesting concentration risks if other segments face headwinds. This trend demands close monitoring for balanced growth.
Key Products & Brands
The Kroger Co.’s primary products and brands span grocery, pharmacy, and fuel retailing:
| Product | Description |
|---|---|
| Perishable | Fresh food items including produce, seafood, meat, dairy, and baked goods sold in stores. |
| Pharmacy | Prescription medications and health-related products available in-store and online. |
| Non Perishable | Packaged and shelf-stable goods such as canned foods, dry groceries, and household items. |
| Fuel | Fuel sales through 1,613 company-operated fuel centers across store locations. |
| Other Product | Miscellaneous goods including general merchandise, apparel, home goods, toys, and pet products. |
Kroger’s product mix focuses heavily on grocery retailing, supported by a significant pharmacy business and fuel sales. This diversified range enhances customer convenience and drives steady revenue across segments.
Main Competitors
The sector includes 2 competitors, with the table listing the top 10 leaders by market capitalization:
| Competitor | Market Cap. |
|---|---|
| The Kroger Co. | 41.7B |
| Albertsons Companies, Inc. | 9.4B |
The Kroger Co. ranks first among its competitors, with a market cap 18% above the top player benchmark. It sits well above both the average market cap of the top 10 (25.6B) and the sector median (25.6B). The company maintains a large lead over Albertsons, its closest rival, highlighting its dominant position.
Comparisons with competitors
Check out how we compare the company to its competitors:
Does KR have a competitive advantage?
KR currently does not present a competitive advantage. Its return on invested capital (ROIC) consistently falls below its weighted average cost of capital (WACC), indicating value destruction and declining profitability.
Looking ahead, KR operates a diverse retail network with over 2,700 stores across 35 states. The company’s broad product mix and fuel centers suggest opportunities for market resilience, though recent margin pressure and growth challenges persist.
SWOT Analysis
This SWOT analysis highlights The Kroger Co.’s critical internal and external factors to guide strategic decisions.
Strengths
- Strong market presence with 2,726 stores
- Diverse product offerings across food, pharmacy, and fuel
- Favorable ROE of 17.12%
- Favorable dividend yield of 2.16%
Weaknesses
- Declining profitability with negative net margin growth
- Unfavorable liquidity ratios (current ratio 0.8, quick ratio 0.42)
- High debt-to-equity ratio of 4.16
- Unfavorable valuation multiples (PE 40.33, PB 6.9)
Opportunities
- Expansion into organic and natural food segments
- Growth in e-commerce and online grocery sales
- Potential to improve operational efficiency and margins
Threats
- Intense competition in grocery retail sector
- Rising input costs squeezing margins
- Economic downturns affecting consumer spending
- Regulatory risks in health and food safety
Kroger’s strengths in scale and product diversity support resilience, but deteriorating profitability and leverage risk demand cautious capital management. The company must seize growth in organic foods and digital channels while navigating fierce competition and margin pressures.
Stock Price Action Analysis
The weekly stock chart below illustrates The Kroger Co.’s price movements and volatility over the past 12 months:
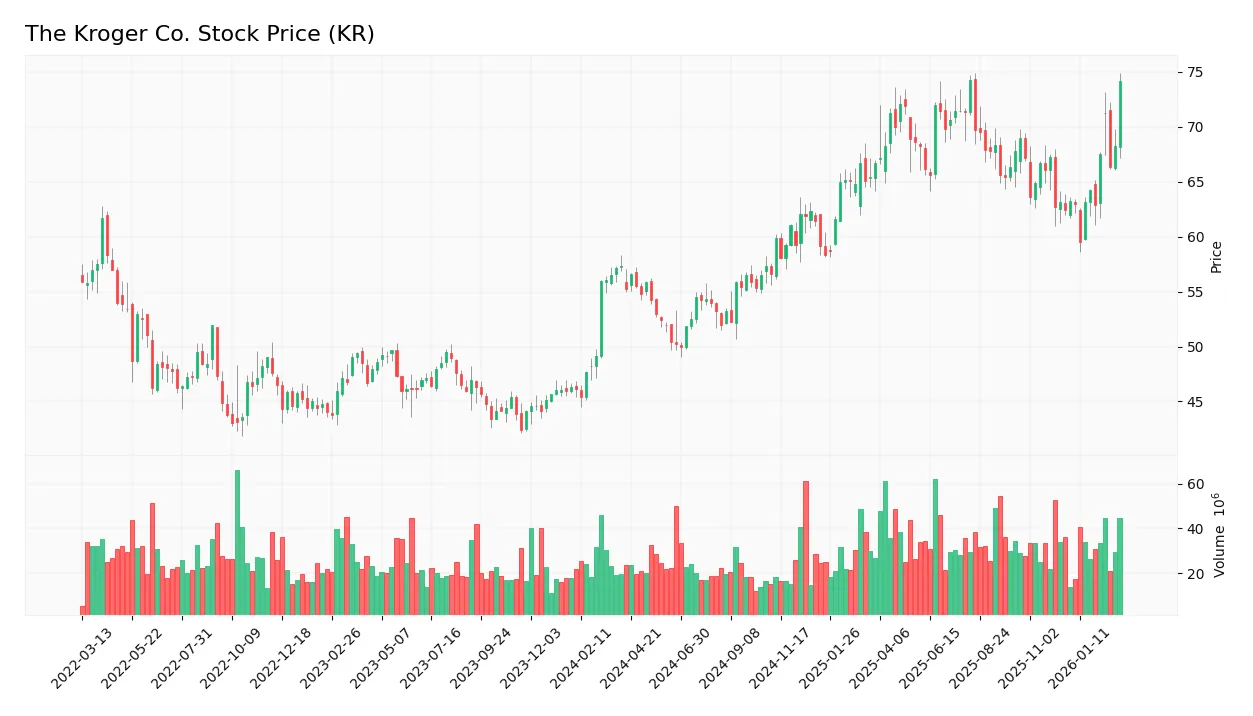
Trend Analysis
Over the past 12 months, Kroger’s stock rose 34.26%, signaling a bullish trend with acceleration. Prices ranged between 49.93 and 74.24. The 6.54 standard deviation reflects moderate volatility. The recent three-month gain of 18.75% confirms sustained upward momentum with a steady slope of 0.94.
Volume Analysis
Trading volume shows an increasing trend with total activity at 3.44B shares. Recent three-month data reveals buyer dominance at 60.68%, contrasting the near-equal split historically. This buyer-driven surge suggests growing investor confidence and stronger market participation.
Target Prices
Analysts project a target price consensus that reflects moderate upside potential for The Kroger Co.
| Target Low | Target High | Consensus |
|---|---|---|
| 68 | 85 | 75.08 |
The target prices suggest analysts expect steady growth, with a range indicating some variability in optimism.

Don’t Let Luck Decide Your Entry Point
Optimize your entry points with our advanced ProRealTime indicators. You’ll get efficient buy signals with precise price targets for maximum performance. Start outperforming now!
Analyst & Consumer Opinions
This section examines The Kroger Co.’s analyst grades and consumer feedback to assess market sentiment and brand perception.
Stock Grades
Here are the latest verified analyst grades for The Kroger Co. from reputable financial institutions:
| Grading Company | Action | New Grade | Date |
|---|---|---|---|
| Morgan Stanley | Maintain | Equal Weight | 2026-03-06 |
| Roth Capital | Maintain | Buy | 2026-03-06 |
| Telsey Advisory Group | Maintain | Outperform | 2026-03-05 |
| Wells Fargo | Downgrade | Equal Weight | 2026-02-25 |
| Guggenheim | Maintain | Buy | 2026-02-10 |
| Telsey Advisory Group | Maintain | Outperform | 2026-02-09 |
| Morgan Stanley | Maintain | Equal Weight | 2026-01-15 |
| Barclays | Maintain | Equal Weight | 2026-01-08 |
| Citigroup | Maintain | Neutral | 2025-12-10 |
| Morgan Stanley | Maintain | Equal Weight | 2025-12-08 |
The grades show a majority of stable “Equal Weight” and “Buy” ratings, with a recent downgrade by Wells Fargo to “Equal Weight.” The consensus leans towards a cautious buy stance with balanced optimism among analysts.
Consumer Opinions
Consumers express mixed feelings about The Kroger Co., reflecting both loyalty and areas for improvement.
| Positive Reviews | Negative Reviews |
|---|---|
| “Kroger offers fresh produce at competitive prices.” | “Long checkout lines frustrate customers regularly.” |
| “The store layout is easy to navigate and well organized.” | “Customer service can be inconsistent across locations.” |
| “Kroger’s loyalty program provides excellent discounts.” | “Some locations have limited stock on popular items.” |
Overall, consumers praise Kroger’s value and store experience but frequently cite slow checkouts and inconsistent service as key weaknesses. These issues could impact customer retention if not addressed promptly.
Risk Analysis
Below is a summary table highlighting key risks for The Kroger Co. in 2026:
| Category | Description | Probability | Impact |
|---|---|---|---|
| Financial Health | High debt-to-equity ratio (4.16) increases leverage risk. | Medium | High |
| Profitability | Low net margin (0.69%) signals tight profit control. | High | Medium |
| Valuation | Elevated P/E (40.33) and P/B (6.9) ratios imply overvaluation. | High | Medium |
| Liquidity | Current ratio (0.8) and quick ratio (0.42) below 1.0 suggest liquidity stress. | Medium | High |
| Interest Coverage | Moderate interest coverage (2.96) limits debt servicing flexibility. | Medium | Medium |
| Market Volatility | Low beta (0.59) reduces market risk exposure but limits upside. | Low | Low |
The most pressing concerns lie in Kroger’s liquidity and valuation metrics. Despite a safe Altman Z-Score (3.66) and strong Piotroski Score (7), its stretched valuation multiples and weak liquidity ratios pose tangible risks. Historically, grocery chains with tight margins and high leverage face amplified pressure during economic slowdowns or rising interest rates. I advise close monitoring of Kroger’s debt management and operational efficiency to mitigate downside risk.
Should You Buy The Kroger Co.?
Analytically, The Kroger Co. appears to be in a safe zone with strong Piotroski scores, suggesting solid financial strength. However, declining ROIC indicates value erosion and a very unfavorable moat. Despite manageable debt concerns, the overall C+ rating reflects mixed operational efficiency and leverage profile.
Strength & Efficiency Pillars
The Kroger Co. shows operational resilience with a favorable return on equity of 17.12%, indicating solid shareholder returns. Its gross margin stands robust at 21.04%, reflecting efficient core operations. However, the return on invested capital (4.7%) falls below the weighted average cost of capital (5.31%), signaling value destruction rather than creation. Despite this, the company benefits from a strong asset turnover ratio of 2.96, suggesting effective use of its asset base. The Altman Z-Score of 3.66 places Kroger safely out of financial distress, supporting its operational stability.
Weaknesses and Drawbacks
Kroger faces serious valuation pressures as evidenced by a high price-to-earnings ratio of 40.33 and a price-to-book ratio of 6.9, both flagged as very unfavorable. These elevated multiples imply the stock trades at a premium, raising concerns about downside risk if growth falters. The leverage profile is a red flag: a debt-to-equity ratio of 4.16 and a weak current ratio of 0.8 highlight liquidity constraints and significant reliance on debt. Net margin remains thin at 0.69%, with recent declines in profitability and earnings per share growth intensifying caution.
Our Final Verdict about The Kroger Co.
The Kroger Co. presents a mixed long-term fundamental profile. While operational metrics and liquidity ratios suggest efficiency, its elevated valuation multiples and deteriorating profitability trends caution investors. The bullish overall stock trend and recent buyer dominance might support momentum-based interest, yet the premium valuation and leverage risks suggest a wait-and-see approach could be prudent. This profile may appear attractive for selective exposure but demands careful risk management.
Disclaimer: This content is for informational purposes only and does not constitute financial, investment, or other professional advice. Investing in financial markets involves a significant risk of loss, and past performance is not indicative of future results.
Additional Resources
- Investor Relations – Kroger (Mar 06, 2026)
- Grantham Mayo Van Otterloo & Co. LLC Sells 66,636 Shares of The Kroger Co. $KR – MarketBeat (Mar 09, 2026)
- The Kroger Co. (KR) Deep Dive: Navigating Disinflation and Strategy Shifts in 2026 – FinancialContent (Mar 05, 2026)
- KR Stock Quote Price and Forecast – CNN (Mar 06, 2026)
- Wolfe Research Maintains Outperform on The Kroger Co. (KR) March 2026 – Meyka (Mar 05, 2026)
For more information about The Kroger Co., please visit the official website: thekrogerco.com