Home > Analyses > Consumer Defensive > The J. M. Smucker Company
The J. M. Smucker Company shapes daily routines with beloved food and pet care brands that fill pantries and pet bowls across America. As an industry leader in packaged foods, Smucker’s portfolio spans iconic products like Folgers coffee, Jif peanut butter, and Meow Mix pet foods, renowned for quality and innovation. With a stronghold in consumer staples, the key question is whether Smucker’s solid fundamentals and steady dividend continue to support its market valuation and future growth potential.
Table of contents
Business Model & Company Overview
The J. M. Smucker Company, founded in 1897 and headquartered in Orrville, Ohio, stands as a dominant player in the packaged foods industry. Its cohesive ecosystem spans U.S. Retail Pet Foods, Coffee, and Consumer Foods, delivering a diverse portfolio including premium coffee, peanut butter, pet snacks, and frozen sandwiches. This broad yet integrated product range under renowned brands serves to meet consumer needs across multiple food and beverage categories.
Smucker’s revenue engine balances robust sales of branded consumer goods with strategic market penetration across the Americas, Europe, and Asia. Its value creation hinges on a mix of direct sales and broker networks reaching food retailers, online platforms, and specialty stores worldwide. This extensive distribution network, combined with a strong brand portfolio, forms a competitive advantage that secures its economic moat and shapes the future trajectory of its industry.
Financial Performance & Fundamental Metrics
I will analyze The J. M. Smucker Company’s income statement, key financial ratios, and dividend payout policy to provide a clear view of its financial health.
Income Statement
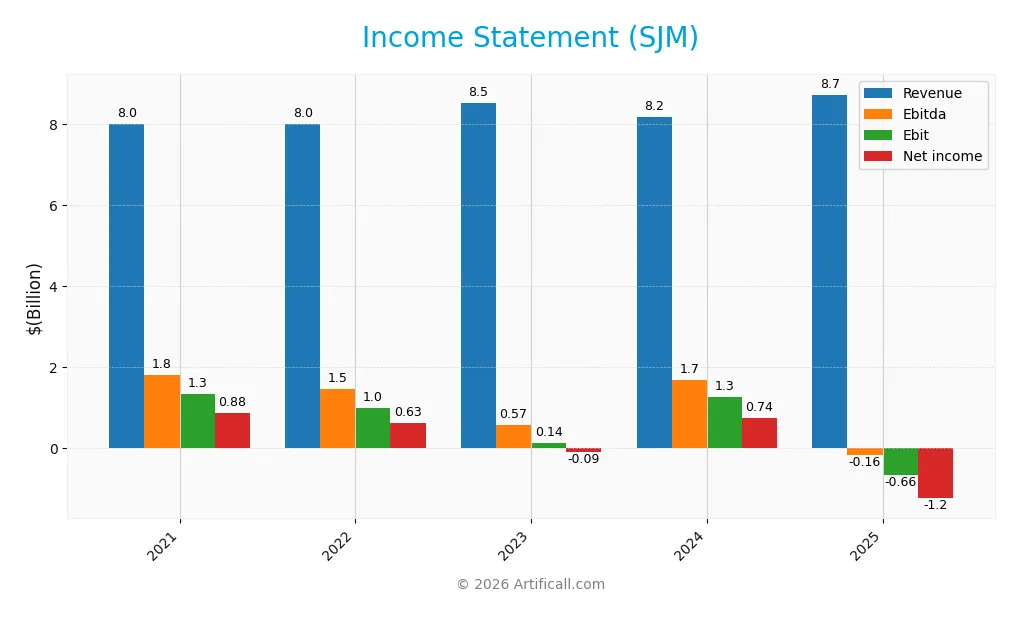
The following table summarizes The J. M. Smucker Company’s key income statement figures for fiscal years 2021 through 2025, all values expressed in USD.
| 2021 | 2022 | 2023 | 2024 | 2025 | |
|---|---|---|---|---|---|
| Revenue | 8.00B | 7.99B | 8.53B | 8.18B | 8.73B |
| Cost of Revenue | 4.86B | 5.30B | 5.73B | 5.06B | 5.34B |
| Operating Expenses | 1.75B | 1.68B | 2.64B | 1.81B | 4.06B |
| Gross Profit | 3.14B | 2.70B | 2.80B | 3.12B | 3.38B |
| EBITDA | 1.80B | 1.46B | 574M | 1.69B | -156M |
| EBIT | 1.35B | 1.00B | 143M | 1.26B | -658M |
| Interest Expense | 177M | 161M | 152M | 251M | 359M |
| Net Income | 876M | 632M | -91M | 744M | -1.23B |
| EPS | 7.79 | 5.84 | -0.86 | 7.14 | -11.57 |
| Filing Date | 2021-06-17 | 2022-06-16 | 2023-06-20 | 2024-06-18 | 2025-06-18 |
Income Statement Evolution
Between 2021 and 2025, The J. M. Smucker Company’s revenue increased moderately by 9.04%, indicating steady top-line growth. However, net income declined sharply by 240.45%, reflecting a significant deterioration in profitability. Gross margins remained relatively favorable at 38.79%, but operating and net margins worsened considerably, with EBIT margin turning negative to -7.54% and net margin to -14.1%, highlighting margin compression over the period.
Is the Income Statement Favorable?
In fiscal 2025, revenue grew by 6.69%, but this was accompanied by unfavorable expense growth and a sharp decline in EBIT and net income, resulting in a negative net margin of -14.1%. Interest expenses remained favorable at 4.11% of revenue, but overall profitability fundamentals are unfavorable due to significant losses, negative EPS of -11.57, and deteriorating earnings quality, signaling financial strain despite stable gross profitability.
Financial Ratios
Below is a summary table of key financial ratios for The J. M. Smucker Company (SJM) over recent fiscal years, providing a clear view of its profitability, valuation, liquidity, leverage, and efficiency metrics:
| Ratios | 2021 | 2022 | 2023 | 2024 | 2025 |
|---|---|---|---|---|---|
| Net Margin | 11% | 8% | -1% | 9% | -14% |
| ROE | 11% | 8% | -1% | 10% | -20% |
| ROIC | 7% | 5% | 1% | 5% | -4% |
| P/E | 17 | 23 | -183 | 16 | -10 |
| P/B | 1.81 | 1.82 | 2.29 | 1.55 | 2.03 |
| Current Ratio | 0.68 | 1.03 | 1.44 | 0.52 | 0.81 |
| Quick Ratio | 0.34 | 0.47 | 0.93 | 0.25 | 0.35 |
| D/E | 0.60 | 0.57 | 0.61 | 1.11 | 1.28 |
| Debt-to-Assets | 30% | 29% | 30% | 42% | 44% |
| Interest Coverage | 7.8 | 6.4 | 1.0 | 5.2 | -1.9 |
| Asset Turnover | 0.49 | 0.50 | 0.57 | 0.40 | 0.50 |
| Fixed Asset Turnover | 3.73 | 3.57 | 3.64 | 2.52 | 2.73 |
| Dividend Yield | 2.7% | 2.8% | 2.6% | 3.7% | 3.7% |
Evolution of Financial Ratios
Between 2021 and 2025, The J. M. Smucker Company’s Return on Equity (ROE) declined sharply, turning negative at -20.23% in 2025. The Current Ratio showed volatility, peaking at 1.44 in 2023 before declining to 0.81 in 2025, indicating reduced liquidity. The Debt-to-Equity Ratio increased from around 0.60 to 1.28, reflecting rising leverage. Profitability margins also deteriorated, with net margin falling from positive figures to -14.1% in 2025.
Are the Financial Ratios Favorable?
In 2025, profitability ratios such as net margin (-14.1%) and ROE (-20.23%) were unfavorable, while the Weighted Average Cost of Capital (WACC) was favorable at 4.48%. Liquidity ratios, including the Current Ratio (0.81) and Quick Ratio (0.35), were below 1, signaling potential short-term constraints. Leverage ratios were generally negative, with Debt-to-Equity at 1.28 and interest coverage at -1.84. Market valuation ratios were mixed: price-to-earnings was favorable due to its negative value, price-to-book neutral, and dividend yield favorable at 3.68%. Overall, the financial ratio profile was predominantly unfavorable in 2025.
Shareholder Return Policy
The J.M. Smucker Company has consistently paid dividends, with dividend per share rising from $3.59 in 2021 to $4.28 in 2025, accompanied by a dividend yield around 3.6%. However, the 2025 fiscal year shows a negative net profit margin and a dividend payout ratio of -37%, indicating dividends were paid despite losses, which may raise sustainability concerns.
No explicit share buyback programs are noted. The company’s free cash flow covers dividends and capital expenditures, yet recurring operating losses suggest risk in maintaining distributions at current levels. This policy may strain long-term shareholder value if profitability does not recover.
Score analysis
The following radar chart illustrates the company’s performance across key financial scores:
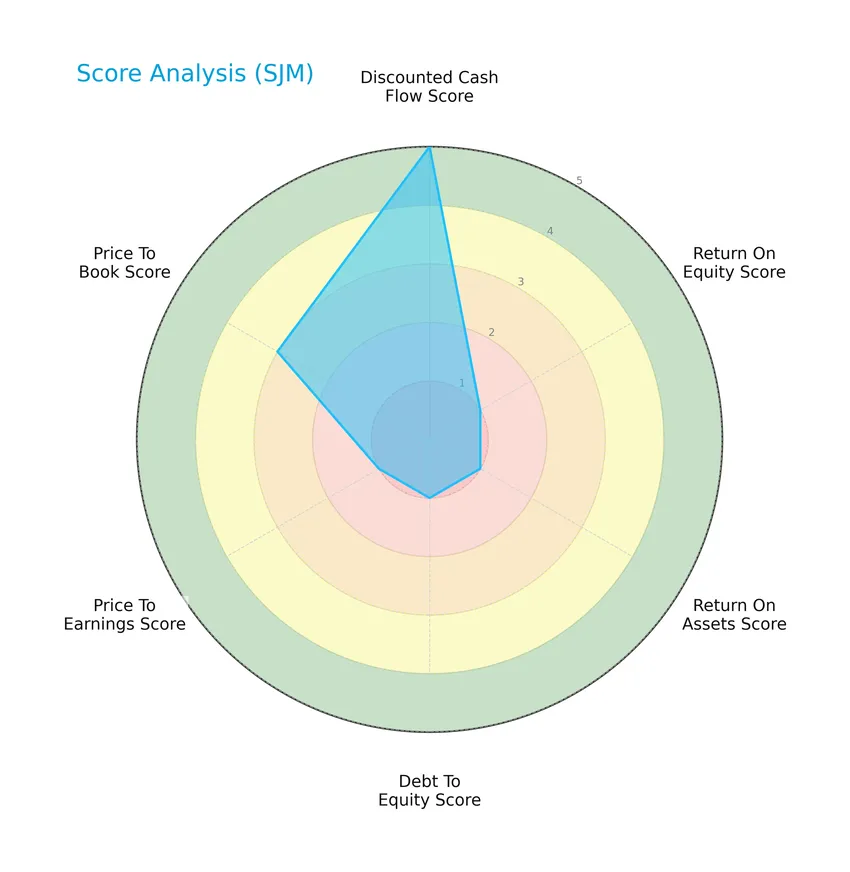
The J. M. Smucker Company shows a very favorable discounted cash flow score of 5, but faces challenges with very unfavorable scores in return on equity, return on assets, debt to equity, and price to earnings, while its price to book ratio is moderate at 3.
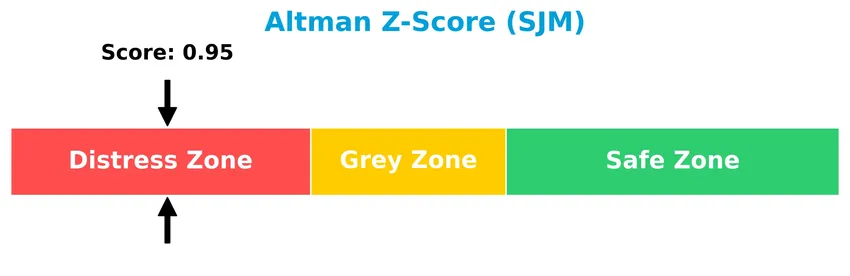
Analysis of the company’s bankruptcy risk
The Altman Z-Score reveals that the company is currently in the distress zone, indicating a high risk of bankruptcy:
Is the company in good financial health?
The Piotroski Score diagram provides insight into the company’s financial strength based on nine key criteria:
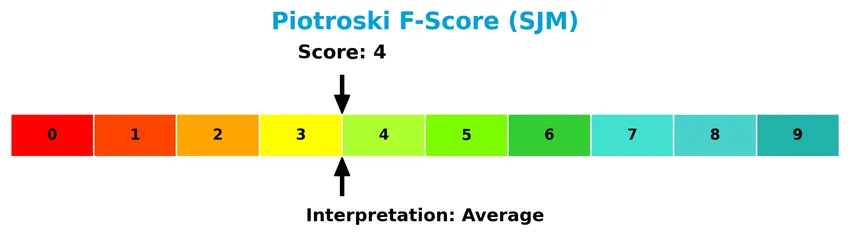
With a Piotroski Score of 4, The J. M. Smucker Company is classified as average, suggesting moderate financial health but room for improvement in profitability and efficiency metrics.
Competitive Landscape & Sector Positioning
This sector analysis will explore The J. M. Smucker Company’s strategic positioning, revenue by segment, key products, main competitors, and competitive advantages. I will assess whether the company holds a competitive advantage within the packaged foods industry.
Strategic Positioning
The J. M. Smucker Company maintains a diversified product portfolio across U.S. Retail Pet Foods (1.66B in 2025), Coffee (2.81B), Consumer Foods (1.88B), Sweet Baked Snacks (1.18B), and International/Away From Home channels (1.20B). Geographically, it is predominantly U.S.-focused, with 8.25B revenue domestically and 608M internationally in 2025.
Revenue by Segment
This pie chart displays The J. M. Smucker Company’s revenue distribution by segment for the fiscal year 2025, highlighting the relative contribution of each business area.
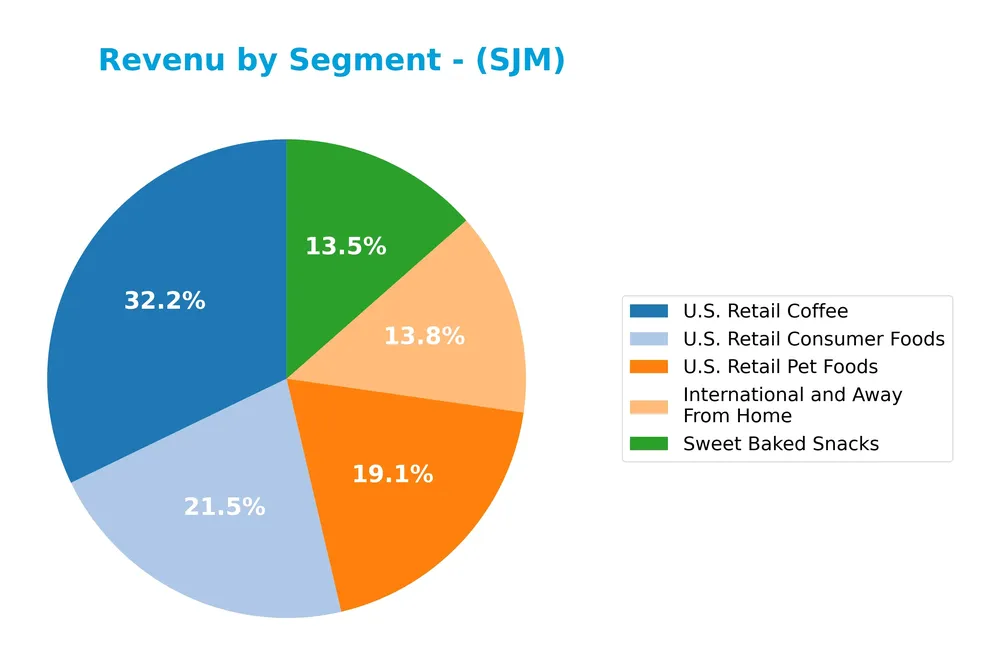
In 2025, U.S. Retail Coffee was the largest revenue driver with 2.81B, followed by U.S. Retail Consumer Foods at 1.88B and U.S. Retail Pet Foods at 1.66B. Sweet Baked Snacks and International and Away From Home contributed 1.18B and 1.20B respectively. Notably, Sweet Baked Snacks showed a significant increase compared to prior years, indicating a potential growth area, while U.S. Retail Pet Foods experienced a decline from previous peaks, suggesting a shift in segment dynamics.
Key Products & Brands
The J. M. Smucker Company operates with a diversified portfolio of key products and brands across several food and beverage categories:
| Product | Description |
|---|---|
| U.S. Retail Pet Foods | Dog and cat food, pet snacks, including brands like Meow Mix, 9Lives, Kibbles ‘n Bits, Milk-Bone, Pup-Peroni, Rachael Ray Nutrish, and Nature’s Recipe. |
| U.S. Retail Coffee | Mainstream roast, ground, single serve, and premium coffee products under Folgers, Café Bustelo, Dunkin’, and 1850 brands. |
| U.S. Retail Consumer Foods | Peanut butter, specialty spreads, fruit spreads, shortening and oils, frozen sandwiches and snacks, juices, beverages, baking mixes and ingredients. Brands include Jif, Smucker’s, Smucker’s Uncrustables, Robin Hood, and Five Roses. |
| Sweet Baked Snacks | Frozen handheld products and other sweet snacks (segment revenue included separately in recent years). |
| International and Away From Home | Foodservice hot beverage, portion control, flour products, and other consumer foods sold internationally and in away-from-home markets. |
The J. M. Smucker Company’s product range spans pet foods, coffee, consumer foods, and snacks, supported by strong brand recognition in U.S. retail and international markets.
Main Competitors
There are 11 competitors in total, with the table below listing the top 10 leaders by market capitalization:
| Competitor | Market Cap. |
|---|---|
| JBS N.V. | 32B |
| The Kraft Heinz Company | 29B |
| General Mills, Inc. | 25B |
| McCormick & Company, Incorporated | 18B |
| Hormel Foods Corporation | 13B |
| The J. M. Smucker Company | 10.3B |
| The Magnum Ice Cream Company N.V. | 9.7B |
| Pilgrim’s Pride Corporation | 9.3B |
| Conagra Brands, Inc. | 8.3B |
| Campbell Soup Company | 8.3B |
The J. M. Smucker Company ranks 6th among its competitors, holding about 34.2% of the market cap of the sector leader, JBS N.V. It is positioned below the average market capitalization of the top 10 competitors (16.2B) but above the sector median (10.3B). The company maintains a +17.62% market cap gap over its closest competitor above, indicating a moderate lead within the mid-tier cluster.
Comparisons with competitors
Check out how we compare the company to its competitors:
Does SJM have a competitive advantage?
The J. M. Smucker Company does not currently present a competitive advantage, as it is showing a very unfavorable economic moat with a declining ROIC and value destruction over the 2021-2025 period. Its profitability metrics, including negative EBIT and net margins, further indicate challenges in maintaining efficient capital use and sustaining excess returns.
Looking forward, SJM’s diverse portfolio spanning pet foods, coffee, and consumer foods, along with its established brand presence in the United States, suggests potential growth opportunities. Expansion into new markets or product innovations could alter its competitive positioning, though recent financial trends advise cautious monitoring of operational improvements.
SWOT Analysis
This SWOT analysis highlights The J. M. Smucker Company’s key internal and external factors to guide strategic investment decisions.
Strengths
- Strong brand portfolio with leading names
- Stable revenue base primarily from U.S. market
- Favorable gross margin of 38.79%
Weaknesses
- Negative EBIT and net margins indicating profitability issues
- Declining ROIC and value destruction
- Weak liquidity ratios and high debt-to-equity ratio
Opportunities
- Expansion potential in international markets
- Growing demand for premium and specialty food products
- Opportunity to improve operational efficiency and cost management
Threats
- Intense competition in packaged foods and pet foods
- Rising input costs impacting margins
- Economic uncertainty affecting consumer spending
Overall, Smucker faces significant profitability and financial health challenges that require strategic focus on cost control and margin improvement. Expanding internationally and leveraging brand strength could mitigate risks and support sustainable growth.
Stock Price Action Analysis
The weekly stock chart below illustrates The J. M. Smucker Company’s price movements and volatility over the past 100 weeks:
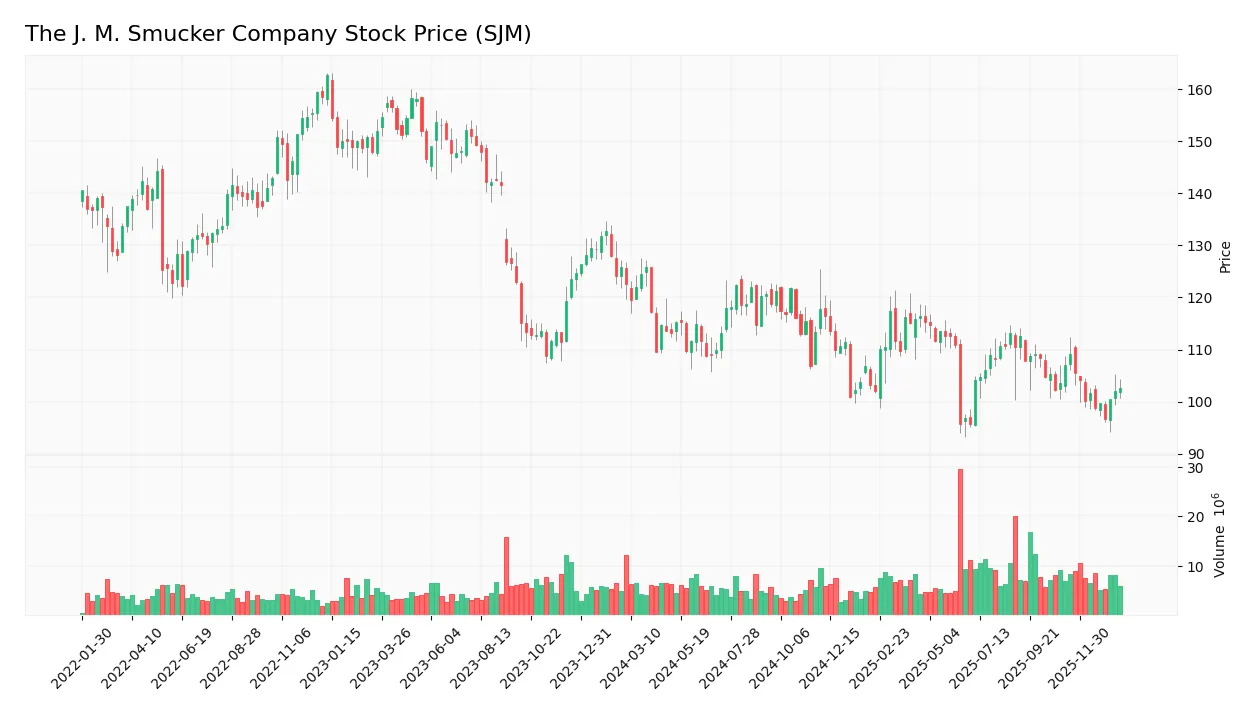
Trend Analysis
Over the past 12 months, SJM’s stock price declined by 16.33%, indicating a bearish trend. The highest price reached 125.87 and the lowest was 95.63. The trend shows deceleration with a standard deviation of 6.85, reflecting moderate volatility without acceleration in price declines.
Volume Analysis
Trading volume has been increasing, with buyer activity slightly dominating at 54.61% over the last three months. Buyer volume totals 49.4M versus seller volume of 41.1M, suggesting cautious but persistent buying interest and moderate market participation during this period.
Target Prices
The consensus target prices for The J. M. Smucker Company (SJM) suggest moderate upside potential.
| Target High | Target Low | Consensus |
|---|---|---|
| 117 | 105 | 111.4 |
Analysts expect SJM’s stock price to range between 105 and 117, with an average consensus target of 111.4, indicating a generally positive outlook.

Don’t Let Luck Decide Your Entry Point
Optimize your entry points with our advanced ProRealTime indicators. You’ll get efficient buy signals with precise price targets for maximum performance. Start outperforming now!
Analyst & Consumer Opinions
This section examines recent analyst ratings and consumer feedback related to The J. M. Smucker Company (SJM).
Stock Grades
Below is a summary table presenting recent grades assigned to The J. M. Smucker Company by recognized financial institutions:
| Grading Company | Action | New Grade | Date |
|---|---|---|---|
| Morgan Stanley | Downgrade | Equal Weight | 2026-01-16 |
| TD Cowen | Maintain | Hold | 2026-01-08 |
| Stifel | Maintain | Hold | 2025-11-26 |
| UBS | Maintain | Buy | 2025-11-26 |
| Morgan Stanley | Maintain | Overweight | 2025-11-26 |
| Bernstein | Maintain | Market Perform | 2025-11-26 |
| JP Morgan | Maintain | Overweight | 2025-11-26 |
| Stifel | Maintain | Hold | 2025-10-24 |
| Argus Research | Downgrade | Hold | 2025-09-12 |
| Barclays | Maintain | Equal Weight | 2025-08-29 |
The overall trend indicates a predominance of Hold and Equal Weight ratings, with a few Buy and Overweight positions maintained by certain firms. Recent downgrades from Buy/Overweight to Hold/Equal Weight suggest a cautious outlook among some analysts.
Consumer Opinions
Consumers of The J. M. Smucker Company (SJM) express a mix of appreciation and concern, reflecting diverse experiences with the brand’s products.
| Positive Reviews | Negative Reviews |
|---|---|
| “The quality of Smucker’s jams and spreads is consistently excellent and natural tasting.” | “Some products are priced higher compared to competitors without a clear quality difference.” |
| “I appreciate their commitment to sustainable sourcing and transparent labeling.” | “Occasionally, packaging is not user-friendly, making it hard to reseal or store.” |
| “Their variety of flavors offers great options for all tastes and dietary preferences.” | “Customer service response times can be slow when addressing product issues.” |
Overall, consumer feedback highlights The J. M. Smucker Company’s strong product quality and variety, while pricing and packaging usability appear as recurring concerns. This suggests opportunities for improving customer satisfaction through better value and convenience.
Risk Analysis
The table below summarizes the key risks facing The J. M. Smucker Company (SJM), highlighting their likelihood and potential impact on investment value:
| Category | Description | Probability | Impact |
|---|---|---|---|
| Financial Health | Negative net margin (-14.1%) and ROE (-20.23%) indicate ongoing profitability challenges. | High | High |
| Liquidity Risk | Current ratio (0.81) and quick ratio (0.35) below 1 signal potential short-term liquidity issues. | Medium | Medium |
| Leverage Risk | High debt-to-equity ratio (1.28) and negative interest coverage (-1.84) increase default risk. | Medium | High |
| Market Volatility | Low beta (0.22) suggests limited stock price volatility but also reduced upside potential. | Low | Low |
| Bankruptcy Risk | Altman Z-Score of 0.95 places the company in the distress zone, indicating elevated bankruptcy risk. | High | Very High |
| Operational Risk | Below-average asset turnover (0.5) may reflect inefficiencies affecting revenue generation. | Medium | Medium |
The most critical risks for SJM are its financial distress indicated by a very low Altman Z-Score and persistent profitability losses, which pose significant threats to long-term viability. Liquidity and leverage concerns add to the risk profile, requiring cautious investment consideration.
Should You Buy The J. M. Smucker Company?
The J. M. Smucker Company appears to be navigating a challenging profitability landscape with declining operational efficiency and a deteriorating competitive moat suggesting value destruction. Despite a manageable leverage profile, its overall C+ rating and distress-zone Altman Z-score indicate moderate financial risk, warranting cautious analytical interpretation.
Strength & Efficiency Pillars
The J. M. Smucker Company exhibits moderate value creation signals, supported by a weighted average cost of capital (WACC) of 4.48%, which is favorable. However, its return on invested capital (ROIC) stands at -4.33%, well below the WACC, indicating the company is currently destroying value rather than creating it. Profitability metrics paint a challenging picture with a negative net margin of -14.1% and a return on equity (ROE) of -20.23%. Financial health scores are mixed: an Altman Z-score of 0.95 places the company in the distress zone, signaling high bankruptcy risk, while a Piotroski score of 4 suggests average financial strength.
Weaknesses and Drawbacks
SJM faces significant headwinds, particularly in valuation and leverage. Its price-to-earnings ratio of -10.05, though technically favorable, reflects negative earnings, which complicates valuation clarity. The debt-to-equity ratio of 1.28 and low liquidity ratios—current ratio at 0.81 and quick ratio at 0.35—underline a strained balance sheet and potential short-term liquidity risks. Market pressure is evident with a bearish overall stock trend, a 16.33% price decline, and deceleration in price movement. Although recent buyer dominance at 54.61% signals some support, the firm’s financial distress and operational inefficiencies remain significant concerns.
Our Verdict about The J. M. Smucker Company
The fundamental profile of The J. M. Smucker Company appears unfavorable due to persistent negative profitability, value destruction, and financial distress indicators. While recent trading data show slight buyer dominance, the overall bearish trend and weakening operational metrics suggest caution. Despite some market interest, the profile may appear risky for long-term exposure and could warrant a wait-and-see approach until clearer signs of financial recovery emerge.
Disclaimer: This content is for informational purposes only and does not constitute financial, investment, or other professional advice. Investing in financial markets involves a significant risk of loss, and past performance is not indicative of future results.
Additional Resources
- JM Smucker’s coffee sales rise: Is pricing still the key driver? – MSN (Jan 24, 2026)
- Rakuten Investment Management Inc. Makes New Investment in The J. M. Smucker Company $SJM – MarketBeat (Jan 22, 2026)
- The J.M. Smucker Co. Declares Dividend – PR Newswire (Jan 16, 2026)
- J. M. Smucker’s Q3 2026 Earnings: What to Expect – Yahoo Finance (Jan 22, 2026)
- Morgan Stanley Downgrades J.M. Smucker As Pressures Contrast With Valuation – Sahm (Jan 22, 2026)
For more information about The J. M. Smucker Company, please visit the official website: jmsmucker.com