Home > Analyses > Consumer Cyclical > The Home Depot, Inc.
The Home Depot transforms everyday spaces into personalized sanctuaries through its vast selection of building materials and home improvement solutions. As the industry’s powerhouse, it commands market influence with over 2,300 stores and a robust e-commerce platform serving both DIY homeowners and professional contractors. Renowned for innovation in product variety and installation services, it shapes how Americans renovate and maintain their homes. The key question remains: does its strong brand and scale justify current valuations amid evolving consumer trends?

Table of contents
Business Model & Company Overview
The Home Depot, Inc., founded in 1978 and headquartered in Atlanta, GA, stands as a dominant force in the home improvement industry. With 2,317 stores across the U.S. and a workforce of 470K employees, it delivers a comprehensive ecosystem of building materials, décor, tools, and installation services. The company serves a wide customer base, from homeowners to professional contractors, integrating retail and services into a unified mission to enhance living and working spaces.
The company’s revenue engine balances robust retail sales with growing installation and rental services, creating a steady mix of transactional and recurring income. It leverages physical stores and digital platforms, including homedepot.com and blinds.com, to target markets across the Americas. This multi-channel approach fortifies its competitive advantage, underpinning an economic moat built on scale, brand recognition, and service integration that shapes the future of home improvement retail.
Financial Performance & Fundamental Metrics
I analyze The Home Depot’s income statement, key financial ratios, and dividend payout policy to reveal its value and growth sustainability.
Income Statement
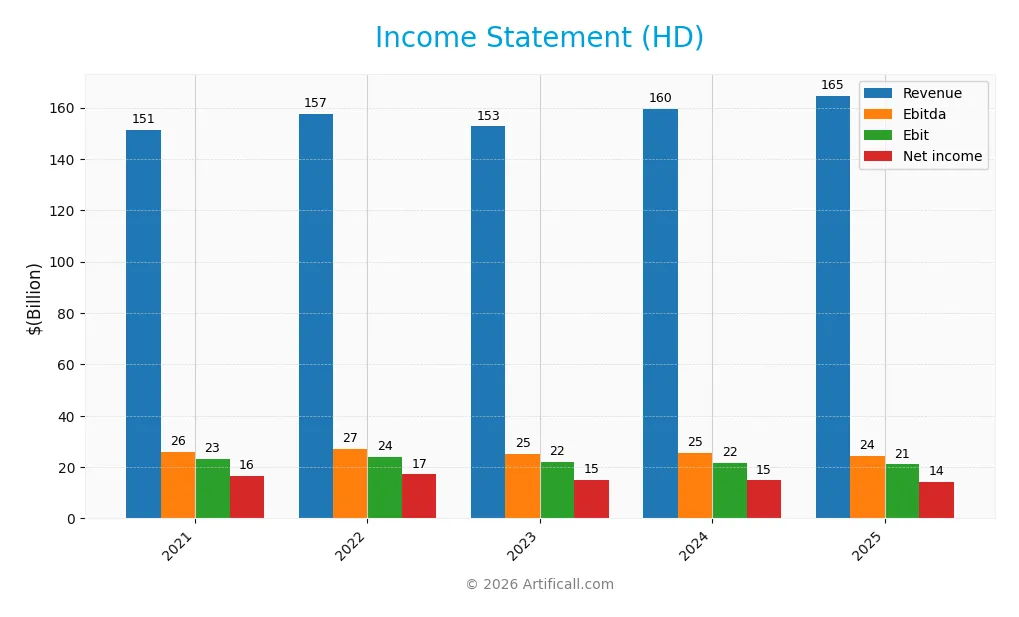
Below is The Home Depot, Inc.’s income statement summary for fiscal years 2021 through 2025, illustrating key profitability and expense metrics.
| 2021 | 2022 | 2023 | 2024 | 2025 | |
|---|---|---|---|---|---|
| Revenue | 151.2B | 157.4B | 152.7B | 159.5B | 164.7B |
| Cost of Revenue | 100.3B | 104.6B | 101.7B | 106.2B | 109.8B |
| Operating Expenses | 27.8B | 28.7B | 29.3B | 31.8B | 34.0B |
| Gross Profit | 50.8B | 52.8B | 51.0B | 53.3B | 54.9B |
| EBITDA | 25.9B | 27.1B | 25.1B | 25.4B | 24.3B |
| EBIT | 23.0B | 24.0B | 21.9B | 21.7B | 21.0B |
| Interest Expense | 1.35B | 1.62B | 1.94B | 2.32B | 2.41B |
| Net Income | 16.4B | 17.1B | 15.1B | 14.8B | 14.2B |
| EPS | 15.59 | 16.74 | 15.16 | 14.96 | 14.27 |
| Filing Date | 2022-03-23 | 2023-03-15 | 2024-03-13 | 2025-03-21 | 2026-03-18 |
Income Statement Evolution
From 2021 to 2025, revenue increased by 9% to $165B, reflecting steady top-line growth. However, net income declined nearly 14%, indicating margin pressure. Gross margin remained stable around 33%, but net margin compressed by 21%, driven by rising operating expenses outpacing revenue gains. The one-year snapshot shows slowing revenue growth and declining profitability.
Is the Income Statement Favorable?
The 2025 income statement reveals mixed fundamentals. Revenue grew 3.2% to $165B, but operating income dropped 3.3% to $21B, signaling operational challenges. Net margin fell to 8.6%, down 7.4% year-over-year, despite a favorable interest expense ratio of 1.46%. Overall, 50% of key income metrics are unfavorable, suggesting cautious interpretation of profitability trends.
Financial Ratios
The following table presents key financial ratios for The Home Depot, Inc. over the last five fiscal years, providing a concise overview of profitability, liquidity, leverage, and valuation metrics:
| Ratios | 2021 | 2022 | 2023 | 2024 | 2025 |
|---|---|---|---|---|---|
| Net Margin | 11% | 11% | 10% | 9% | 9% |
| ROE | -9.7x | 10.9x | 14.5x | 2.2x | 1.1x |
| ROIC | 37% | 33% | 29% | 22% | 19% |
| P/E | 23.5 | 19.4 | 23.3 | 27.5 | 26.5 |
| P/B | -228x | 212x | 338x | 61x | 29x |
| Current Ratio | 1.01 | 1.41 | 1.35 | 1.11 | 1.06 |
| Quick Ratio | 0.24 | 0.33 | 0.40 | 0.29 | 0.26 |
| D/E | -27.3x | 32.2x | 50.0x | 9.4x | 5.1x |
| Debt-to-Assets | 64% | 66% | 68% | 65% | 62% |
| Interest Coverage | 17.1x | 14.9x | 11.2x | 9.3x | 8.7x |
| Asset Turnover | 2.10 | 2.06 | 1.99 | 1.66 | 1.57 |
| Fixed Asset Turnover | 4.85 | 4.83 | 4.49 | 4.52 | 4.42 |
| Dividend Yield | 1.8% | 2.4% | 2.4% | 2.2% | 2.4% |
All ratios are rounded and expressed in standard financial formats for clarity.
Evolution of Financial Ratios
The Return on Equity (ROE) surged to an exceptional 110.48% in 2025, indicating a dramatic rise in profitability. The Current Ratio remained stable near 1.06, reflecting consistent short-term liquidity. However, the Debt-to-Equity Ratio worsened, reaching 5.1, signaling growing leverage and financial risk over the period.
Are the Financial Ratios Favorable?
Profitability metrics like ROE and Return on Invested Capital (19.03%) appear favorable, outpacing the 7.99% WACC, which implies value creation. Liquidity ratios show mixed signals; the Current Ratio is neutral, but the Quick Ratio is low at 0.26, a red flag for immediate solvency. Leverage ratios, including a high Debt-to-Equity of 5.1 and 62.18% Debt-to-Assets, are unfavorable. Market valuation metrics such as P/E (26.52) and P/B (29.3) ratios are also unfavorable. Overall, the financial ratios are slightly favorable but warrant caution due to elevated leverage and weak liquidity.
Shareholder Return Policy
The Home Depot maintains a steady dividend payout ratio around 55-65%, with dividend per share rising from 6.63 in 2021 to 9.22 in 2025. The annual dividend yield hovers near 2.4%, supported by free cash flow coverage exceeding dividend and capex payments.
The company also engages in share buybacks, reinforcing capital return to shareholders. This balanced approach of dividends and repurchases appears sustainable, aligning well with long-term shareholder value creation while maintaining healthy cash flow coverage.
Score analysis
This radar chart highlights The Home Depot’s key financial scores across valuation, profitability, and leverage metrics:
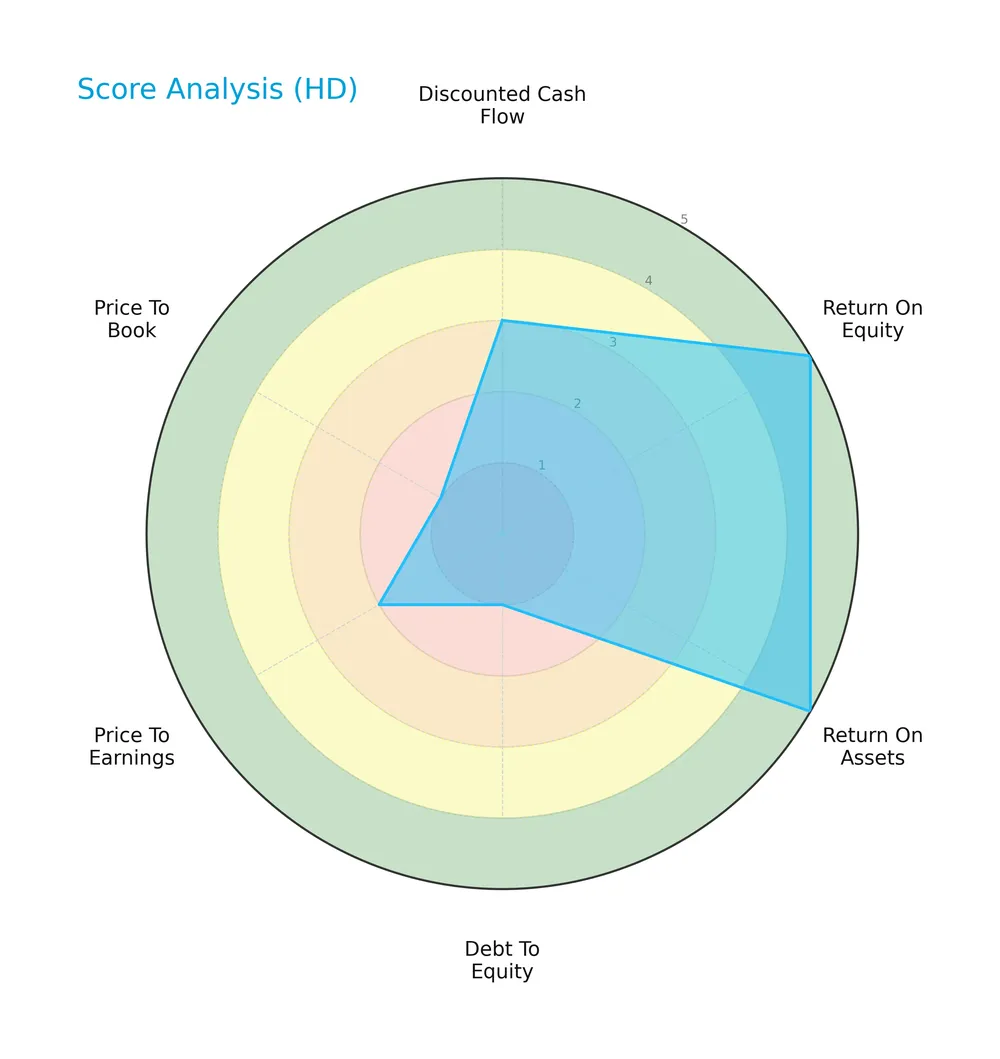
The company scores very favorably on return on equity and assets, reflecting strong profitability. However, debt-to-equity, price-to-earnings, and price-to-book scores are weak, indicating potential valuation and leverage concerns.
Analysis of the company’s bankruptcy risk
The Altman Z-Score places The Home Depot firmly in the safe zone, signaling a low risk of bankruptcy:

Is the company in good financial health?
The Piotroski Score diagram illustrates The Home Depot’s moderate financial strength based on nine fundamental criteria:

With a score of 5, the company demonstrates average financial health, balancing strengths and weaknesses without signaling robust or poor conditions.
Competitive Landscape & Sector Positioning
This sector analysis examines The Home Depot, Inc.’s strategic positioning, revenue segments, and key products. I will assess its main competitors and competitive advantages. The goal is to determine whether The Home Depot holds a sustainable edge over peers.
Strategic Positioning
The Home Depot maintains a concentrated geographic focus, generating $152B of $164B revenue in the US in 2025, with $12.5B from non-US markets. Product-wise, it diversifies across building materials, hardlines, and décor, each exceeding $48B, reflecting broad product segmentation within home improvement.
Revenue by Segment
The pie chart illustrates The Home Depot’s revenue distribution across product segments for fiscal year 2025, highlighting the diverse sources fueling the company’s sales.
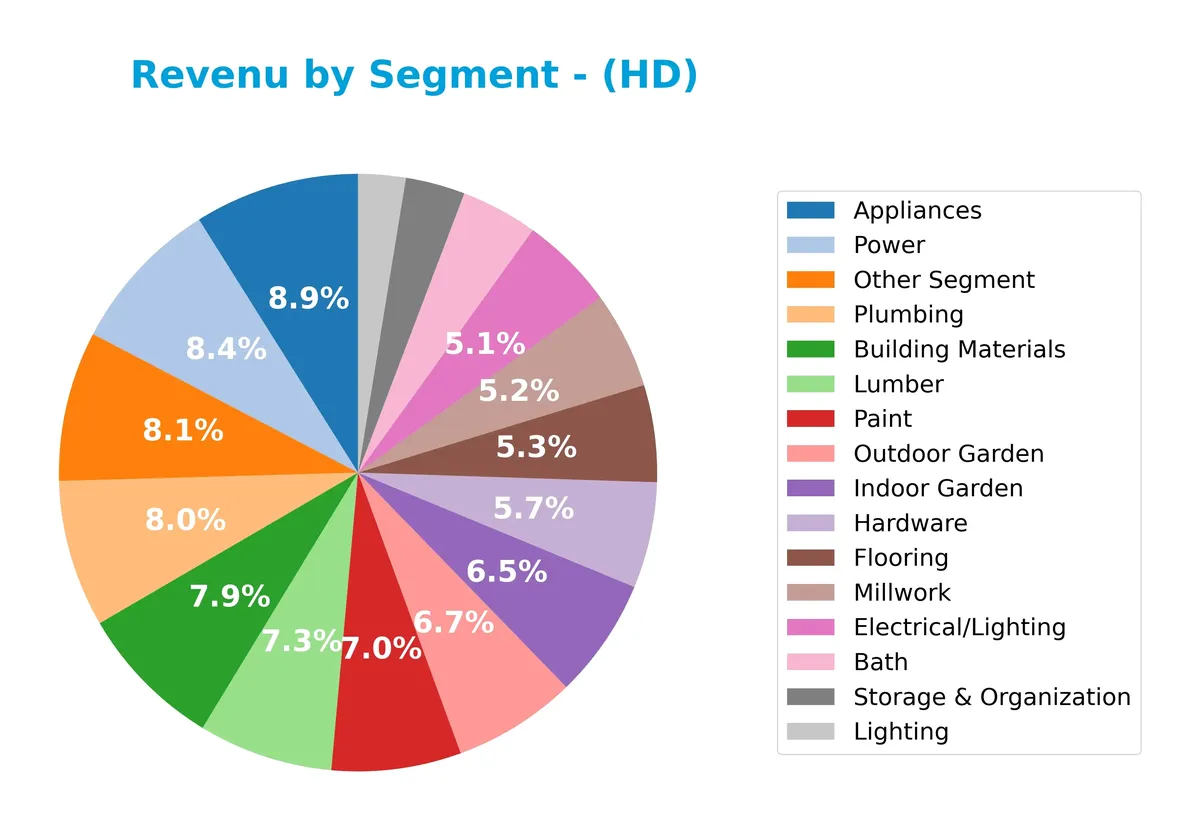
In 2025, Appliances lead with $13.99B, followed closely by Power at $13.17B and Plumbing at $12.48B, showing strong demand in essential home improvement categories. Building Materials and Lumber remain significant drivers at $12.38B and $11.39B respectively. The spread across segments like Outdoor Garden ($10.47B) and Indoor Garden ($10.18B) suggests balanced growth without overreliance on one area. This diversification reduces concentration risk and supports steady sales momentum.
Key Products & Brands
The Home Depot’s main products and brands cover a broad range of home improvement categories:
| Product | Description |
|---|---|
| Building Materials | Includes lumber, millwork, and structural supplies essential for construction and renovation. |
| Hardlines | Comprises hardware, tools, electrical, plumbing, and paint products for maintenance and repair. |
| Décor | Covers indoor and outdoor garden, lighting, appliances, and home décor items. |
| Bath | Products related to bathroom fixtures and accessories. |
| Power | Power tools and equipment rental services. |
| Storage & Organization | Solutions for organizing indoor and outdoor spaces. |
| Appliances | Household appliances including kitchen and laundry products. |
| Electrical/Lighting | Electrical supplies and lighting fixtures for residential and professional use. |
| Flooring | Materials for indoor flooring installation and renovations. |
| Hardware | Fasteners, locks, and other hardware essentials. |
| Indoor Garden | Products for indoor plant care and gardening. |
| Lighting | Various lighting options including bulbs and fixtures. |
| Lumber | Raw and processed wood products for building projects. |
| Millwork | Finished wood products like moldings and trims. |
| Outdoor Garden | Lawn care, gardening tools, and outdoor living products. |
| Paint | Interior and exterior paint products and related supplies. |
| Plumbing | Pipes, fittings, and plumbing fixtures. |
| Other Segment | Additional product lines not categorized above, covering diverse home improvement needs. |
The Home Depot operates a diversified portfolio, balancing building materials and hardlines with significant revenue from home décor and garden products. This mix addresses both professional contractors and DIY homeowners.
Main Competitors
There are 2 main competitors in the Home Improvement industry; the table lists the top 10 leaders by market capitalization:
| Competitor | Market Cap. |
|---|---|
| The Home Depot, Inc. | 344.2B |
| Lowe’s Companies, Inc. | 138.5B |
The Home Depot ranks 1st among its competitors with a market cap 93.08% the size of the top player. It stands above both the average market cap of the top 10 and the median market cap in the sector. The company leads by a significant margin, with a 131.32% larger market cap than its closest rival.
Comparisons with competitors
Check out how we compare the company to its competitors:
Does HD have a competitive advantage?
The Home Depot demonstrates a competitive advantage by generating an ROIC 11% above its WACC, indicating it creates value through efficient capital use. However, its declining ROIC trend signals weakening profitability that investors should monitor closely.
Looking ahead, Home Depot can leverage its broad product range and extensive U.S. footprint, serving homeowners and professionals alike. Expansion in installation services and online platforms offers opportunities to strengthen market presence and offset recent margin pressures.
SWOT Analysis
This analysis highlights The Home Depot’s core strategic factors to guide investment decisions.
Strengths
- strong brand recognition
- robust ROIC at 19% above WACC
- diversified product and service offerings
Weaknesses
- declining profitability trends
- high debt-to-equity ratio at 5.1
- weak quick ratio at 0.26 signaling liquidity risks
Opportunities
- expansion in non-US markets
- growth in professional contractor segment
- e-commerce platform enhancement
Threats
- rising interest rates impacting debt costs
- intense competition from online and physical retailers
- economic downturns reducing housing investments
The Home Depot commands a solid market position and value creation but faces pressure from profitability declines and elevated leverage. Prudent capital allocation and international growth can offset these risks.
Stock Price Action Analysis
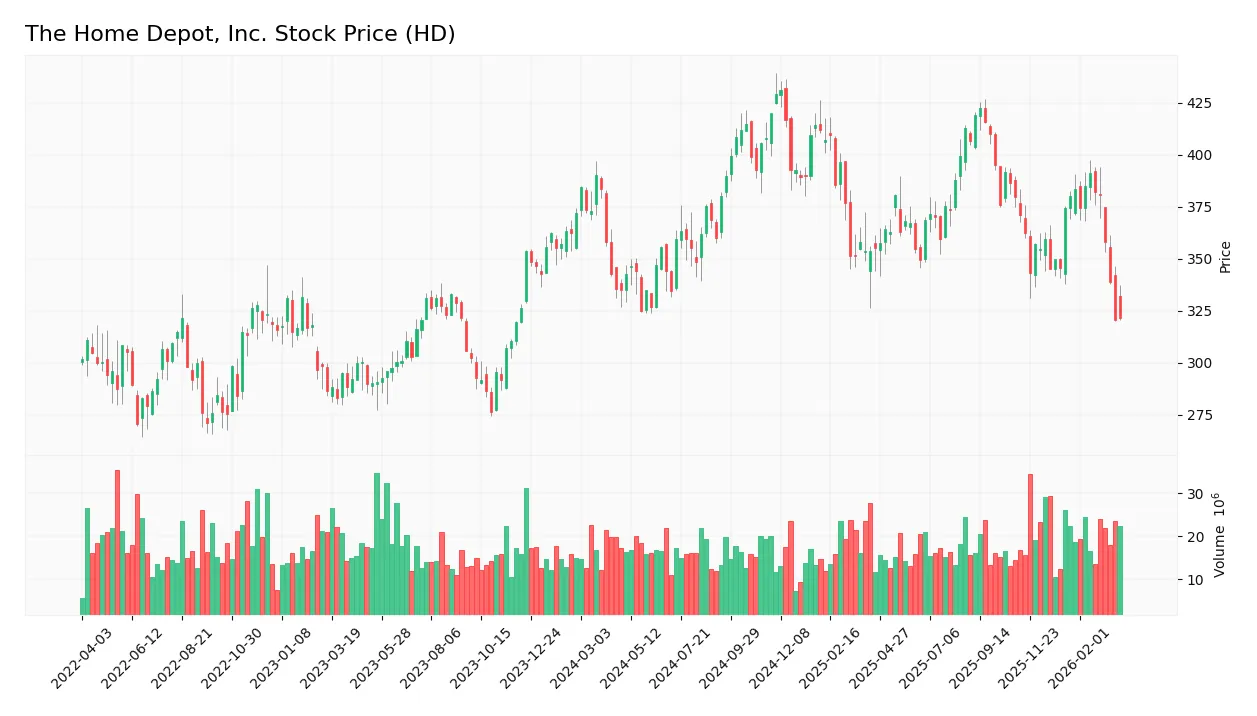
The weekly stock chart for The Home Depot, Inc. (HD) highlights recent price movements and volatility trends over the past 12 weeks:
Trend Analysis
Over the past 12 weeks, HD’s stock price declined by 6.18%, indicating a bearish trend. The stock showed deceleration in its downward movement. Price volatility remains high, with a standard deviation of 26.33. The highest recorded price was 431.37, while the lowest dropped to 320.75.
Volume Analysis
Trading volumes have increased, with a total volume exceeding 2B shares. Sellers dominate overall, accounting for 54.06%, but recent three-month data shows buyer volume slightly surpassing sellers at 52.12%. This shift suggests cautious investor interest with neutral buyer behavior and balanced market participation.
Target Prices
Analysts set a consensus target price that reflects cautious optimism for The Home Depot, Inc. (HD).
| Target Low | Target High | Consensus |
|---|---|---|
| 320 | 454 | 408.08 |
The target range from 320 to 454 indicates moderate upside potential. The consensus of 408 suggests analysts expect steady growth ahead, aligned with sector trends.

Don’t Let Luck Decide Your Entry Point
Optimize your entry points with our advanced ProRealTime indicators. You’ll get efficient buy signals with precise price targets for maximum performance. Start outperforming now!
Analyst & Consumer Opinions
This section reviews recent analyst grades and consumer feedback reflecting The Home Depot, Inc.’s market perception and customer satisfaction.
Stock Grades
Here are the latest verified grades from reputable financial institutions on The Home Depot, Inc.:
| Grading Company | Action | New Grade | Date |
|---|---|---|---|
| Telsey Advisory Group | Maintain | Outperform | 2026-03-25 |
| BNP Paribas | Maintain | Neutral | 2026-03-24 |
| UBS | Maintain | Buy | 2026-02-25 |
| Guggenheim | Maintain | Buy | 2026-02-25 |
| Wells Fargo | Maintain | Overweight | 2026-02-25 |
| Morgan Stanley | Maintain | Overweight | 2026-02-25 |
| Telsey Advisory Group | Maintain | Outperform | 2026-02-25 |
| Bernstein | Maintain | Market Perform | 2026-02-25 |
| RBC Capital | Maintain | Sector Perform | 2026-02-25 |
| Jefferies | Maintain | Buy | 2026-02-24 |
The overall trend shows consistent confidence with multiple “Buy,” “Outperform,” and “Overweight” ratings. A few firms remain neutral or hold, indicating cautious optimism but no downgrades.
Consumer Opinions
Consumer sentiment around The Home Depot, Inc. reflects a blend of strong satisfaction and notable concerns.
| Positive Reviews | Negative Reviews |
|---|---|
| Excellent product variety and availability. | Customer service wait times can be long. |
| Competitive pricing on home improvement tools. | Inconsistent stock levels in certain stores. |
| Helpful and knowledgeable staff. | Online order fulfillment sometimes delayed. |
Overall, customers praise The Home Depot for product selection and staff expertise. However, recurring issues with service speed and inventory management temper enthusiasm.
Risk Analysis
Below is a summary of The Home Depot’s key risks, categorized by likelihood and potential impact:
| Category | Description | Probability | Impact |
|---|---|---|---|
| Leverage Risk | Debt-to-Assets ratio at 62.18% signals high financial leverage | High | High |
| Liquidity Risk | Quick ratio at 0.26 indicates limited short-term liquidity | Medium | Medium |
| Valuation Risk | Elevated P/E of 26.52 and P/B of 29.3 suggest overvaluation | High | Medium |
| Market Volatility | Beta of 1.044 implies stock moves roughly in line with market | Medium | Medium |
| Operational Risk | Exposure to cyclical home improvement demand fluctuations | Medium | High |
Leverage and valuation risks stand out. The company’s high debt load contrasts with a safe Altman Z-score of 5.59, showing financial stability but limited margin for error. Elevated valuation multiples may pressure returns if growth slows. I caution investors to watch debt trends and market softness in housing.
Should You Buy The Home Depot, Inc.?
The Home Depot appears to be generating solid value creation with a slightly favorable moat despite declining profitability. Its leverage profile could be seen as substantial, reflecting some financial strain. Overall, the company suggests a profile of moderate risk with a very favorable B rating.
Strength & Efficiency Pillars
The Home Depot, Inc. demonstrates solid operational efficiency with a net margin of 8.6% and a robust return on equity of 110.48%. Its return on invested capital (ROIC) stands at 19.03%, comfortably exceeding the weighted average cost of capital (WACC) of 7.99%, confirming that the company is a clear value creator. Interest coverage at 8.71x and asset turnover of 1.57x further reflect strong operational control and capital utilization. These metrics underline Home Depot’s capability to generate returns above its capital costs, a hallmark of durable competitive advantage.
Weaknesses and Drawbacks
Despite operational strengths, valuation metrics raise caution. The price-to-earnings ratio at 26.52 signals a premium valuation relative to historical averages, while the price-to-book ratio of 29.3 is significantly stretched, suggesting limited margin of safety. Leverage is a concern with a debt-to-equity ratio of 5.1, indicating heavy reliance on debt financing, and a quick ratio of 0.26 exposes liquidity constraints. These factors heighten financial risk, especially if market conditions deteriorate. The overall bearish stock trend with a 6.18% price decline and seller dominance in total volume add short-term pressure.
Our Final Verdict about The Home Depot, Inc.
The Home Depot’s profile may appear attractive for long-term exposure given its strong return metrics and value creation. However, stretched valuation multiples combined with elevated leverage suggest caution. Despite operational resilience, the ongoing bearish trend and decelerating price momentum could signal a wait-and-see approach for a better entry point. Investors should weigh these risks carefully against the company’s proven ability to generate above-cost returns in the home improvement sector.
Disclaimer: This content is for informational purposes only and does not constitute financial, investment, or other professional advice. Investing in financial markets involves a significant risk of loss, and past performance is not indicative of future results.
Additional Resources
- The Home Depot, Inc. (HD) launches real-time delivery tracker for pro customers – MSN (Mar 27, 2026)
- The Home Depot, Inc. $HD Stock Holdings Lifted by Castleview Partners LLC – MarketBeat (Mar 28, 2026)
- The Home Depot Subsidiary SRS Distribution Enters into Agreement to Acquire Wholesale HVAC Distributor Mingledorff’s – The Home Depot (Mar 24, 2026)
- LVM Capital Trims Stake in Home Depot – National Today (Mar 28, 2026)
- [Form 4] HOME DEPOT, INC. Insider Trading Activity – Stock Titan (Mar 26, 2026)
For more information about The Home Depot, Inc., please visit the official website: homedepot.com