Home > Analyses > Consumer Defensive > The Hershey Company
The Hershey Company sweetens moments worldwide with iconic brands like Reese’s and Hershey’s Kisses. It shapes the confectionery landscape through innovation and a diverse product portfolio spanning chocolates, mints, snacks, and pantry essentials. Renowned for quality and market influence, Hershey commands a strong presence in North America and beyond. As consumer preferences evolve, I ask: does Hershey’s solid foundation still support its premium valuation and future growth prospects?

Table of contents
Business Model & Company Overview
The Hershey Company, founded in 1894 and headquartered in Hershey, Pennsylvania, stands as a dominant force in the Food Confectioners industry. Its core mission unites a diverse portfolio spanning chocolate, non-chocolate confectionery, pantry staples, and savory snacks. This ecosystem includes iconic brands like Hershey’s, Reese’s, Kit Kat, and SkinnyPop, creating a seamless consumer experience that blends indulgence with convenience across multiple product categories.
Hershey’s revenue engine balances a mix of confectionery products and pantry items sold globally across North America, Europe, and Asia. It leverages recurring demand from grocery chains, mass merchandisers, and convenience stores, supported by strategic international expansion through its three operating segments. The company’s enduring economic moat lies in its brand equity and expansive distribution network, shaping the confectionery landscape well into the future.
Financial Performance & Fundamental Metrics
I will analyze The Hershey Company’s income statement, key financial ratios, and dividend payout policy to reveal its underlying financial health and shareholder returns.
Income Statement
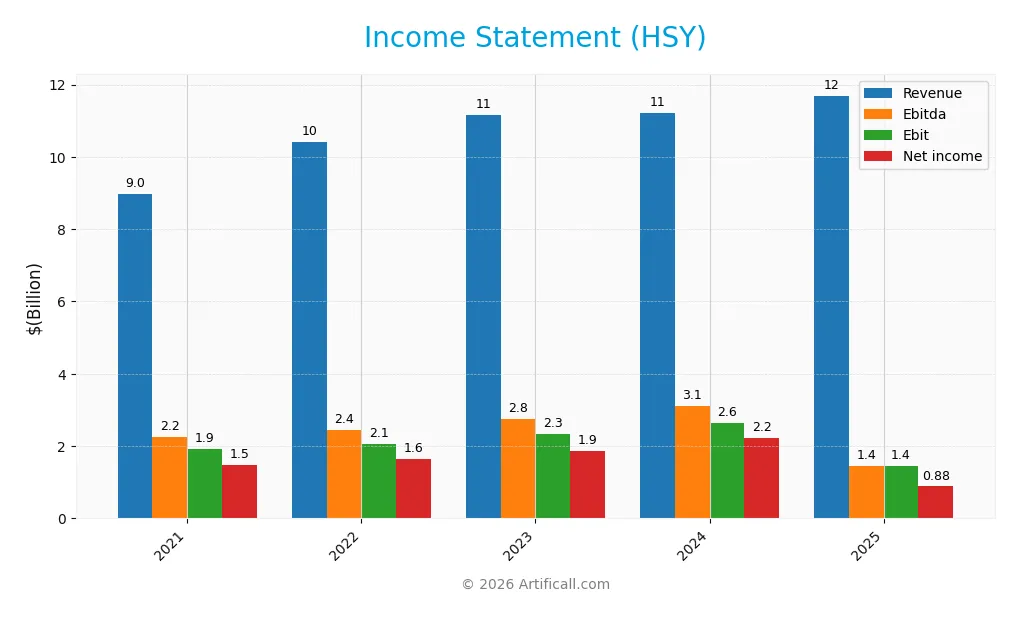
The table below summarizes The Hershey Company’s key income statement figures for fiscal years 2021 through 2025, highlighting revenue, expenses, profitability, and earnings per share.
| 2021 | 2022 | 2023 | 2024 | 2025 | |
|---|---|---|---|---|---|
| Revenue | 8.97B | 10.42B | 11.16B | 11.20B | 11.69B |
| Cost of Revenue | 4.92B | 5.92B | 6.17B | 5.90B | 7.80B |
| Operating Expenses | 2.00B | 2.24B | 2.44B | 2.40B | 2.47B |
| Gross Profit | 4.05B | 4.50B | 5.00B | 5.30B | 3.89B |
| EBITDA | 2.24B | 2.44B | 2.75B | 3.10B | 1.45B |
| EBIT | 1.93B | 2.06B | 2.33B | 2.65B | 1.45B |
| Interest Expense | 130M | 140M | 162M | 174M | 207M |
| Net Income | 1.48B | 1.64B | 1.86B | 2.22B | 883M |
| EPS | 7.15 | 8.00 | 9.09 | 10.97 | 4.40 |
| Filing Date | 2022-02-18 | 2023-02-17 | 2024-02-20 | 2025-02-18 | 2026-02-17 |
Income Statement Evolution
From 2021 to 2025, Hershey’s revenue grew 30.3%, showing steady top-line expansion. However, net income declined 40.2%, indicating margin pressure. Gross margin remained favorable at 33.3%, but net margin contracted by 54.1%, reflecting rising costs and weaker profitability despite stable operating expenses relative to revenue growth.
Is the Income Statement Favorable?
In 2025, Hershey’s fundamentals appear mixed. Revenue rose 4.4%, yet gross profit fell 26.6%, causing a 45.3% drop in EBIT and a 61.9% decline in net margin. Interest expense remains low at 1.8% of revenue, supporting earnings stability. Overall, the income statement shows unfavorable trends, with profitability under strain despite solid revenue growth.
Financial Ratios
The following table presents key financial ratios for The Hershey Company (HSY) over the last five fiscal years, providing insight into profitability, liquidity, leverage, and market valuation:
| Ratios | 2021 | 2022 | 2023 | 2024 | 2025 |
|---|---|---|---|---|---|
| Net Margin | 16.5% | 15.8% | 16.7% | 19.8% | 7.6% |
| ROE | 53.6% | 49.8% | 45.4% | 47.1% | 19.0% |
| ROIC | 18.9% | 21.2% | 22.1% | 23.7% | 9.0% |
| P/E | 27.1 | 28.9 | 20.5 | 15.5 | 41.9 |
| P/B | 14.5 | 14.4 | 9.3 | 7.3 | 8.0 |
| Current Ratio | 0.90 | 0.80 | 0.97 | 0.96 | 1.19 |
| Quick Ratio | 0.50 | 0.44 | 0.52 | 0.64 | 0.72 |
| D/E | 1.95 | 1.55 | 1.25 | 1.16 | 1.17 |
| Debt-to-Assets | 52% | 47% | 43% | 42% | 39% |
| Interest Coverage | 15.7 | 16.1 | 15.9 | 16.6 | 6.8 |
| Asset Turnover | 0.86 | 0.95 | 0.94 | 0.87 | 0.85 |
| Fixed Asset Turnover | 3.47 | 3.76 | 3.09 | 2.95 | 3.31 |
| Dividend Yield | 1.7% | 1.6% | 2.3% | 3.2% | 2.9% |
Evolution of Financial Ratios
From 2021 to 2025, Hershey’s Return on Equity (ROE) declined from 53.59% to 19.05%, indicating reduced profitability. The Current Ratio improved from below 1 in earlier years to 1.19 in 2025, signaling better liquidity. The Debt-to-Equity Ratio decreased from 1.95 to 1.17, reflecting modest deleveraging and improved balance sheet stability.
Are the Financial Ratios Fovorable?
In 2025, profitability shows mixed signals: ROE is favorable at 19.05%, but net margin stands neutral at 7.55%. Liquidity ratios are mixed, with a neutral current ratio of 1.19 but an unfavorable quick ratio of 0.72. Leverage is somewhat high with a debt-to-equity ratio of 1.17, marked as unfavorable. Market valuation ratios like P/E and P/B are unfavorable, while coverage and turnover ratios generally appear favorable or neutral, leading to a slightly favorable overall assessment.
Shareholder Return Policy
The Hershey Company maintains a dividend payout ratio above 100% in 2025, with a dividend per share rising steadily to $5.33 and a 2.93% yield. The policy relies on free cash flow coverage but risks unsustainable distribution given the payout ratio exceeding net income.
Share buybacks are not explicitly reported, which may limit capital return flexibility. Historically, Hershey balances dividends with reinvestment, supporting a cautious approach to long-term shareholder value amid margin pressures and leverage levels.
Score analysis
The following radar chart summarizes key financial scores that evaluate the company’s valuation and profitability metrics:
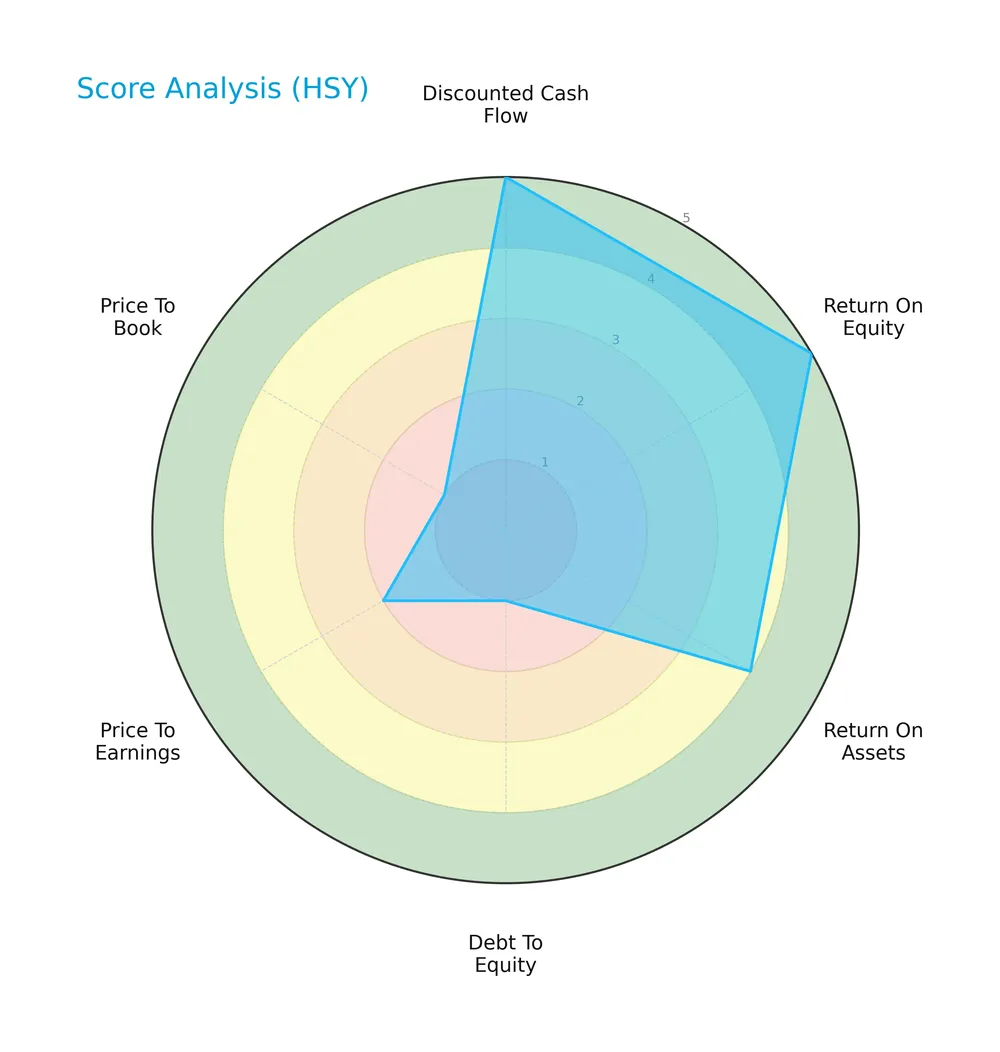
The Hershey Company scores very favorably on discounted cash flow and return on equity, reflecting strong value creation. Return on assets is also favorable. However, debt-to-equity, price-to-earnings, and price-to-book scores are very unfavorable, signaling valuation and leverage concerns.
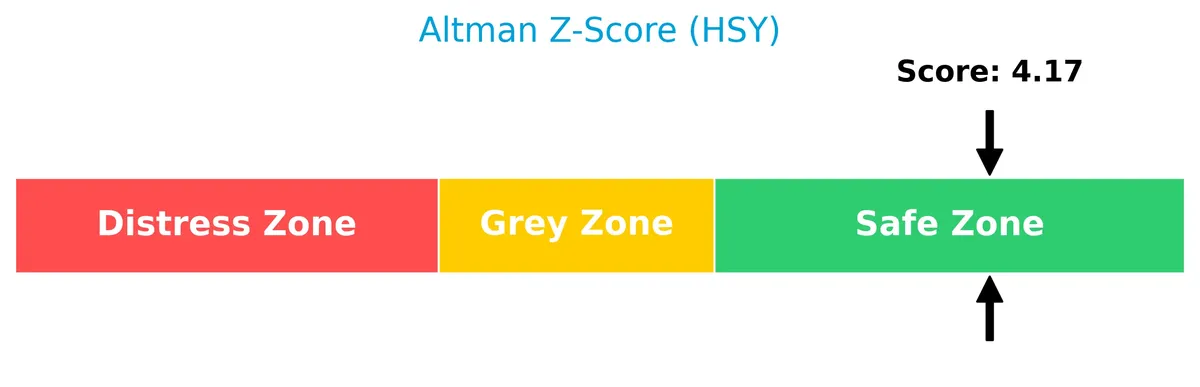
Analysis of the company’s bankruptcy risk
The Altman Z-Score places the company comfortably in the safe zone, indicating a low risk of bankruptcy based on its financial health:
Is the company in good financial health?
The Piotroski diagram presents the company’s financial strength using nine fundamental criteria:

With a Piotroski Score of 5, the company demonstrates average financial health. This suggests moderate strength but room for improvement in profitability, leverage, or efficiency metrics.
Competitive Landscape & Sector Positioning
This sector analysis examines The Hershey Company’s strategic positioning, revenue segments, key products, and main competitors. I will assess whether Hershey holds a competitive advantage over its peers in the food confectioners industry.
Strategic Positioning
The Hershey Company concentrates primarily on North America, generating over $10B in confectionery and salty snacks revenue in 2025. It also maintains a significant international presence with $1.44B revenue, balancing a focused product portfolio across confectionery, snacks, and pantry items.
Revenue by Segment
This pie chart displays The Hershey Company’s revenue breakdown by product segment for fiscal year 2025, highlighting the relative contributions of confectionery and salty snacks.
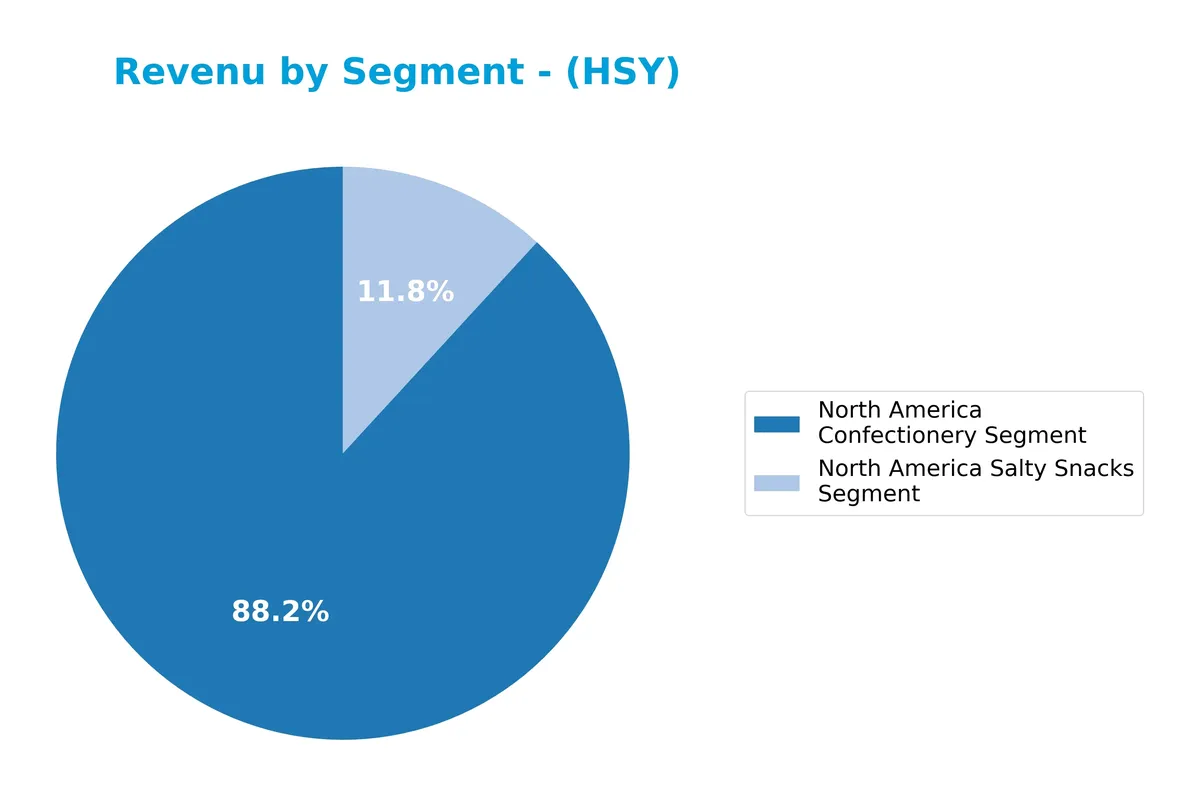
In 2025, North America Confectionery dominates with $9.48B, reflecting steady growth from $7.45B in 2018. The Salty Snacks segment surged to $1.27B, more than tripling since 2018. This shift signals Hershey’s strategic diversification beyond core confectionery, reducing concentration risk and accelerating overall revenue growth in recent years.
Key Products & Brands
The Hershey Company’s product portfolio spans confectionery and snack categories, highlighted below:
| Product | Description |
|---|---|
| Hershey’s | Iconic chocolate brand offering a variety of bars and seasonal confectionery products. |
| Reese’s | Peanut butter and chocolate combination products, a leading contributor to confectionery sales. |
| Kisses | Bite-sized chocolate pieces known for their distinctive shape and foil wrapping. |
| Jolly Rancher | Fruit-flavored hard candies and chews. |
| Almond Joy | Chocolate bars featuring coconut and almonds. |
| Brookside | Premium dark chocolate-covered fruit and nut products. |
| barkTHINS | Snacking chocolate with nut and seed inclusions, marketed as a healthier indulgence. |
| Cadbury | Internationally recognized chocolate and confectionery brand. |
| Good & Plenty | Licorice-based candy. |
| Heath | Toffee bar confectionery. |
| Kit Kat | Crisp wafer bars covered in chocolate. |
| Payday | Peanut and caramel candy bars. |
| Rolo | Chocolate-covered caramel candies. |
| Twizzlers | Licorice candy twists. |
| Whoppers | Malted milk balls covered in chocolate. |
| York | Peppermint patties coated in chocolate. |
| Ice Breakers | Mints and chewing gum products. |
| Breath Savers | Mint-flavored breath fresheners. |
| Bubble Yum | Bubble gum brand with various flavors. |
| Lily’s | Stevia-sweetened chocolate products. |
| SkinnyPop | Popcorn snack brand focused on simple ingredients. |
| Pirates Booty | Puff corn snacks. |
| Paqui | Spicy flavored tortilla chips. |
| Dot’s Homestyle Pretzels | Gourmet pretzel snacks. |
| ONE Bar | Protein bars aimed at health-conscious consumers. |
| Pelon Pelo Rico | Tamarind-flavored Mexican candy. |
| IO-IO | Candy brand (specific product details not provided). |
| Sofit | Candy brand (specific product details not provided). |
Hershey’s portfolio balances traditional chocolate brands with expanding snack and health-conscious categories. The company leverages strong brand equity across North America and international markets, supporting steady revenue growth in confectionery and salty snacks.
Main Competitors
There are 2 competitors in the Food Confectioners industry; below is a table listing the top 10 leaders by market capitalization:
| Competitor | Market Cap. |
|---|---|
| Mondelez International, Inc. | 69.3B |
| The Hershey Company | 37.0B |
The Hershey Company ranks 2nd among its competitors with a market cap 64% that of the leader, Mondelez International. It sits below both the average market cap of the top 10 and the sector median, reflecting a smaller scale. Hershey maintains a significant 56% gap to Mondelez, its closest competitor above.
Comparisons with competitors
Check out how we compare the company to its competitors:
Does HSY have a competitive advantage?
The Hershey Company presents a competitive advantage, evidenced by a ROIC exceeding WACC by 4.57%, indicating value creation despite a declining profitability trend. Its strong brand portfolio and market presence support this position.
Looking ahead, Hershey’s expansion into international markets and diversification into salty snacks and pantry items offer growth opportunities. New product introductions and geographic diversification could enhance revenue streams in coming years.
SWOT Analysis
This SWOT analysis highlights The Hershey Company’s core strengths, weaknesses, opportunities, and threats to inform strategic decisions.
Strengths
- strong brand portfolio
- stable North America revenue base
- favorable ROE of 19.05%
Weaknesses
- declining net margin and EPS growth
- high PE and PB ratios
- unfavorable debt-to-equity ratio
Opportunities
- expanding international market
- product innovation in snacks
- growing demand for healthier options
Threats
- rising input costs
- intense industry competition
- changing consumer preferences
Hershey’s solid brand and profitability create value, but declining margins and high leverage pose risks. Strategic focus on international growth and innovation is essential to counter mounting competitive and cost pressures.
Stock Price Action Analysis
The weekly stock chart below illustrates The Hershey Company’s price movements and key levels over the past 12 months:
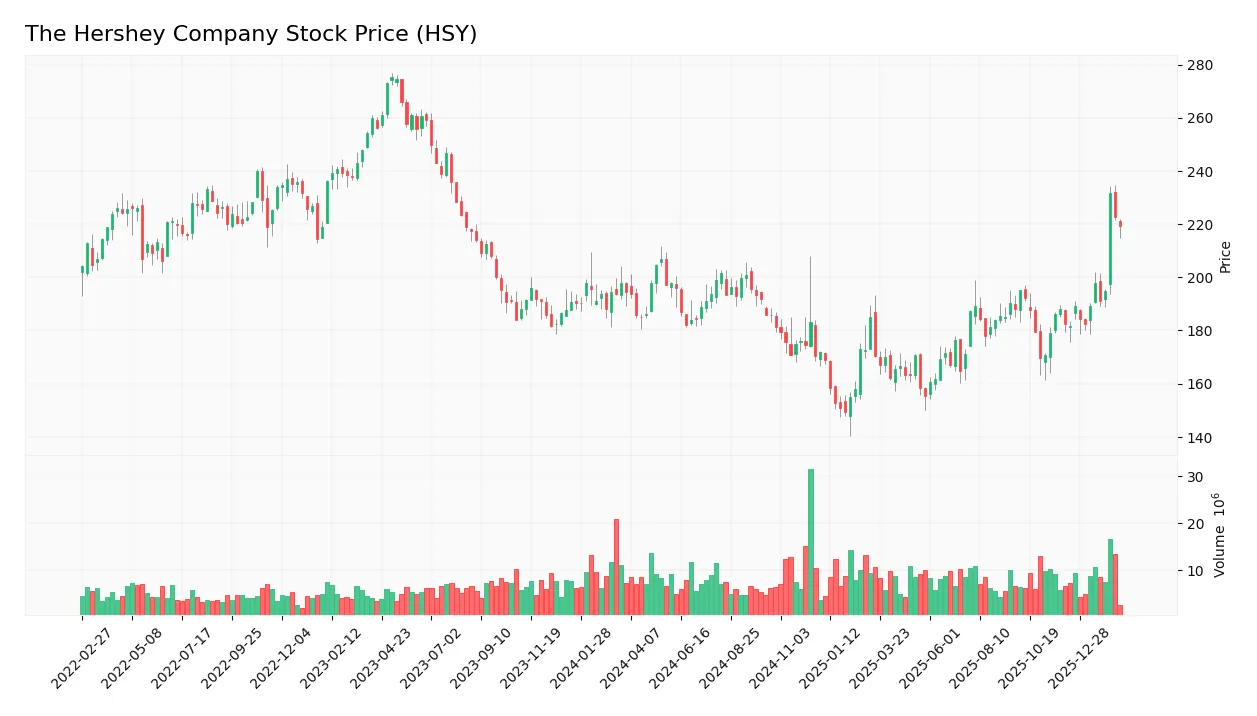
Trend Analysis
Over the past 12 months, HSY’s stock price rose 12.8%, indicating a bullish trend with accelerating momentum. The price ranged from a low of 149.25 to a high of 231.53, reflecting notable volatility with a standard deviation of 15.14. The recent two and a half months saw an even stronger 20.35% gain, confirming trend acceleration.
Volume Analysis
Trading volumes over the last three months show a slight buyer dominance at 52.43%, with buyer volume increasing relative to sellers. The total volume trend is rising, suggesting growing market participation and cautiously positive investor sentiment toward HSY’s stock. Buyer behavior remains neutral, indicating balanced trading dynamics.
Target Prices
Analysts set a clear target consensus for The Hershey Company, reflecting moderate upside potential.
| Target Low | Target High | Consensus |
|---|---|---|
| 181 | 267 | 229.08 |
The target range spans from 181 to 267, with a consensus near 229, indicating a balanced but optimistic outlook among analysts.

Don’t Let Luck Decide Your Entry Point
Optimize your entry points with our advanced ProRealTime indicators. You’ll get efficient buy signals with precise price targets for maximum performance. Start outperforming now!
Analyst & Consumer Opinions
This section examines The Hershey Company’s analyst ratings alongside consumer feedback to provide a comprehensive evaluation.
Stock Grades
Here is the latest verified grading summary for The Hershey Company from recognized financial firms:
| Grading Company | Action | New Grade | Date |
|---|---|---|---|
| Barclays | Maintain | Equal Weight | 2026-02-09 |
| Stifel | Maintain | Hold | 2026-02-06 |
| DA Davidson | Maintain | Neutral | 2026-02-06 |
| Wells Fargo | Maintain | Equal Weight | 2026-02-06 |
| RBC Capital | Maintain | Sector Perform | 2026-02-03 |
| DA Davidson | Maintain | Neutral | 2026-02-02 |
| Jefferies | Maintain | Neutral | 2026-02-02 |
| UBS | Maintain | Neutral | 2026-01-14 |
| Piper Sandler | Upgrade | Overweight | 2026-01-07 |
| Wells Fargo | Upgrade | Equal Weight | 2026-01-05 |
The overall trend reflects a stable outlook with most firms maintaining neutral or hold ratings. A few upgrades signal selective optimism, but consensus remains cautious.
Consumer Opinions
Consumer sentiment around The Hershey Company reflects a mix of appreciation and critique, revealing key areas of strength and room for improvement.
| Positive Reviews | Negative Reviews |
|---|---|
| “Delicious chocolate with consistent quality.” | “Some products feel overpriced for their size.” |
| “Wide variety of classic and seasonal treats.” | “Occasional issues with product packaging.” |
| “Reliable availability in most stores.” | “Limited options for sugar-free or healthier snacks.” |
Overall, Hershey’s enjoys strong loyalty for its taste and variety. However, consumers frequently cite pricing and packaging as areas needing attention to sustain growth.
Risk Analysis
Below is a summary of key risks affecting The Hershey Company’s financial and operational outlook:
| Category | Description | Probability | Impact |
|---|---|---|---|
| Valuation Risk | Elevated P/E (41.93) and P/B (7.99) suggest overvaluation | High | High |
| Leverage Risk | Debt-to-equity ratio at 1.17 indicates heavy leverage | Moderate | Medium |
| Liquidity Risk | Quick ratio of 0.72 signals limited short-term liquidity | Moderate | Medium |
| Market Risk | Low beta (0.169) reduces sensitivity but limits upside | Low | Low |
| Operational Risk | Global supply chain disruptions could affect product availability | Moderate | High |
The most pressing concerns lie in valuation and leverage. Hershey’s rich multiples raise caution against a market correction. Its debt load, though manageable, restricts financial flexibility. Supply chain issues remain a wildcard amid global uncertainty.
Should You Buy The Hershey Company?
Analytically, The Hershey Company appears to be creating value with a slightly favorable moat despite declining ROIC. Profitability remains robust, but its leverage profile is substantial. Overall, the financial health suggests a moderate B+ rating with notable risks in valuation metrics.
Strength & Efficiency Pillars
The Hershey Company demonstrates solid operational efficiency with a net margin of 7.55% and a return on equity of 19.05%. Its return on invested capital (ROIC) stands at 9.0%, comfortably above the weighted average cost of capital (WACC) of 4.43%, confirming the company as a value creator. Favorable interest coverage (6.99x) and fixed asset turnover (3.31x) further underline effective capital allocation and operational strength. While ROIC shows a declining trend, Hershey still maintains a slightly favorable moat status.
Weaknesses and Drawbacks
Despite operational strengths, Hershey faces valuation and leverage concerns. The price-to-earnings ratio is elevated at 41.93, implying a premium valuation that raises risk if growth falters. The price-to-book ratio at 7.99 also signals an expensive market position. Financial leverage remains high, with a debt-to-equity ratio of 1.17, which could pressure cash flows in a rising interest rate environment. The quick ratio of 0.72 points to liquidity constraints, posing risks in short-term obligations.
Our Final Verdict about The Hershey Company
Hershey’s long-term fundamentals appear sound, supported by its ability to create value and a bullish overall stock trend. However, premium valuation metrics and modest liquidity caution investors. Given the neutral recent buyer dominance and favorable technical acceleration, the profile may appear attractive for long-term exposure but suggests a prudent wait-and-see approach for a better entry point.
Disclaimer: This content is for informational purposes only and does not constitute financial, investment, or other professional advice. Investing in financial markets involves a significant risk of loss, and past performance is not indicative of future results.
Additional Resources
- Heartland Advisors Inc. Trims Stake in Hershey Company (The) $HSY – MarketBeat (Feb 17, 2026)
- Hershey Beats Q4 Earnings With $3 Billion in Revenue: What a $278 Target Means for Investors – TIKR.com (Feb 17, 2026)
- Kirk Tanner Appointed President and Chief Executive Officer of The Hershey Company, effective August 18, 2025 – The Hershey Company (Jul 08, 2025)
- The Hershey Company (HSY): A Bull Case Theory – Yahoo Finance (Dec 09, 2025)
- The Hershey Company (NYSE:HSY) Q4 2025 earnings call transcript – MSN (Feb 05, 2026)
For more information about The Hershey Company, please visit the official website: thehersheycompany.com