Home > Analyses > Financial Services > The Hartford Financial Services Group, Inc.
The Hartford Financial Services Group, Inc. shapes risk management for millions, protecting businesses and individuals alike. It dominates diversified insurance with flagship offerings in commercial lines, personal coverage, and group benefits. Known for innovation and reliability, Hartford blends traditional strength with modern financial solutions. As market conditions evolve, I ask: do Hartford’s robust fundamentals still justify its premium valuation and growth prospects in 2026?

Table of contents
Business Model & Company Overview
The Hartford Financial Services Group, Inc., founded in 1810 and headquartered in Hartford, Connecticut, stands as a dominant diversified insurance provider. It unites commercial, personal, and group benefits insurance into a cohesive risk management ecosystem. Serving individuals and businesses, the company leverages a blend of direct channels and independent agents to maintain its stronghold in the U.S. and international markets.
The company’s revenue engine balances traditional insurance products with investment management services, creating steady cash flow across segments. Its Commercial Lines and Group Benefits segments drive recurring premiums, while Hartford Funds expands its footprint in retirement and retail investments. Operating across the Americas, Europe, and Asia, The Hartford’s well-established distribution network and product breadth form a formidable economic moat in financial services.
Financial Performance & Fundamental Metrics
I will analyze The Hartford Financial Services Group, Inc.’s income statement, key financial ratios, and dividend payout policy to assess its financial health and shareholder value.
Income Statement
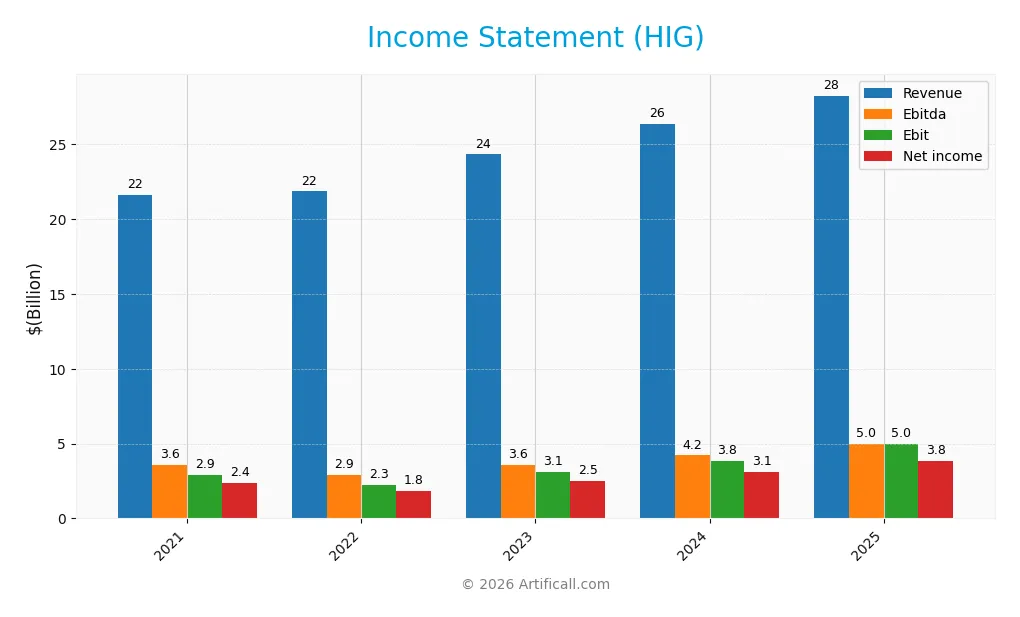
The table below presents The Hartford Financial Services Group, Inc.’s key income statement figures for fiscal years 2021 through 2025, reported in USD.
| 2021 | 2022 | 2023 | 2024 | 2025 | |
|---|---|---|---|---|---|
| Revenue | 21.6B | 21.9B | 24.3B | 26.4B | 28.3B |
| Cost of Revenue | 19.2B | 19.8B | 21.6B | 22.4B | 15.2B |
| Operating Expenses | -435M | -211M | 79M | 121M | 8.3B |
| Gross Profit | 2.5B | 2.1B | 3.2B | 4.0B | 13.0B |
| EBITDA | 3.6B | 2.9B | 3.6B | 4.2B | 5.0B |
| EBIT | 2.9B | 2.3B | 3.1B | 3.8B | 5.0B |
| Interest Expense | 234M | 213M | 199M | 199M | 199M |
| Net Income | 2.4B | 1.8B | 2.5B | 3.1B | 3.8B |
| EPS | 6.71 | 5.52 | 8.09 | 10.51 | 13.51 |
| Filing Date | 2022-02-18 | 2023-02-24 | 2024-02-23 | 2025-02-21 | 2026-02-20 |
Income Statement Evolution
From 2021 to 2025, The Hartford’s revenue grew 30.5%, with net income increasing 61.8%. Gross profit surged sharply in 2025 after a low base in 2024, boosting margins. Net margin expanded by nearly 24% overall, reflecting improved profitability. Operating expenses rose modestly but did not offset margin gains, indicating efficient cost management.
Is the Income Statement Favorable?
In 2025, revenue reached $28.3B with a gross margin of 46.1%, signaling strong core operations. EBIT margin stood at 17.6%, and net margin at 13.6%, both marked favorable by industry standards. Despite a slight rise in operating expenses relative to revenue, earnings per share grew 28.7%, underlining robust bottom-line performance. Overall, fundamentals appear favorable with sustained growth and margin improvement.
Financial Ratios
The table below presents key financial ratios for The Hartford Financial Services Group, Inc. (HIG) spanning fiscal years 2021 to 2025:
| Ratios | 2021 | 2022 | 2023 | 2024 | 2025 |
|---|---|---|---|---|---|
| Net Margin | 11.0% | 8.3% | 10.3% | 11.8% | 13.6% |
| ROE | 13.3% | 13.3% | 16.3% | 18.9% | 20.2% |
| ROIC | 3.1% | 1.8% | 7.2% | 23.8% | 28.2% |
| P/E | 10.2 | 13.5 | 9.9 | 10.3 | 10.1 |
| P/B | 1.35 | 1.81 | 1.61 | 1.95 | 2.05 |
| Current Ratio | 0.0 | 24.8 | 0.33 | 16.7 | 17.7 |
| Quick Ratio | 0.0 | 24.8 | 0.33 | 16.7 | 17.7 |
| D/E | 0.28 | 0.32 | 0.28 | 0.27 | 0.23 |
| Debt-to-Assets | 6.5% | 6.0% | 6.2% | 5.4% | 5.1% |
| Interest Coverage | 12.4 | 10.6 | 15.5 | 19.3 | 23.9 |
| Asset Turnover | 0.28 | 0.30 | 0.35 | 0.33 | 0.33 |
| Fixed Asset Turnover | 21.1 | 23.6 | 27.2 | 29.7 | 30.4 |
| Dividend Yield | 2.10% | 2.14% | 2.22% | 1.79% | 1.57% |
Evolution of Financial Ratios
From 2021 to 2025, The Hartford’s Return on Equity (ROE) steadily improved from 13.29% to 20.21%. The Current Ratio fluctuated significantly, starting at zero in 2021, spiking to nearly 25 in 2022, then stabilizing around 17.65 in 2025. Debt-to-Equity ratio trended downward from 0.28 in 2021 to 0.23 in 2025, reflecting reduced leverage. Profitability showed consistent enhancement.
Are the Financial Ratios Favorable?
In 2025, profitability metrics like ROE (20.21%) and net margin (13.57%) are favorable, outperforming typical industry benchmarks. Liquidity is mixed; the high Current Ratio (17.65) is marked unfavorable, while the Quick Ratio is favorable. Leverage remains low with a Debt-to-Equity of 0.23. Efficiency ratios show an unfavorable Asset Turnover (0.33) but favorable Fixed Asset Turnover (30.35). Overall, the financial ratios suggest a predominantly favorable profile with some liquidity and efficiency concerns.
Shareholder Return Policy
The Hartford Financial Services Group, Inc. maintains a consistent dividend payout ratio near 16%, with dividends per share rising steadily to $2.16 in 2025. The dividend yield hovers around 1.57%, supported by free cash flow coverage and moderate share buyback activity, indicating prudent capital allocation.
This approach balances shareholder returns with financial stability. The coverage ratios suggest distributions remain sustainable without risking excessive leverage. Overall, the policy supports long-term value creation through measured payouts and disciplined cash deployment.
Score analysis
The following radar chart visualizes The Hartford Financial Services Group’s key financial scores for a comprehensive evaluation:
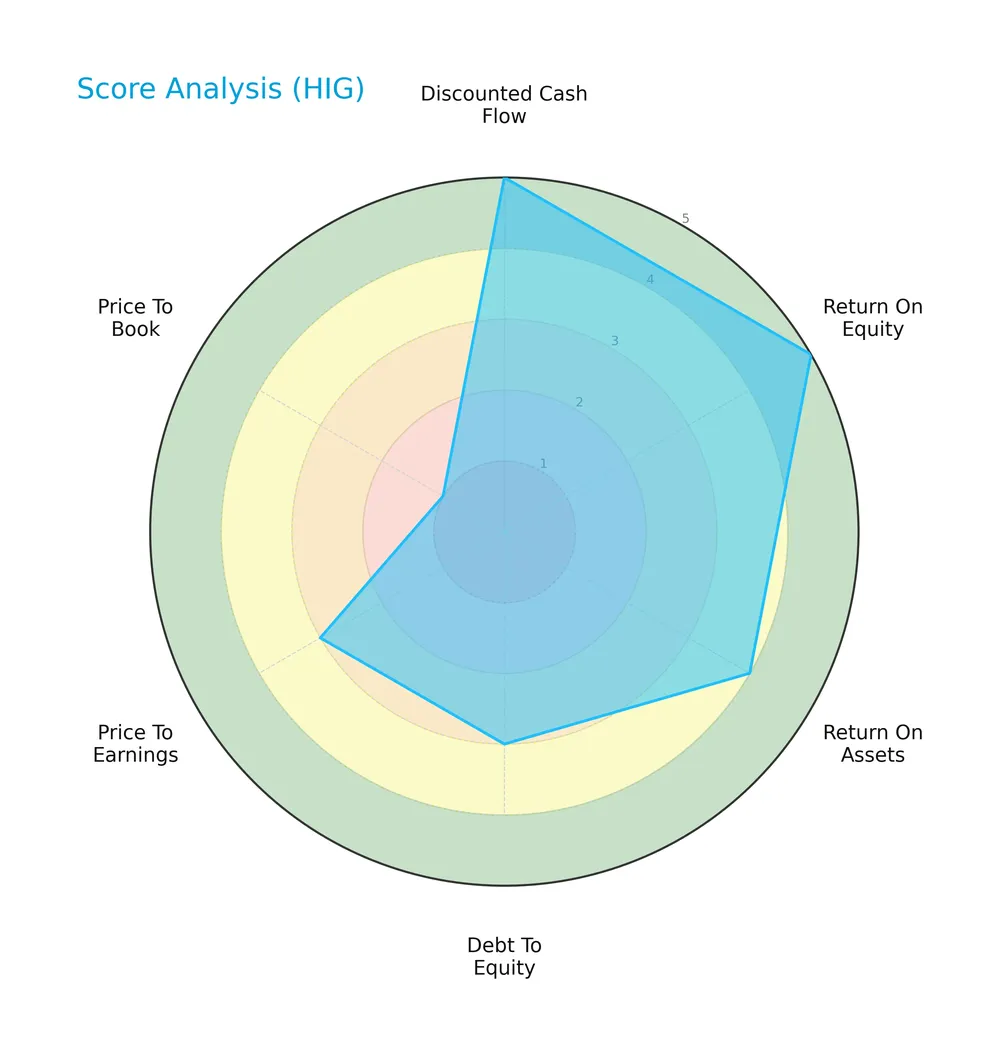
The company scores very favorably on discounted cash flow and return on equity, with moderate marks on debt-to-equity and price-to-earnings ratios. However, its price-to-book score is very unfavorable, indicating potential valuation concerns.
Analysis of the company’s bankruptcy risk
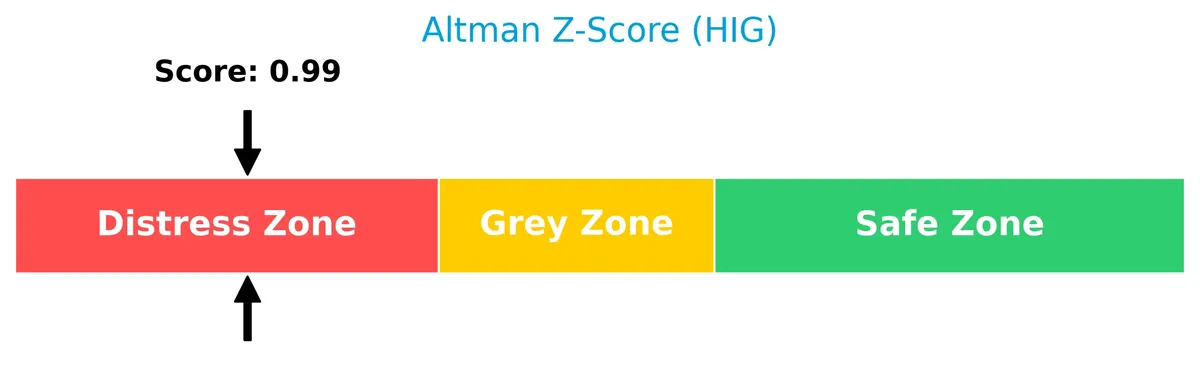
The Altman Z-Score places the company in the distress zone, signaling a high risk of bankruptcy based on key financial ratios:
Is the company in good financial health?
The Piotroski Score diagram illustrates the company’s strong financial health status:
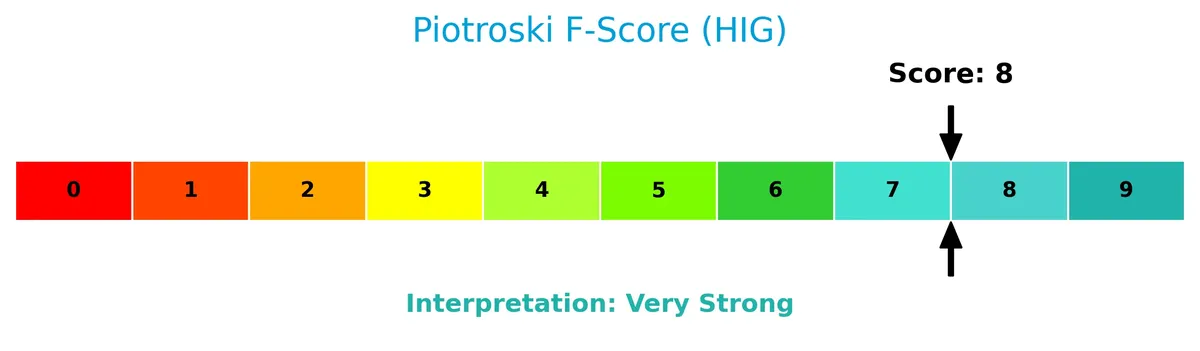
With a score of 8, the company demonstrates very strong financial fundamentals, suggesting robust profitability, liquidity, and operational efficiency.
Competitive Landscape & Sector Positioning
This analysis outlines The Hartford Financial Services Group’s strategic positioning and revenue segmentation. It examines key products, main competitors, and competitive advantages. I will assess whether the company holds a competitive advantage over its peers.
Strategic Positioning
The Hartford Financial Services Group, Inc. operates a diversified insurance and financial services portfolio across commercial and personal lines. Its geographic exposure spans the US, UK, and international markets, with significant revenue concentration in the United States and notable presence in Japan.
Revenue by Segment
This pie chart displays The Hartford Financial Services Group’s revenue distribution across key insurance segments for fiscal year 2013, highlighting the relative scale of each business line.
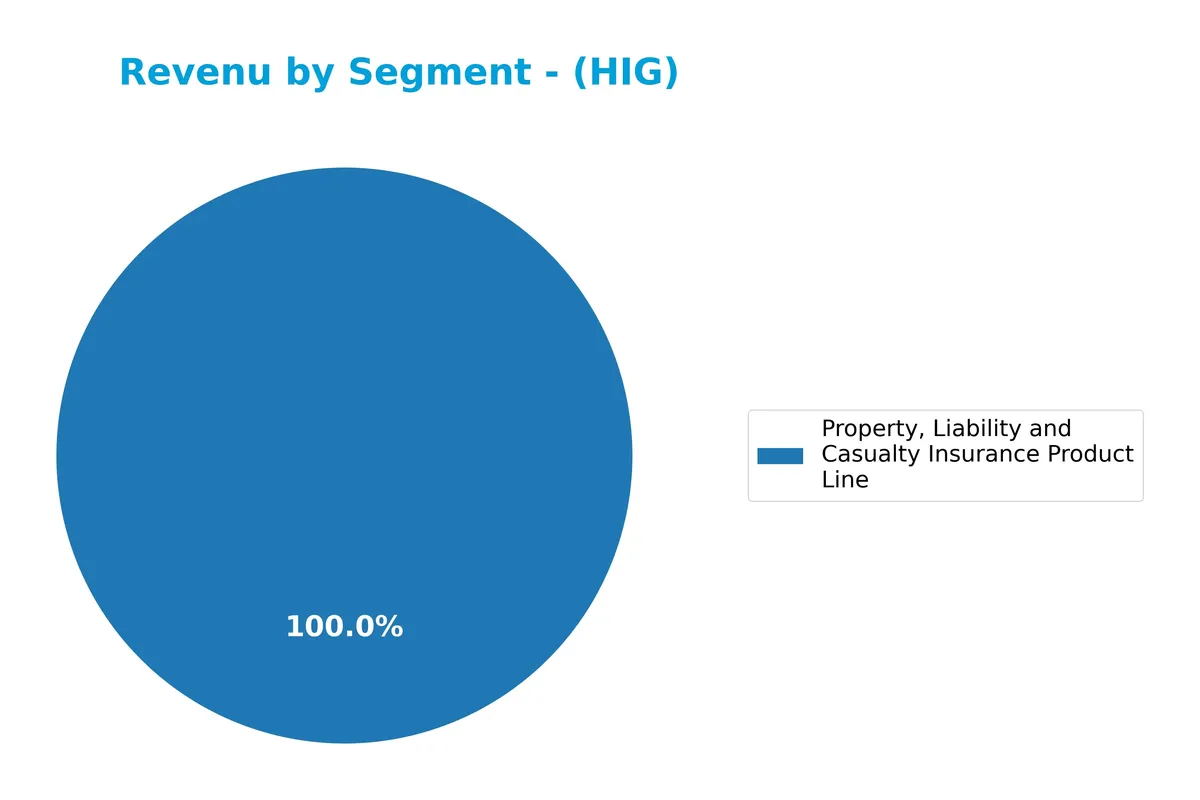
In 2013, Group Life and Accident leads with $5.2B, followed by Automobiles Commercial at $3.1B and Workers Compensation near $3B. The Property, Liability, and Casualty lines, significant in recent years, appear less granular here. Notably, Group Disability and Homeowners also contribute meaningfully. The data suggests a stable revenue mix dominated by core insurance products, with no abrupt concentration risks or segmental slowdowns in that period.
Key Products & Brands
The Hartford Financial Services Group offers a diversified range of insurance and investment products focused on commercial and personal customers:
| Product | Description |
|---|---|
| Commercial Lines | Workers’ compensation, property, automobile, liability, umbrella, bond, marine, livestock, reinsurance. |
| Personal Lines | Automobile, homeowners, and personal umbrella coverages via direct and agent channels. |
| Group Benefits | Group life, disability, and other coverages for employer groups, associations, and affinity groups. |
| Property & Casualty Other | Coverage for asbestos and environmental exposures. |
| Hartford Funds | Investment products for retail and retirement accounts, including ETFs and advisory services. |
The company’s product mix spans broad insurance lines and asset management, serving both individual and institutional clients through various distribution channels. This diversity supports stability across market cycles.
Main Competitors
There are 5 competitors in the financial services sector, with this table listing the top 10 leaders by market capitalization:
| Competitor | Market Cap. |
|---|---|
| Berkshire Hathaway Inc. | 1.07T |
| American International Group, Inc. | 45.5B |
| The Hartford Financial Services Group, Inc. | 38.2B |
| Arch Capital Group Ltd. | 34.9B |
| Principal Financial Group, Inc. | 20.1B |
The Hartford ranks 3rd among its competitors with a market cap just 3.7% of the sector leader, Berkshire Hathaway. It sits below the average market cap of the top 10 competitors but remains above the sector median. The company holds a 14.66% market cap gap to the next competitor above, American International Group.
Comparisons with competitors
Check out how we compare the company to its competitors:
Does HIG have a competitive advantage?
The Hartford Financial Services Group, Inc. demonstrates a sustainable competitive advantage, supported by a very favorable moat status. Its ROIC exceeds WACC by nearly 22%, indicating efficient capital use and consistent value creation.
Looking ahead, HIG’s diverse insurance and financial services across the US and international markets offer opportunities for growth. Continued expansion in group benefits and customized insurance products could further strengthen its market position.
SWOT Analysis
This analysis highlights The Hartford Financial Services Group’s core strategic factors shaping its competitive position.
Strengths
- strong ROIC at 28.2% well above WACC
- diversified insurance and financial services portfolio
- favorable income and margin growth trends
Weaknesses
- low Altman Z-Score indicates financial distress risk
- unfavorable current ratio suggests liquidity concerns
- moderate price-to-book valuation
Opportunities
- expanding digital distribution channels
- growth in group benefits and specialty coverages
- rising demand for risk management solutions
Threats
- intense competition in insurance sector
- regulatory changes impacting underwriting
- economic downturns affecting investment income
The Hartford demonstrates a robust moat with solid profitability and growth. However, liquidity risks and financial distress signals require cautious monitoring. The company should leverage digital expansion and specialty products to offset competitive and regulatory pressures.
Stock Price Action Analysis
The weekly stock chart for The Hartford Financial Services Group, Inc. (HIG) highlights price movements and key levels over the past 12 months:
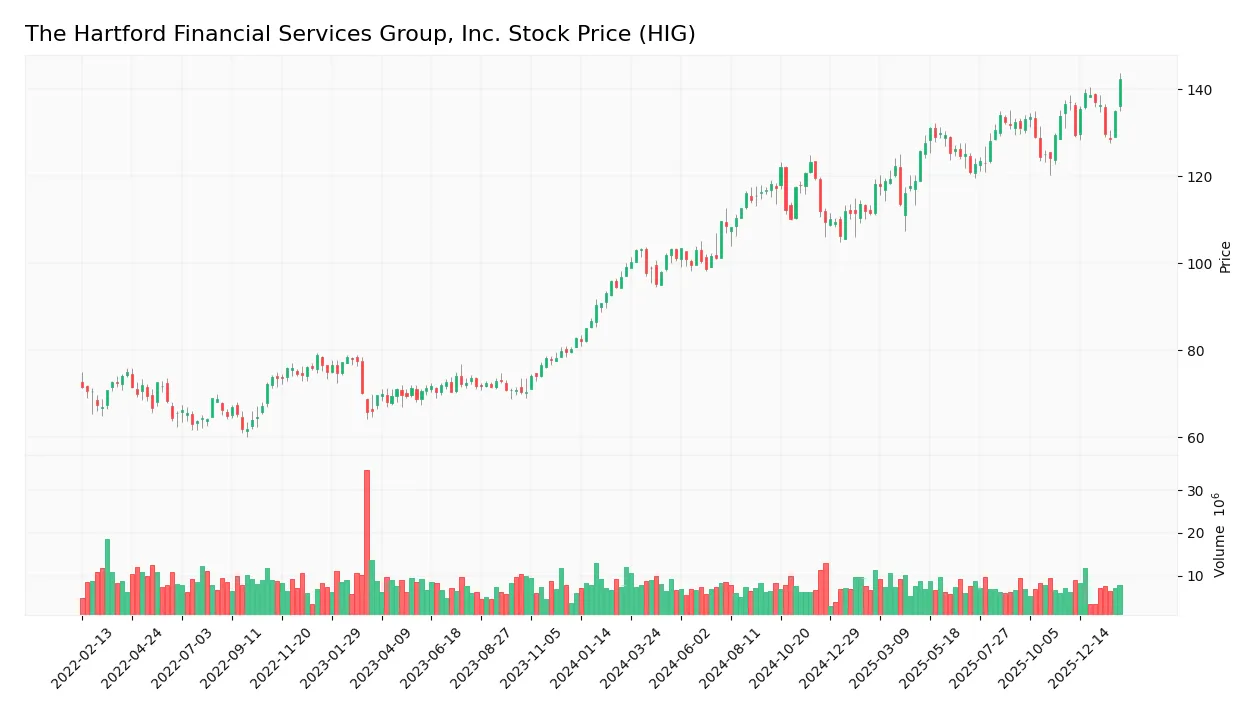
Trend Analysis
HIG’s stock rose 38% over the past year, confirming a bullish trend with accelerating momentum. The price ranged from a low of 95.3 to a high of 142.56, showing strong upward movement. Volatility, measured by a 12.07 standard deviation, supports notable price swings within this bullish acceleration.
Volume Analysis
Trading volume over the last three months shows a slight decrease overall, with buyer volume at 43.1M and seller volume at 44.8M. Buyer dominance is nearly balanced at 49.06%, indicating neutral investor sentiment and mixed market participation during this recent period.
Target Prices
Analysts present a confident target consensus for The Hartford Financial Services Group, Inc. (HIG).
| Target Low | Target High | Consensus |
|---|---|---|
| 135 | 165 | 152.67 |
The target range reflects moderate optimism, with a consensus suggesting a potential upside of roughly 10-15% from current levels.

Don’t Let Luck Decide Your Entry Point
Optimize your entry points with our advanced ProRealTime indicators. You’ll get efficient buy signals with precise price targets for maximum performance. Start outperforming now!
Analyst & Consumer Opinions
This section examines recent analyst ratings and consumer feedback concerning The Hartford Financial Services Group, Inc. (HIG).
Stock Grades
Here are the latest verified grades from leading financial institutions for The Hartford Financial Services Group, Inc.:
| Grading Company | Action | New Grade | Date |
|---|---|---|---|
| Keefe, Bruyette & Woods | Maintain | Outperform | 2026-02-05 |
| Citigroup | Maintain | Neutral | 2026-02-04 |
| Morgan Stanley | Maintain | Equal Weight | 2026-02-03 |
| Wells Fargo | Maintain | Overweight | 2026-02-02 |
| Cantor Fitzgerald | Maintain | Overweight | 2026-02-02 |
| Roth Capital | Maintain | Neutral | 2026-01-30 |
| Cantor Fitzgerald | Maintain | Overweight | 2026-01-14 |
| Wells Fargo | Maintain | Overweight | 2026-01-13 |
| Evercore ISI Group | Maintain | In Line | 2026-01-07 |
| JP Morgan | Maintain | Neutral | 2026-01-07 |
The grading consensus leans toward a positive outlook, with multiple Overweight and Outperform ratings balanced by a significant number of Neutral and Hold positions. No recent downgrades or Sell ratings suggest stability in analyst sentiment.
Consumer Opinions
Consumers express mixed feelings about The Hartford Financial Services Group, Inc., reflecting both trust in its financial products and concerns about customer service.
| Positive Reviews | Negative Reviews |
|---|---|
| Reliable claims processing speeds | Long wait times on customer support calls |
| Competitive premiums for quality coverage | Confusing policy terms and conditions |
| Helpful and knowledgeable agents | Occasional billing errors reported |
Overall, consumers praise The Hartford for dependable claims handling and competitive pricing. However, frequent complaints about customer support delays and policy clarity highlight areas needing improvement.
Risk Analysis
Below is a summary table highlighting key risks facing The Hartford Financial Services Group, Inc. as of 2026:
| Category | Description | Probability | Impact |
|---|---|---|---|
| Financial Health | Altman Z-Score in distress zone suggests elevated bankruptcy risk | High | High |
| Market Volatility | Low beta (0.603) limits market risk but exposes to sector shocks | Medium | Medium |
| Liquidity | Extremely high current ratio (17.65) signals potential asset inefficiency | Medium | Medium |
| Operational | Asset turnover is low (0.33), indicating inefficient asset use | Medium | Medium |
| Valuation | Price-to-book ratio unfavorable, may reflect market skepticism | Medium | Medium |
| Debt Management | Low debt-to-equity (0.23) and strong interest coverage provide cushion | Low | Low |
The most concerning risk is the distressed Altman Z-Score, signaling financial fragility despite strong profitability metrics. This underscores potential solvency issues if market conditions worsen. Liquidity and asset efficiency also warrant monitoring, as unusually high current ratios and low asset turnover could constrain growth. Overall, The Hartford’s conservative leverage partly offsets these risks, but prudence remains essential given the insurance sector’s vulnerability to catastrophic losses.
Should You Buy The Hartford Financial Services Group, Inc.?
The Hartford appears to be a robust profit generator with a very favorable moat, reflecting strong value creation through growing ROIC well above WACC. Despite a manageable but moderate leverage profile and some liquidity concerns, its A- rating suggests a cautiously optimistic financial health profile.
Strength & Efficiency Pillars
The Hartford Financial Services Group, Inc. displays robust operational efficiency with a net margin of 13.57% and a return on equity (ROE) of 20.21%. Its return on invested capital (ROIC) stands at an impressive 28.21%, significantly surpassing its weighted average cost of capital (WACC) of 6.22%. This gap clearly marks the company as a value creator, generating returns well above the cost of capital. Additionally, a strong Piotroski score of 8 signals solid financial strength and operational discipline.
Weaknesses and Drawbacks
The company is currently in financial distress, as indicated by its Altman Z-Score of 1.02, placing it in the distress zone and raising bankruptcy concerns. This solvency risk overshadows other positives. While valuation metrics like a price-to-earnings ratio of 10.14 appear reasonable, the price-to-book ratio of 2.05 is neutral. The extremely high current ratio of 17.65 suggests potential inefficiencies in working capital management. Recent buyer dominance has faded to a neutral stance at 49.06%, reflecting short-term market uncertainty.
Our Final Verdict about The Hartford Financial Services Group, Inc.
Despite strong operational margins and robust value creation, the company’s Altman Z-Score of 1.02 places it in the distress zone. This solvency risk makes the investment profile highly speculative and too risky for conservative capital. Investors should exercise caution, as the financial health concerns may outweigh the company’s attractive profitability and long-term potential.
Disclaimer: This content is for informational purposes only and does not constitute financial, investment, or other professional advice. Investing in financial markets involves a significant risk of loss, and past performance is not indicative of future results.
Additional Resources
- HARTFORD INSURANCE GROUP, INC. SEC 10-K Report – TradingView (Feb 20, 2026)
- Decoding The Hartford Insurance Group Inc (HIG): A Strategic SWO – GuruFocus (Feb 21, 2026)
- NEOS Investment Management LLC Increases Stock Position in The Hartford Insurance Group, Inc. $HIG – MarketBeat (Feb 19, 2026)
- Keefe Bruyette raises its price target on The Hartford Insurance Group (HIG) to $163 and maintains an outperform rating – MSN (Feb 18, 2026)
- Hartford Insurance Group’s (HIG) Delivered Strong Earnings Growth in Q4-2025 – Yahoo Finance (Feb 07, 2026)
For more information about The Hartford Financial Services Group, Inc., please visit the official website: thehartford.com