Home > Analyses > Financial Services > The Goldman Sachs Group, Inc.
Goldman Sachs shapes global finance, influencing how capital flows and deals are structured worldwide. Its dominance spans investment banking, asset management, and wealth advisory, powering corporations and governments alike. Renowned for innovation and strategic insight, Goldman Sachs sets industry standards in complex financial markets. As market dynamics evolve, I ask: does Goldman’s robust franchise still justify its lofty valuation and growth expectations in 2026? This analysis digs deep to find out.

Table of contents
Business Model & Company Overview
The Goldman Sachs Group, Inc., founded in 1869 and headquartered in New York City, stands as a dominant player in financial capital markets. Its business weaves together investment banking, global markets, asset management, and consumer wealth management into a seamless financial services ecosystem. This integration fuels strategic advisory, underwriting, trading, and personalized wealth solutions for corporations, governments, and individuals worldwide.
Goldman Sachs generates value through a balanced mix of advisory fees, underwriting commissions, trading revenues, and asset management fees. Its global footprint spans the Americas, Europe, and Asia, delivering tailored financial products across diverse markets. The company’s economic moat lies in its brand prestige, expansive client network, and diversified revenue streams, positioning it to shape the evolving landscape of global finance.
Financial Performance & Fundamental Metrics
I analyze The Goldman Sachs Group, Inc.’s income statement, key financial ratios, and dividend payout policy to assess its core financial health and shareholder value.
Income Statement
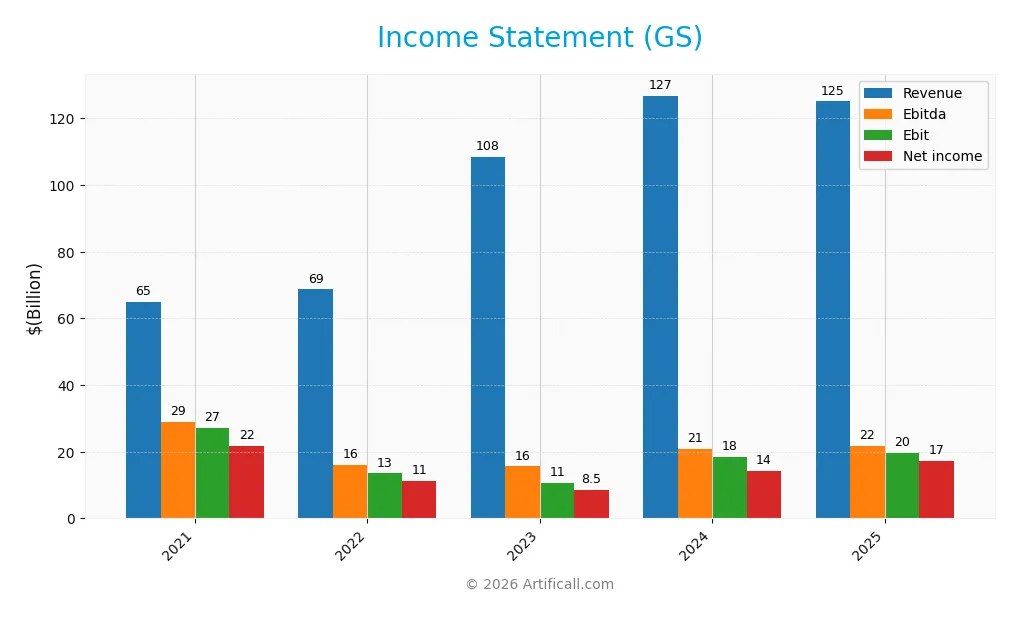
The table below summarizes The Goldman Sachs Group, Inc.’s key income statement metrics for fiscal years 2021 through 2025, reflecting revenue, expenses, profitability, and earnings per share.
| 2021 | 2022 | 2023 | 2024 | 2025 | |
|---|---|---|---|---|---|
| Revenue | 65B | 69B | 108B | 127B | 125B |
| Cost of Revenue | 6B | 24B | 63B | 75B | 68B |
| Operating Expenses | 32B | 31B | 34B | 34B | 38B |
| Gross Profit | 59B | 45B | 45B | 52B | 57B |
| EBITDA | 29B | 16B | 16B | 21B | 22B |
| EBIT | 27B | 13B | 11B | 18B | 20B |
| Interest Expense | 6B | 21B | 62B | 73B | 67B |
| Net Income | 22B | 11B | 9B | 14B | 17B |
| EPS | 60.35 | 30.57 | 23.05 | 41.22 | 51.95 |
| Filing Date | 2022-02-25 | 2023-02-24 | 2024-02-28 | 2025-02-27 | 2026-02-25 |
Income Statement Evolution
From 2021 to 2025, Goldman Sachs’ revenue nearly doubled, rising 92.5%. However, net income declined by 20.6%, reflecting margin pressure. Gross profit grew 9.6% year-over-year in 2025 despite a slight 1.4% revenue dip. EBIT expanded 6.7%, and net margin improved 22%, showing better profitability despite cost challenges.
Is the Income Statement Favorable?
In 2025, Goldman Sachs reported $125B revenue with a 45.7% gross margin, signaling healthy core profitability. EBIT margin stood at 15.7%, supported by disciplined operating expenses. Interest expense remains high at 53.4% of interest income, a notable headwind. Overall, 57% of income statement metrics show favorable trends, indicating solid but mixed fundamentals.
Financial Ratios
The table below presents key financial ratios for The Goldman Sachs Group, Inc. from 2021 to 2025, illustrating profitability, liquidity, leverage, valuation, and efficiency metrics:
| Ratios | 2021 | 2022 | 2023 | 2024 | 2025 |
|---|---|---|---|---|---|
| Net Margin | 33% | 16% | 8% | 11% | 14% |
| ROE | 20% | 10% | 7% | 12% | 14% |
| ROIC | 3.0% | 1.7% | 1.0% | 1.6% | 1.0% |
| P/E | 6.2 | 10.7 | 15.4 | 13.2 | 16.0 |
| P/B | 1.22 | 1.03 | 1.12 | 1.54 | 2.20 |
| Current Ratio | 0.97 | 0.89 | 0.94 | 0.93 | 1.21 |
| Quick Ratio | 0.97 | 0.89 | 0.94 | 0.93 | 1.21 |
| D/E | 4.44 | 3.71 | 4.99 | 5.06 | 4.95 |
| Debt-to-Assets | 33% | 30% | 36% | 37% | 34% |
| Interest Coverage | 4.79 | 0.63 | 0.17 | 0.25 | 0.29 |
| Asset Turnover | 0.04 | 0.05 | 0.07 | 0.08 | 0.07 |
| Fixed Asset Turnover | 3.19 | 3.57 | 8.08 | 12.70 | 3.47 |
| Dividend Yield | 2.0% | 3.0% | 3.2% | 2.4% | 1.9% |
Evolution of Financial Ratios
Return on Equity (ROE) showed a moderate recovery, rising from 7.3% in 2023 to 13.7% in 2025, indicating improved profitability. The Current Ratio increased from below 1.0 in earlier years to 1.21 in 2025, reflecting better short-term liquidity. Debt-to-Equity remained elevated, fluctuating near 5.0, signaling consistently high leverage.
Are the Financial Ratios Fovorable?
Profitability metrics paint a mixed picture: net margin is favorable at 13.7%, but Return on Invested Capital (ROIC) at 0.98% is weak versus the 8.99% WACC. Liquidity ratios are neutral to favorable, with a current ratio of 1.21 and quick ratio favorable at 1.21. Leverage is unfavorable, as debt-to-equity nears 5.0 and interest coverage is low at 0.29. The overall ratio stance is slightly unfavorable.
Shareholder Return Policy
The Goldman Sachs Group, Inc. maintains a consistent dividend payout ratio around 30%, with dividends per share rising from $7.77 in 2021 to $16.88 in 2025. The annual dividend yield averaged near 2%, supported by moderate payout coverage, though free cash flow per share shows recent declines, signaling potential distribution risks.
Share buybacks are part of the capital allocation but free cash flow volatility and high leverage ratios warrant caution. This dividend and repurchase strategy reflects a balanced approach, yet sustaining long-term shareholder value depends on stabilizing cash flows and managing debt effectively.
Score analysis
Here is a radar chart illustrating The Goldman Sachs Group’s key financial scores across multiple valuation and performance metrics:
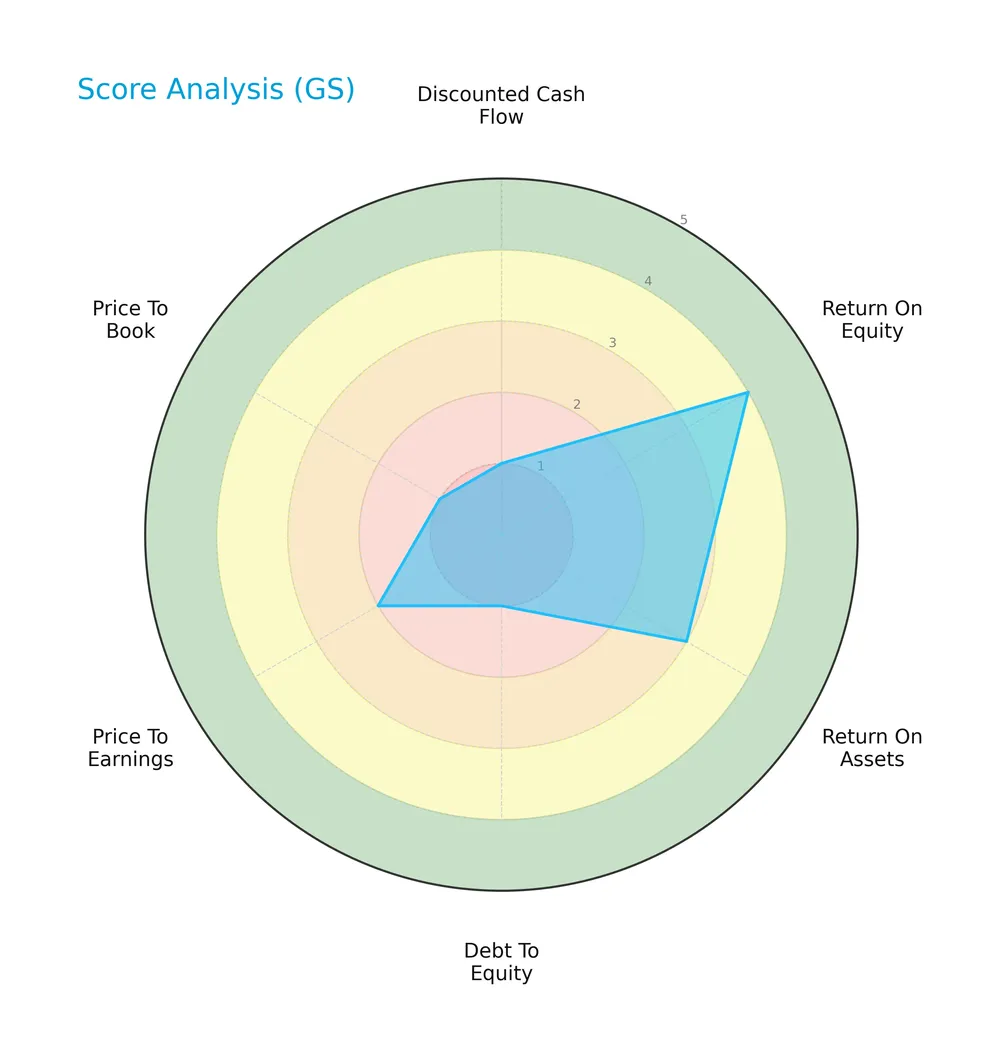
The scores reveal mixed signals: strong return on equity (4) and moderate return on assets (3) contrast sharply with very unfavorable scores in discounted cash flow (1), debt to equity (1), and price to book (1). Price to earnings is also unfavorable (2), indicating valuation concerns.
Analysis of the company’s bankruptcy risk
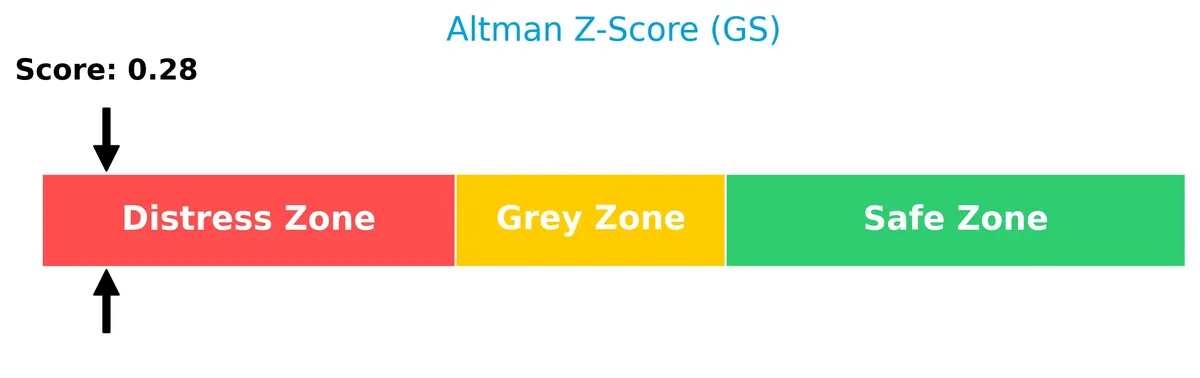
The Altman Z-Score places the company deep in the distress zone, signaling a significant risk of financial distress and potential bankruptcy:
Is the company in good financial health?
The Piotroski Score diagram highlights the company’s financial strength with a strong score of 7 out of 9:
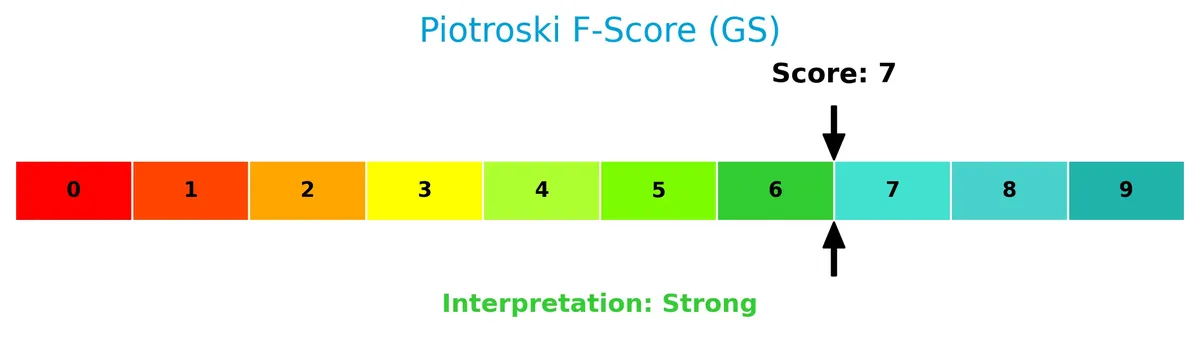
This strong Piotroski Score suggests solid financial health, reflecting good profitability, efficiency, and leverage metrics despite some other risk indicators.
Competitive Landscape & Sector Positioning
This section examines The Goldman Sachs Group, Inc.’s strategic positioning within the financial services sector. It explores revenue by segment, key products, main competitors, and competitive advantages. I will assess whether Goldman Sachs holds a competitive advantage over its peers.
Strategic Positioning
Goldman Sachs operates a diversified portfolio across four main segments: Investment Banking, Global Markets, Asset Management, and Consumer & Wealth Management. Geographically, it generates most revenue in the Americas (36.5B in 2025), followed by EMEA (14.2B) and Asia (7.6B), reflecting broad international exposure within capital markets.
Revenue by Segment
This pie chart illustrates Goldman Sachs’ revenue distribution across key business segments for the fiscal year 2025, highlighting their relative contribution to total revenue.
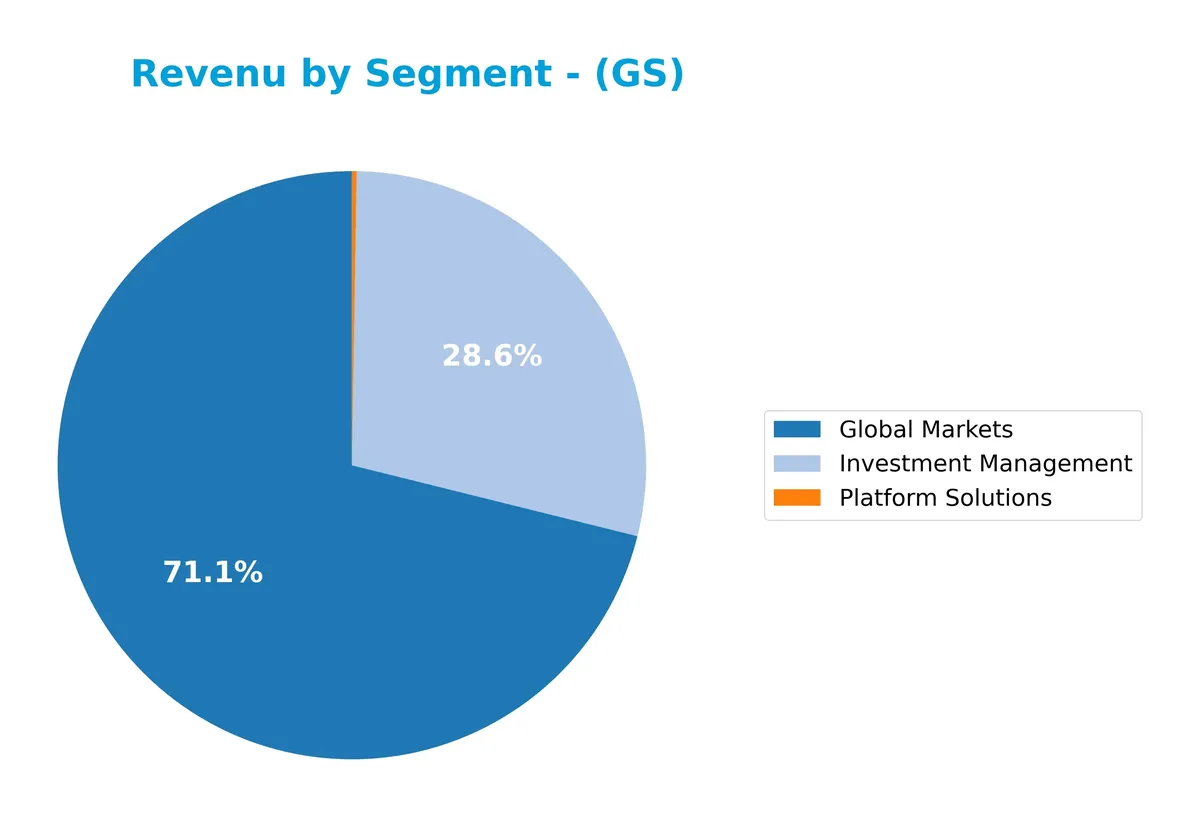
In 2025, Global Markets dominates Goldman Sachs’ revenue with $41.5B, showing robust growth from prior years. Investment Management steadily increased to $16.7B, underscoring its strategic importance. Platform Solutions, however, fell sharply to $151M, indicating a potential shift or divestiture. The concentration in Global Markets heightens cyclical risk but also reflects the firm’s strength in trading and market-making activities.
Key Products & Brands
The Goldman Sachs Group, Inc. generates revenue through its main financial service segments as follows:
| Product | Description |
|---|---|
| Investment Management | Manages assets across equity, fixed income, hedge funds, credit funds, private equity, and real estate. Provides tailored investment advisory services. |
| Global Markets | Engages in client execution for cash and derivative instruments, credit, interest rates, equities, currencies, commodities, and related products. |
| Platform Solutions | Provides technology-driven financial services and infrastructure solutions to clients. |
| Investment Banking | Offers advisory services on mergers and acquisitions, restructurings, underwriting equity and debt securities, and financing solutions. |
| Consumer & Wealth Management | Delivers wealth advisory, banking, financial planning, investment management, deposit taking, and lending services to individual clients. |
Goldman Sachs operates diversified financial segments with Investment Management and Global Markets leading revenue generation. Investment Banking and Consumer & Wealth Management complement its broad service offering. Platform Solutions remains a smaller, evolving unit.
Main Competitors
There are 6 main competitors in the Financial – Capital Markets industry. Below are the top 10 leaders by market capitalization:
| Competitor | Market Cap. |
|---|---|
| Morgan Stanley | 289B |
| The Goldman Sachs Group, Inc. | 287B |
| The Charles Schwab Corporation | 185B |
| Robinhood Markets, Inc. | 102B |
| Raymond James Financial, Inc. | 33B |
| Hut 8 Corp. | 5B |
The Goldman Sachs Group, Inc. ranks 2nd among its competitors, with a market cap at 96.5% of the leader Morgan Stanley. It stands above both the average market cap of the top 10 (150B) and the sector median (143B). The company maintains a 3.65% gap below Morgan Stanley, its closest rival, indicating strong positioning in the sector.
Comparisons with competitors
Check out how we compare the company to its competitors:
Does GS have a competitive advantage?
The Goldman Sachs Group, Inc. currently does not present a competitive advantage. Its ROIC is significantly below WACC, indicating value destruction, and its profitability is declining over the recent period.
Looking ahead, GS operates diverse segments including Investment Banking, Global Markets, Asset Management, and Consumer & Wealth Management. Expansion into emerging markets and innovations in consumer wealth services could offer future growth opportunities.
SWOT Analysis
This SWOT analysis distills Goldman Sachs’ strategic position by highlighting internal strengths and weaknesses alongside external opportunities and threats.
Strengths
- strong brand and market presence
- diversified revenue streams across four segments
- robust asset management capabilities
Weaknesses
- declining ROIC below WACC signals value destruction
- high debt-to-equity ratio of 4.95 raises financial risk
- low interest coverage ratio of 0.29 limits buffer for rising rates
Opportunities
- expansion in emerging markets with growing financial needs
- increased demand for wealth management and advisory services
- technological innovation in trading and asset management
Threats
- regulatory scrutiny and compliance costs
- market volatility impacting investment banking fees
- competition from fintech and alternative asset managers
Goldman Sachs benefits from its diversified business model and strong brand but faces value erosion indicated by ROIC trends. The company must leverage growth opportunities in emerging markets and wealth management while managing its leverage and navigating regulatory risks.
Stock Price Action Analysis
The weekly stock chart for The Goldman Sachs Group, Inc. highlights price movements and trend shifts over the last 12 months:
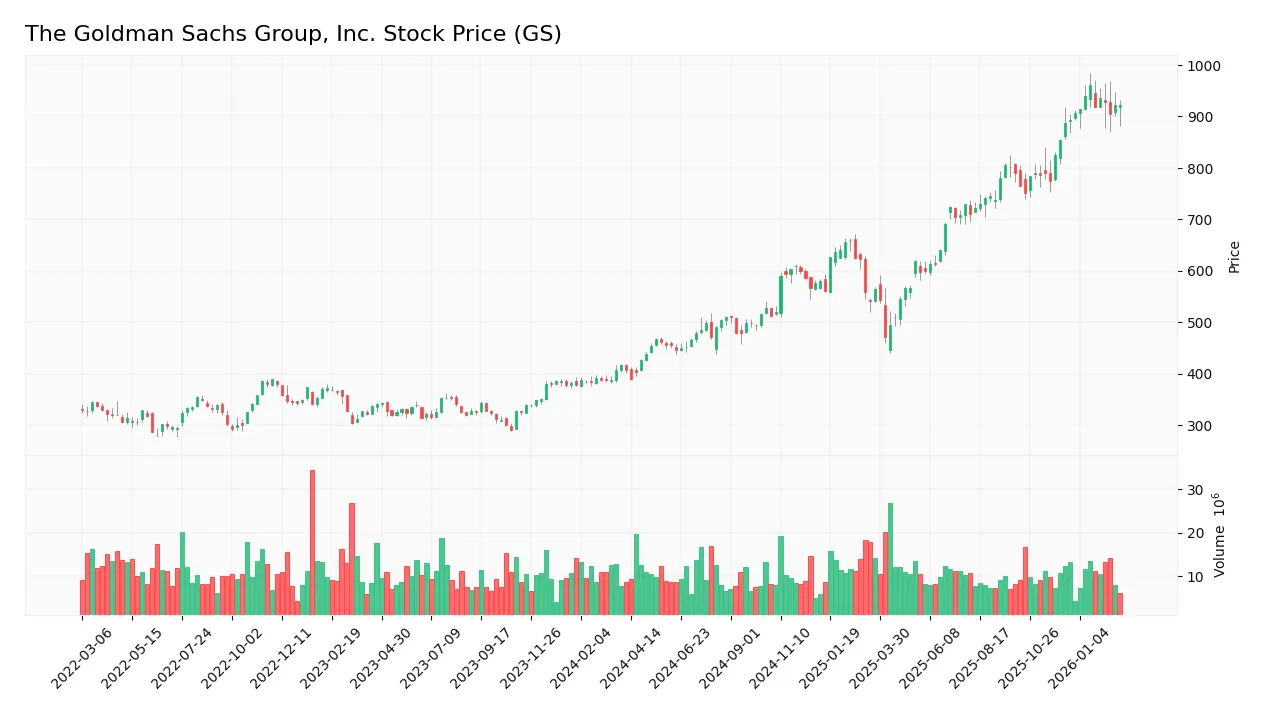
Trend Analysis
Over the past 12 months, GS’s stock price increased by 125.79%, indicating a strong bullish trend. The price range spanned from a low of 389.49 to a high of 962.0, with volatility marked by a 154.46 standard deviation. The trend shows signs of deceleration.
Volume Analysis
Over the last three months, trading volume has been decreasing overall. Buyer volume dominates at 64.34%, signaling buyer-driven activity. This suggests continued investor confidence but with reduced market participation recently.
Target Prices
Analysts set a broad but optimistic target consensus for Goldman Sachs.
| Target Low | Target High | Consensus |
|---|---|---|
| 604 | 1100 | 934 |
The wide target range reflects varied outlooks, yet the consensus near 934 signals confidence in strong growth potential.

Don’t Let Luck Decide Your Entry Point
Optimize your entry points with our advanced ProRealTime indicators. You’ll get efficient buy signals with precise price targets for maximum performance. Start outperforming now!
Analyst & Consumer Opinions
This section examines analyst grades and consumer feedback to provide insight into The Goldman Sachs Group, Inc.’s market perception.
Stock Grades
The following table presents the latest verified analyst grades for The Goldman Sachs Group, Inc., reflecting recent rating actions and assessments:
| Grading Company | Action | New Grade | Date |
|---|---|---|---|
| RBC Capital | maintain | Sector Perform | 2026-01-20 |
| Keefe, Bruyette & Woods | maintain | Market Perform | 2026-01-16 |
| Wells Fargo | maintain | Overweight | 2026-01-16 |
| JP Morgan | maintain | Neutral | 2026-01-08 |
| Barclays | maintain | Overweight | 2026-01-05 |
| Keefe, Bruyette & Woods | maintain | Market Perform | 2025-12-17 |
| JP Morgan | downgrade | Neutral | 2025-10-21 |
| Freedom Capital Markets | upgrade | Hold | 2025-10-17 |
| Keefe, Bruyette & Woods | maintain | Market Perform | 2025-10-17 |
| Citigroup | maintain | Neutral | 2025-10-16 |
Analyst ratings for Goldman Sachs have largely stabilized around neutral to market perform levels, with a modest tilt toward overweight from select firms. Recent upgrades and downgrades suggest cautious optimism but no decisive consensus shift.
Consumer Opinions
Consumer sentiment on The Goldman Sachs Group, Inc. reflects a mix of respect for its expertise and concerns about accessibility.
| Positive Reviews | Negative Reviews |
|---|---|
| “Exceptional financial advice and insights.” | “High fees make services less accessible.” |
| “Strong market knowledge and professional staff.” | “Customer service can be slow at times.” |
| “Reliable investment products with solid returns.” | “Complex product offerings confuse new clients.” |
Overall, clients praise Goldman Sachs for its market expertise and trustworthy advice. However, recurring complaints about fees and customer service suggest room for improvement in client experience.
Risk Analysis
The following table summarizes key risks facing The Goldman Sachs Group, Inc. as of 2026:
| Category | Description | Probability | Impact |
|---|---|---|---|
| Financial Health | Altman Z-Score of 0.28 signals high bankruptcy risk, placing GS in the distress zone. | High | Severe |
| Leverage | Debt-to-equity ratio near 5 indicates heavy reliance on debt, increasing financial stress. | High | High |
| Profitability | ROIC at 0.98% trails WACC of 8.99%, suggesting inefficient capital use. | Medium | Moderate |
| Liquidity | Current ratio 1.21 and quick ratio 1.21 are adequate but not robust for shocks. | Medium | Moderate |
| Market Volatility | Beta of 1.31 exposes shares to above-average market swings, increasing price fluctuations. | High | Moderate |
| Valuation Metrics | Unfavorable P/E and P/B scores indicate potential overvaluation risks. | Medium | Moderate |
| Interest Coverage | Interest coverage ratio 0.29 signals difficulty covering debt costs from earnings. | High | Severe |
The most pressing risks are GS’s distress zone Altman Z-Score and poor interest coverage, which raise red flags about solvency. Its heavy leverage amplifies vulnerability to economic downturns. Despite strong Piotroski health signals and favorable net margins, these financial strains warrant caution for investors.
Should You Buy The Goldman Sachs Group, Inc.?
The analytical interpretation suggests a profile of declining operational efficiency and a very unfavorable moat due to value destruction. Despite manageable profitability metrics, the substantial leverage profile and distress-level Altman Z-score temper optimism. The overall rating appears to be a cautious C+.
Strength & Efficiency Pillars
The Goldman Sachs Group, Inc. posts a solid net margin of 13.73% and a return on equity of 13.74%, reflecting moderate profitability. Its gross margin of 45.7% and EBIT margin of 15.69% further underline operational efficiency. However, with a ROIC of 0.98% trailing its WACC of 8.99%, the company is not a value creator but rather eroding capital. Despite these challenges, the firm maintains a favorable Piotroski score of 7, signaling operational strength.
Weaknesses and Drawbacks
Goldman Sachs is in financial distress with an Altman Z-Score of 0.28, indicating a high bankruptcy risk. This solvency red flag overshadows other metrics. The debt-to-equity ratio of 4.95 is very unfavorable, exposing the company to leverage risk. Interest coverage at 0.29 signals difficulty servicing debt costs. Valuation multiples remain neutral, but the mounting financial strain and high leverage warrant caution for investors.
Our Final Verdict about The Goldman Sachs Group, Inc.
Despite favorable operational margins and a strong Piotroski score, the Altman Z-Score of 0.28 places Goldman Sachs deep in the distress zone. This solvency risk makes the investment profile highly speculative and too risky for conservative capital. Investors should weigh the potential rewards against the real threat of financial instability before considering exposure.
Disclaimer: This content is for informational purposes only and does not constitute financial, investment, or other professional advice. Investing in financial markets involves a significant risk of loss, and past performance is not indicative of future results.
Additional Resources
- Decoding The Goldman Sachs Group Inc (GS): A Strategic SWOT Insi – GuruFocus (Feb 26, 2026)
- The Goldman Sachs Group, Inc. (GS) Is a Trending Stock: Facts to Know Before Betting on It – Yahoo Finance (Feb 20, 2026)
- Mufg Securities Americas Inc. Purchases 1,480 Shares of The Goldman Sachs Group, Inc. $GS – MarketBeat (Feb 24, 2026)
- Goldman or Citigroup: Which Transformation Story Is More Compelling? – The Globe and Mail (Feb 25, 2026)
- Form 424B2 GOLDMAN SACHS GROUP INC – StreetInsider (Feb 25, 2026)
For more information about The Goldman Sachs Group, Inc., please visit the official website: goldmansachs.com