Home > Analyses > Consumer Defensive > The Estée Lauder Companies Inc.
The Estée Lauder Companies Inc. transforms daily routines into moments of luxury and self-expression through its iconic beauty and skincare products. As a powerhouse in the household and personal products industry, it commands a diverse portfolio of renowned brands celebrated for innovation, quality, and market influence worldwide. With a strong heritage and dynamic leadership, the company continuously adapts to evolving consumer trends. The key question now is whether its solid fundamentals still justify its current market valuation and growth prospects for investors.

Table of contents
Business Model & Company Overview
The Estée Lauder Companies Inc., founded in 1946 and headquartered in New York City, stands as a dominant player in the Household & Personal Products industry. It delivers a cohesive ecosystem of premium skin care, makeup, fragrance, and hair care products through an extensive portfolio of iconic brands such as M·A·C, Clinique, and La Mer. This broad yet integrated product offering underpins its mission to enhance beauty and personal care worldwide.
The company’s revenue engine balances sales across diverse channels including department stores, specialty retailers, e-commerce, and travel retail in the Americas, Europe, and Asia. By leveraging a mix of product innovation and strong brand licensing, Estée Lauder creates consistent value through both product sales and ancillary services. Its competitive advantage lies in a global footprint combined with a multi-brand strategy that fortifies its economic moat and shapes the future of beauty retail.
Financial Performance & Fundamental Metrics
This section provides a fundamental analysis of The Estée Lauder Companies Inc., focusing on its income statement, key financial ratios, and dividend payout policy.
Income Statement
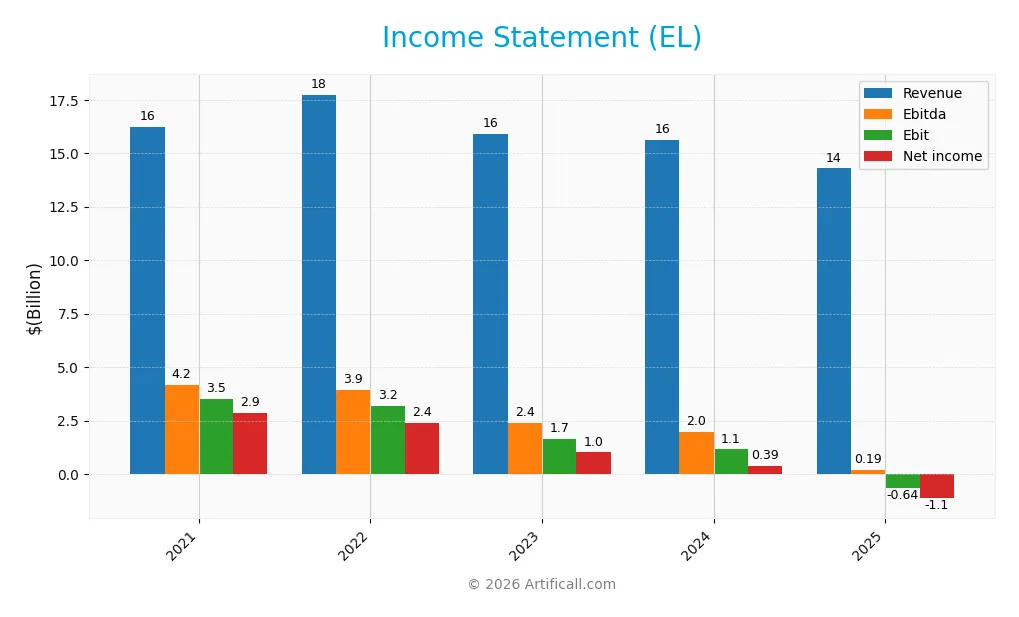
The following table presents The Estée Lauder Companies Inc.’s income statement data for fiscal years 2021 through 2025, showing key financial metrics in USD.
| 2021 | 2022 | 2023 | 2024 | 2025 | |
|---|---|---|---|---|---|
| Revenue | 16.2B | 17.7B | 15.9B | 15.6B | 14.3B |
| Cost of Revenue | 3.83B | 4.31B | 4.56B | 4.42B | 3.73B |
| Operating Expenses | 9.76B | 10.3B | 9.84B | 10.2B | 9.6B |
| Gross Profit | 12.4B | 13.4B | 11.3B | 11.2B | 10.6B |
| EBITDA | 4.16B | 3.93B | 2.40B | 1.98B | 0.19B |
| EBIT | 3.50B | 3.20B | 1.65B | 1.15B | -0.64B |
| Interest Expense | 0.17B | 0.17B | 0.26B | 0.38B | 0.40B |
| Net Income | 2.87B | 2.39B | 1.01B | 0.39B | -1.13B |
| EPS | 7.91 | 6.64 | 2.81 | 1.09 | -3.15 |
| Filing Date | 2021-08-27 | 2022-08-24 | 2023-08-18 | 2024-08-19 | 2025-08-20 |
Income Statement Evolution
From 2021 to 2025, The Estée Lauder Companies Inc. experienced a declining trend in revenue, falling from 16.2B in 2021 to 14.3B in 2025, a decrease of nearly 12% over the period. Gross margin remained relatively stable and favorable at around 74%, but the net margin deteriorated significantly, turning negative at -7.93% in 2025. EBIT margin also slipped into negative territory, indicating worsening profitability.
Is the Income Statement Favorable?
In 2025, revenue declined by 8.5% year-over-year to 14.3B, with gross profit down 5.6%, reflecting margin pressure. Operating expenses decreased proportionally but were insufficient to prevent an operating loss, as EBIT dropped by over 150%. Net income turned negative at -1.13B, with EPS falling to -3.15. Overall, the fundamentals for 2025 are unfavorable, with a majority of key profitability metrics showing significant deterioration.
Financial Ratios
The following table presents key financial ratios for The Estée Lauder Companies Inc. (EL) over the fiscal years 2021 to 2025, reflecting profitability, valuation, liquidity, leverage, and efficiency metrics:
| Ratios | 2021 | 2022 | 2023 | 2024 | 2025 |
|---|---|---|---|---|---|
| Net Margin | 17.7% | 13.5% | 6.3% | 2.5% | -7.9% |
| ROE | 47.4% | 42.8% | 18.0% | 7.3% | -29.3% |
| ROIC | 13.2% | 16.0% | 5.9% | 3.1% | 6.4% |
| P/E | 40.2 | 38.4 | 69.9 | 97.0 | -25.7 |
| P/B | 19.1 | 16.4 | 12.6 | 7.1 | 7.5 |
| Current Ratio | 1.84 | 1.60 | 1.46 | 1.39 | 1.30 |
| Quick Ratio | 1.37 | 1.10 | 0.99 | 1.01 | 0.92 |
| D/E | 1.34 | 1.37 | 1.82 | 1.85 | 2.44 |
| Debt-to-Assets | 36.9% | 36.6% | 43.4% | 45.3% | 47.5% |
| Interest Coverage | 15.1 | 19.0 | 5.9 | 2.6 | 2.4 |
| Asset Turnover | 0.74 | 0.85 | 0.68 | 0.72 | 0.72 |
| Fixed Asset Turnover | 3.63 | 3.86 | 3.20 | 3.14 | 2.79 |
| Dividend Yield | 0.65% | 0.92% | 1.32% | 2.50% | 2.12% |
Evolution of Financial Ratios
The Estée Lauder Companies Inc. experienced a significant decline in return on equity (ROE), dropping to -29.31% in 2025, indicating a sharp deterioration in profitability. The current ratio decreased to 1.3, reflecting a moderate reduction in liquidity but still above 1. The debt-to-equity ratio increased to 2.44, suggesting a rising leverage and higher reliance on debt financing, which marks a notable shift in the company’s capital structure.
Are the Financial Ratios Favorable?
In 2025, profitability ratios such as net margin (-7.93%) and ROE (-29.31%) were unfavorable, signaling losses and weak shareholder returns. Liquidity ratios, including the current ratio (1.3) and quick ratio (0.92), were neutral, indicating adequate short-term financial health. Leverage ratios showed increased risk with a debt-to-equity of 2.44, rated unfavorable. Market valuations presented mixed signals: a favorable price-to-earnings ratio but an unfavorable price-to-book. Overall, the financial ratios present a slightly unfavorable outlook.
Shareholder Return Policy
The Estée Lauder Companies Inc. maintained dividend payments with a 2025 dividend per share of 1.72 USD and a yield of 2.12%. The dividend payout ratio was negative at -54.5%, reflecting the company’s net losses, yet free cash flow coverage of dividends remains above 100%, indicating some sustainability.
Despite net losses in 2025, the firm continues share buybacks supporting returns. This approach, combining dividends and repurchases amid profitability challenges, suggests a complex balance between rewarding shareholders and managing financial risks for long-term value creation.
Score analysis
The following radar chart presents a comprehensive view of The Estée Lauder Companies Inc.’s key financial scores:
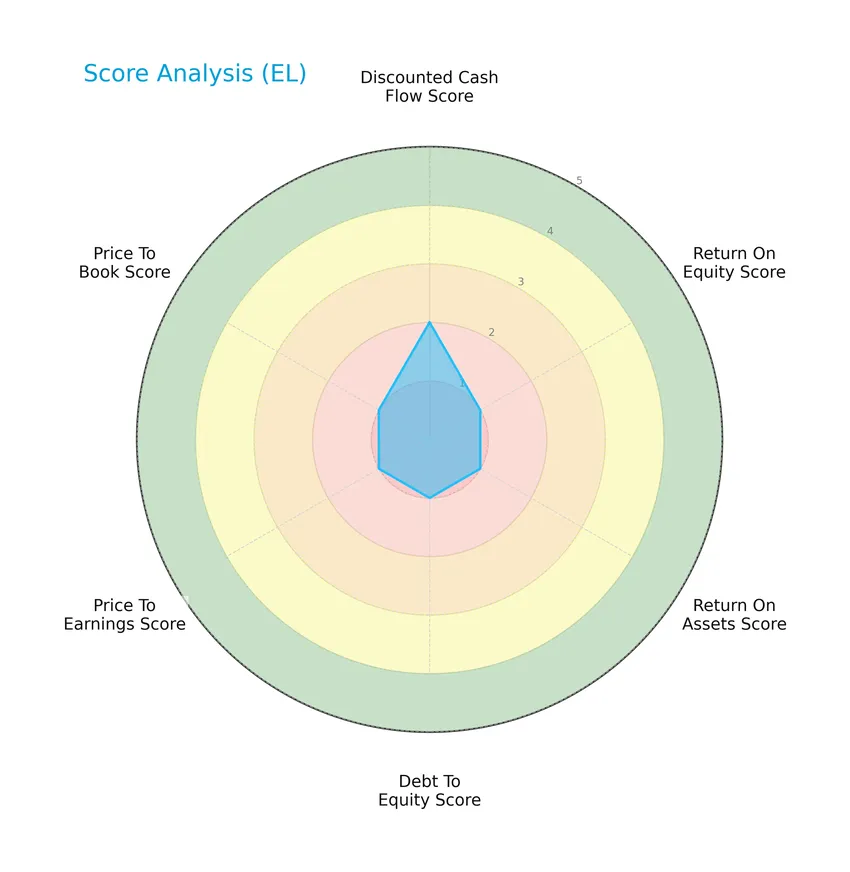
The company shows a generally very unfavorable performance across most financial metrics, including return on equity, return on assets, debt to equity, price to earnings, and price to book, each scoring 1. The discounted cash flow score is slightly better at 2, indicating moderate valuation prospects amidst overall weak fundamentals.
Analysis of the company’s bankruptcy risk
The Altman Z-Score situates the company in the safe zone, suggesting a low risk of bankruptcy based on its financial ratios:

Is the company in good financial health?
The Piotroski diagram illustrates the company’s financial strength based on nine criteria:

With a Piotroski Score of 5, the company is assessed to have average financial health, reflecting a moderate level of strength without clear indications of either strong or weak financial condition.
Competitive Landscape & Sector Positioning
This sector analysis will examine The Estée Lauder Companies Inc.’s strategic positioning, revenue segments, key products, main competitors, competitive advantages, and SWOT. I will assess whether the company maintains a competitive advantage over its peers in the household and personal products industry.
Strategic Positioning
The Estée Lauder Companies Inc. maintains a diversified product portfolio spanning skin care (7B+), makeup (4B+), fragrance (~2.5B), and hair care (~0.6B) segments. Geographically, it operates globally with balanced revenue streams from EMEA (5.4B), Asia Pacific (4.5B), and the United States (4.4B) in FY 2025.
Revenue by Segment
This pie chart illustrates The Estée Lauder Companies Inc.’s revenue distribution across four product segments for fiscal year 2025.
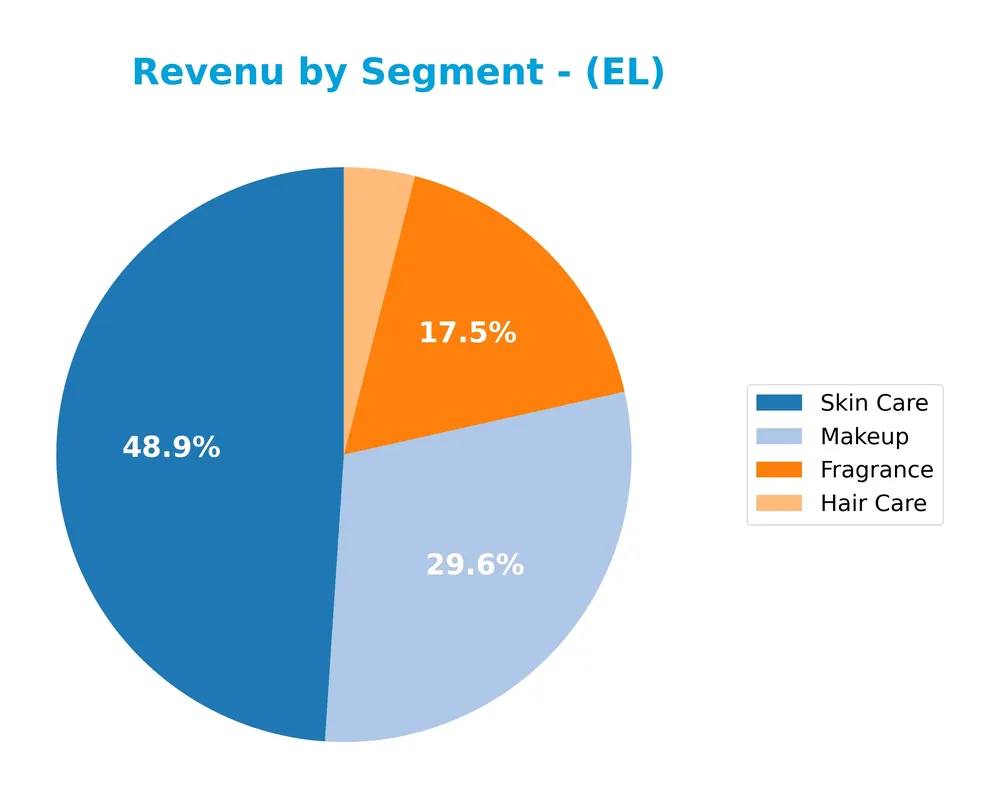
In 2025, Skin Care remains the dominant segment with $6.96B, followed by Makeup at $4.21B, Fragrance at $2.49B, and Hair Care at $565M. Compared to 2024, Skin Care and Makeup revenues declined, while Fragrance stayed flat and Hair Care decreased, indicating a slight slowdown and concentration risk in core categories, especially Skin Care. Investors should monitor evolving dynamics in these key segments.
Key Products & Brands
The Estée Lauder Companies Inc. offers a diversified portfolio of products and brands across beauty and personal care categories:
| Product | Description |
|---|---|
| Skin Care | Includes moisturizers, serums, cleansers, toners, body care, exfoliators, acne care, facial masks, and sun care. |
| Makeup | Comprises lipsticks, lip glosses, mascaras, foundations, eyeshadows, nail polishes, powders, and makeup tools. |
| Fragrance | Features eau de parfum sprays, colognes, lotions, powders, creams, candles, and soaps. |
| Hair Care | Encompasses shampoos, conditioners, styling products, treatments, finishing sprays, and hair color products. |
| Brands | Includes Estée Lauder, Clinique, MAC, Bobbi Brown, La Mer, Aveda, Jo Malone London, Bumble and bumble, and others. |
The company’s product range spans four main categories, with skin care consistently leading in revenue. Its broad brand portfolio supports diverse consumer preferences globally.
Main Competitors
There are 17 competitors in total, with the table below listing the top 10 leaders by market capitalization:
| Competitor | Market Cap. |
|---|---|
| The Procter & Gamble Company | 331.3B |
| Unilever PLC | 143.2B |
| Colgate-Palmolive Company | 62.6B |
| The Estée Lauder Companies Inc. | 38.5B |
| Kimberly-Clark Corporation | 33.7B |
| Kenvue Inc. | 33.2B |
| Church & Dwight Co., Inc. | 20.2B |
| The Clorox Company | 12.3B |
| e.l.f. Beauty, Inc. | 4.3B |
| Inter Parfums, Inc. | 2.7B |
The Estée Lauder Companies Inc. ranks 4th among its competitors, with a market capitalization about 13% of the leader, The Procter & Gamble Company. It is positioned below the average market cap of the top 10 competitors (68.2B) but remains above the sector median (4.3B). The company maintains a significant 47.6% market cap gap above its closest competitor, indicating a solid mid-tier position within the Household & Personal Products industry.
Comparisons with competitors
Check out how we compare the company to its competitors:
Does EL have a competitive advantage?
The Estée Lauder Companies Inc. does not present a competitive advantage currently, as its return on invested capital (ROIC) is below its weighted average cost of capital (WACC), indicating value destruction and declining profitability. The company’s income statement shows unfavorable margins and negative growth in revenue and net income over recent years.
Looking ahead, The Estée Lauder Companies Inc. operates across diverse geographic markets including the United States, Asia Pacific, and EMEA, with a broad portfolio of skincare, makeup, fragrance, and hair care brands. Opportunities may arise from expanding product lines and leveraging its established global distribution channels to adapt to changing consumer preferences.
SWOT Analysis
This SWOT analysis highlights The Estée Lauder Companies Inc.’s key internal and external factors to guide investment decisions.
Strengths
- strong global brand portfolio
- diversified product range
- presence in premium and mass markets
Weaknesses
- declining revenue and net income
- negative net and EBIT margins
- high debt-to-equity ratio
Opportunities
- growing demand in Asia Pacific
- expansion in e-commerce channels
- innovation in skincare and clean beauty
Threats
- intense competition in cosmetics
- economic downturns affecting consumer spending
- currency fluctuations impacting global sales
The company faces significant profitability and growth challenges despite its strong brand equity. Strategic focus on innovation and market expansion, especially in Asia Pacific and digital sales, is essential to counteract financial weaknesses and external competitive pressures.
Stock Price Action Analysis
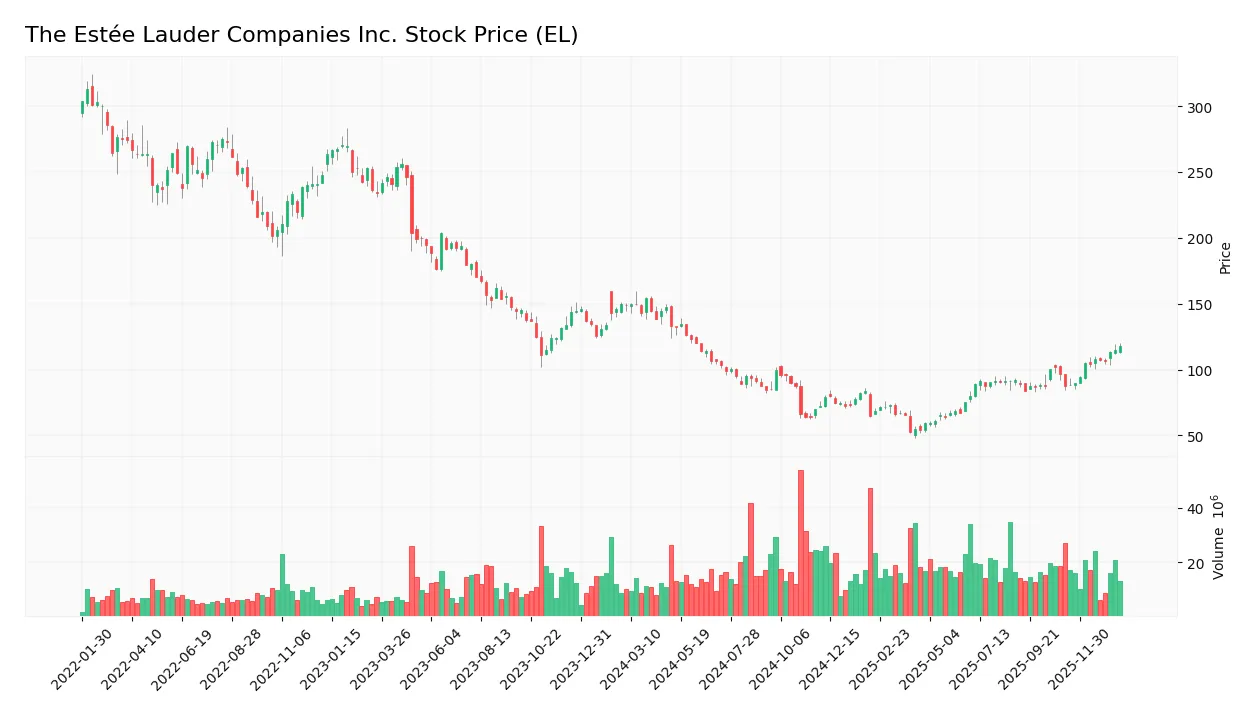
The following weekly chart illustrates The Estée Lauder Companies Inc. stock price movements over the last 100 weeks, highlighting key highs and lows:
Trend Analysis
Over the past 12 months, the stock price declined by 20.92%, indicating a bearish trend with accelerating downward momentum. The price ranged between a high of 154.15 and a low of 52.93, accompanied by significant volatility, as shown by a standard deviation of 24.65.
Volume Analysis
In the last three months, trading volumes have been increasing, driven predominantly by buyers who accounted for 70.01% of activity. This strong buyer dominance suggests growing investor interest and higher market participation during this period.
Target Prices
Analysts present a clear target consensus for The Estée Lauder Companies Inc., reflecting a balanced outlook.
| Target High | Target Low | Consensus |
|---|---|---|
| 130 | 70 | 109.3 |
The target prices indicate an optimistic high at 130 with a conservative low at 70, suggesting moderate growth potential with some downside risk.

Don’t Let Luck Decide Your Entry Point
Optimize your entry points with our advanced ProRealTime indicators. You’ll get efficient buy signals with precise price targets for maximum performance. Start outperforming now!
Analyst & Consumer Opinions
This section examines recent analyst ratings and consumer feedback regarding The Estée Lauder Companies Inc. (EL).
Stock Grades
Here is a summary of recent stock grades from recognized financial analysts for The Estée Lauder Companies Inc.:
| Grading Company | Action | New Grade | Date |
|---|---|---|---|
| TD Cowen | Maintain | Hold | 2026-01-21 |
| JP Morgan | Maintain | Overweight | 2026-01-16 |
| UBS | Maintain | Neutral | 2026-01-14 |
| Citigroup | Maintain | Neutral | 2026-01-14 |
| Wells Fargo | Maintain | Equal Weight | 2026-01-05 |
| Raymond James | Upgrade | Strong Buy | 2026-01-05 |
| Citigroup | Maintain | Neutral | 2025-12-17 |
| Evercore ISI Group | Maintain | Outperform | 2025-12-16 |
| Rothschild & Co | Downgrade | Sell | 2025-11-25 |
| Argus Research | Upgrade | Buy | 2025-11-11 |
The grading trend reveals a mixed consensus with the majority maintaining neutral or hold ratings, while a few upgrades to buy and strong buy have appeared recently. Notably, a downgrade to sell was issued late 2025, indicating some divergence among analysts.
Consumer Opinions
Consumers generally express a mix of admiration and critique regarding The Estée Lauder Companies Inc., reflecting a balanced view of its products and services.
| Positive Reviews | Negative Reviews |
|---|---|
| High-quality, effective skincare products with visible results. | Premium pricing can be a barrier for some customers. |
| Elegant packaging and luxurious feel enhance user experience. | Limited shade ranges in some makeup lines noted. |
| Consistent product innovation keeps the brand fresh. | Customer service response times sometimes slow. |
Overall, consumers praise Estée Lauder for its product quality and innovation, while concerns focus mainly on pricing and occasional service delays. This feedback highlights the brand’s strong market position but also areas to improve customer inclusivity and support.
Risk Analysis
Below is a summary table outlining key risks for The Estée Lauder Companies Inc., with their likelihood and potential impact:
| Category | Description | Probability | Impact |
|---|---|---|---|
| Financial Health | Negative net margin (-7.93%) and ROE (-29.31%) signal ongoing profitability challenges. | High | High |
| Leverage & Debt | Elevated debt-to-equity ratio (2.44) and negative interest coverage (-1.57) increase risk. | Medium | High |
| Market Volatility | Beta of 1.146 suggests moderate sensitivity to market swings affecting stock price. | Medium | Medium |
| Valuation | Unfavorable price-to-book ratio (7.53) indicates possible overvaluation concerns. | Medium | Medium |
| Operational Risks | Average Piotroski score (5) reflects moderate operational and financial strength. | Medium | Medium |
The most pressing risks come from persistent profitability issues and high leverage, despite a safe Altman Z-score (3.23) suggesting low bankruptcy risk. Investors should watch for improvements in earnings and debt management before increasing exposure.
Should You Buy The Estée Lauder Companies Inc.?
The Estée Lauder Companies Inc. appears to be experiencing declining profitability and a deteriorating competitive moat, suggesting a profile of value destruction and weakening operational efficiency. Despite a manageable debt leverage, the overall rating of D+ reflects significant financial challenges and an average Piotroski score, indicating cautious investor sentiment.
Strength & Efficiency Pillars
The Estée Lauder Companies Inc. exhibits a robust financial safety net, reflected in an Altman Z-Score of 3.23, situating it comfortably in the safe zone against bankruptcy risk. Its Piotroski Score of 5 indicates average financial health, showing moderate operational strength. While the company’s gross margin of 73.89% is notably favorable, indicating strong profitability at the top line, other profitability metrics such as ROIC stand at 6.44%, slightly below the WACC of 8.17%, suggesting the company is currently not a value creator. The dividend yield of 2.12% adds a modest income appeal.
Weaknesses and Drawbacks
Multiple red flags emerge in valuation and leverage metrics. The price-to-book ratio is elevated at 7.53, signaling a premium valuation that may limit upside potential. The company’s debt-to-equity ratio is 2.44, a high leverage figure that raises financial risk concerns, especially given a negative interest coverage ratio of -1.57, indicating insufficient operating income to cover interest expenses. Profitability is weak with a net margin of -7.93% and ROE at -29.31%, reflecting operational challenges. The stock has experienced a significant 20.92% price decline overall, underscoring bearish market sentiment despite recent buyer dominance.
Our Verdict about The Estée Lauder Companies Inc.
The long-term fundamental profile appears unfavorable due to persistent profitability and leverage weaknesses combined with value destruction as ROIC trails WACC. Nevertheless, recent technical indicators show a strongly buyer-dominant environment with a 70.01% buyer volume share since late 2025, suggesting potential positive momentum. Despite long-term fundamental challenges, this recent market pressure reversal may suggest a wait-and-see approach to identify a more opportune entry point.
Disclaimer: This content is for informational purposes only and does not constitute financial, investment, or other professional advice. Investing in financial markets involves a significant risk of loss, and past performance is not indicative of future results.
Additional Resources
- Is The Estee Lauder Companies (EL) Outperforming Other Consumer Staples Stocks This Year? – Yahoo Finance (Jan 22, 2026)
- The Estee Lauder Companies Inc. $EL Holdings Increased by Universal Beteiligungs und Servicegesellschaft mbH – MarketBeat (Jan 23, 2026)
- The Estée Lauder Companies Reports Fiscal 2026 First Quarter Results – The Estée Lauder Companies (Oct 30, 2025)
- Estée Lauder faces a lawsuit over alleged tech secrets theft (EL:NYSE) – Seeking Alpha (Jan 20, 2026)
- Estee Lauder (EL): TD Cowen Raises Price Target to $130 | EL Sto – GuruFocus (Jan 21, 2026)
For more information about The Estée Lauder Companies Inc., please visit the official website: elcompanies.com