Home > Analyses > Healthcare > The Cooper Companies, Inc.
The Cooper Companies, Inc. transforms vision and women’s health care through cutting-edge medical instruments and supplies that touch millions of lives worldwide. As a prominent player in the healthcare sector, Cooper excels with its CooperVision contact lenses and CooperSurgical women’s health solutions, known for innovation and quality. With a global footprint and a strong reputation, the pressing question for investors is whether its current fundamentals support sustained growth and justify its market valuation in an evolving medical landscape.

Table of contents
Business Model & Company Overview
The Cooper Companies, Inc., founded in 1958 and headquartered in San Ramon, California, stands as a leading player in the medical instruments and supplies industry. Its core mission revolves around a cohesive ecosystem of eye care and women’s health solutions through its two main segments: CooperVision, specializing in a broad range of contact lenses addressing diverse vision needs, and CooperSurgical, offering advanced medical devices and fertility products globally.
The company’s revenue engine balances product sales and recurring consumable supplies, creating steady value across the Americas, Europe, Middle East, Africa, and Asia Pacific. This strategic presence supports a resilient global footprint. With 16,000 employees, Cooper maintains a robust economic moat by integrating innovative technologies into essential healthcare segments, shaping the future of vision and women’s health care worldwide.
Financial Performance & Fundamental Metrics
This section analyzes The Cooper Companies, Inc.’s income statement, key financial ratios, and dividend payout policy to assess its financial health and investment potential.
Income Statement
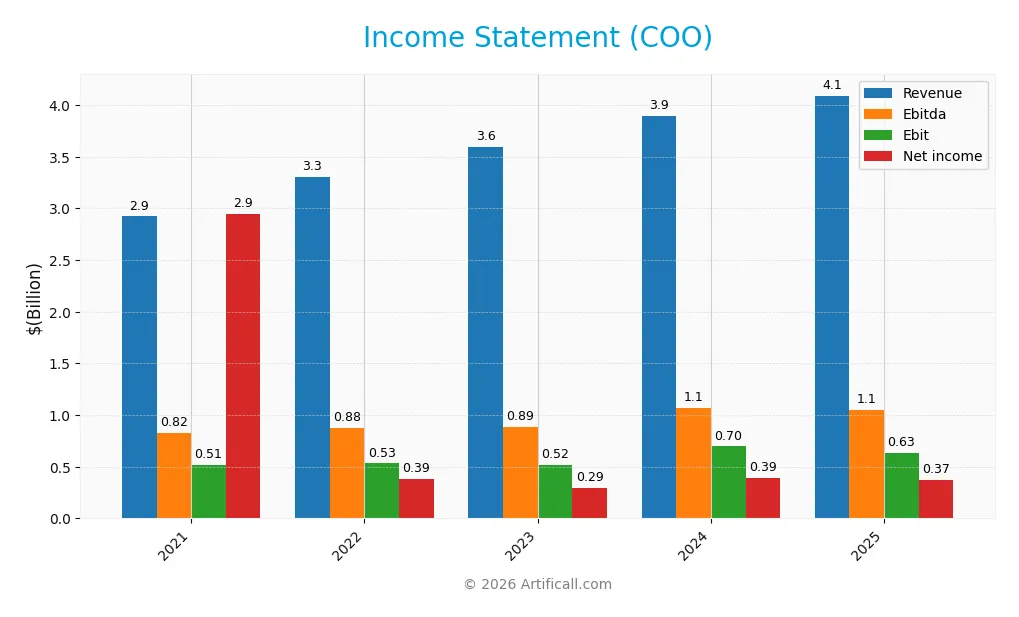
The table below summarizes The Cooper Companies, Inc.’s key income statement figures for fiscal years 2021 through 2025, providing a clear view of revenue, expenses, and profitability metrics.
| 2021 | 2022 | 2023 | 2024 | 2025 | |
|---|---|---|---|---|---|
| Revenue | 2.92B | 3.31B | 3.59B | 3.90B | 4.09B |
| Cost of Revenue | 967M | 1.17B | 1.24B | 1.30B | 1.61B |
| Operating Expenses | 1.45B | 1.63B | 1.82B | 1.89B | 1.80B |
| Gross Profit | 1.96B | 2.14B | 2.36B | 2.60B | 2.48B |
| EBITDA | 824M | 879M | 886M | 1.07B | 1.05B |
| EBIT | 515M | 533M | 518M | 697M | 630M |
| Interest Expense | 23M | 57M | 105M | 114M | 100M |
| Net Income | 2.94B | 386M | 294M | 392M | 375M |
| EPS | 59.73 | 1.96 | 1.49 | 1.97 | 1.87 |
| Filing Date | 2021-12-10 | 2022-12-09 | 2023-12-08 | 2024-12-06 | 2025-12-05 |
Income Statement Evolution
From 2021 to 2025, The Cooper Companies, Inc. saw revenue grow by 40%, reaching $4.09B in 2025, while net income declined sharply by 87% to $375M. The gross margin remained favorable at 60.7%, but margins have generally compressed, with net margin falling to 9.16%. EBITDA and EBIT margins also showed some deterioration, indicating margin pressure despite revenue growth.
Is the Income Statement Favorable?
The 2025 income statement reveals mixed fundamentals. Revenue increased modestly by 5% year-over-year, yet gross profit and EBIT declined by 4.3% and 9.5%, respectively, signaling rising costs or pricing challenges. Net income and EPS also fell, reflecting margin contraction. While some expense ratios remain favorable, the overall evaluation rates the income statement as unfavorable due to declining profitability and margin erosion.
Financial Ratios
The table below presents key financial ratios for The Cooper Companies, Inc. (COO) over recent fiscal years, offering a snapshot of profitability, liquidity, valuation, and leverage:
| Ratios | 2021 | 2022 | 2023 | 2024 | 2025 |
|---|---|---|---|---|---|
| Net Margin | 101% | 12% | 8.2% | 10.1% | 9.2% |
| ROE | 42% | 5.4% | 3.9% | 4.9% | 4.6% |
| ROIC | 5.6% | 3.9% | 3.5% | 4.2% | 4.0% |
| P/E | 1.8 | 35.0 | 52.5 | 53.1 | 37.3 |
| P/B | 0.75 | 1.88 | 2.04 | 2.58 | 1.70 |
| Current Ratio | 2.0 | 1.2 | 1.8 | 1.9 | 1.9 |
| Quick Ratio | 1.2 | 0.71 | 1.0 | 1.1 | 1.1 |
| D/E | 0.21 | 0.39 | 0.34 | 0.32 | 0.34 |
| Debt-to-Assets | 15% | 24% | 22% | 21% | 22% |
| Interest Coverage | 21.9 | 8.9 | 5.1 | 6.2 | 6.8 |
| Asset Turnover | 0.30 | 0.29 | 0.31 | 0.32 | 0.33 |
| Fixed Asset Turnover | 2.17 | 2.31 | 2.20 | 2.09 | 1.97 |
| Dividend Yield | 0.058% | 0.022% | 0.019% | 0 | 0 |
Notes:
- Net Margin for 2021 appears anomalously high at 101%, likely reflecting a data anomaly.
- Dividend Yield is negligible or zero in recent years, reflecting minimal or no dividend payments.
- Debt-to-Equity (D/E) and Debt-to-Assets ratios indicate moderate leverage with slight fluctuations.
- Liquidity ratios (Current and Quick) remain above 1, suggesting sufficient short-term asset coverage.
Evolution of Financial Ratios
Over the analyzed period, The Cooper Companies, Inc. (COO) saw a decline in Return on Equity (ROE), dropping to 4.55% in 2025, indicating reduced profitability. The Current Ratio remained stable and favorable around 1.89, reflecting solid liquidity. The Debt-to-Equity Ratio improved slightly to 0.34 by 2025, suggesting a moderate leverage position. Profitability margins showed some contraction, with net margin down to 9.16%.
Are the Financial Ratios Favorable?
In 2025, COO’s liquidity ratios (Current and Quick Ratios) were favorable, supporting short-term financial health. Leverage metrics, including Debt-to-Equity and Debt-to-Assets, were also favorable, with interest coverage at 6.3, indicating adequate debt servicing capacity. However, profitability measures such as ROE, Return on Invested Capital (ROIC), and Price-to-Earnings (PE) ratio were unfavorable, suggesting challenges in generating returns. Asset turnover appeared unfavorable, while dividend yield was nil. Overall, the company’s financial ratios are slightly favorable.
Shareholder Return Policy
The Cooper Companies, Inc. does not currently pay dividends, as reflected by a zero dividend payout ratio and yield. This suggests a focus on reinvestment or growth strategies, with no reported share buyback programs either.
This absence of direct shareholder distributions indicates a possible prioritization of capital allocation toward operations or expansion. Such a policy may support sustainable long-term value creation if free cash flow and profitability remain strong.
Score analysis
The following radar chart illustrates the company’s key financial scores across several valuation and performance metrics:
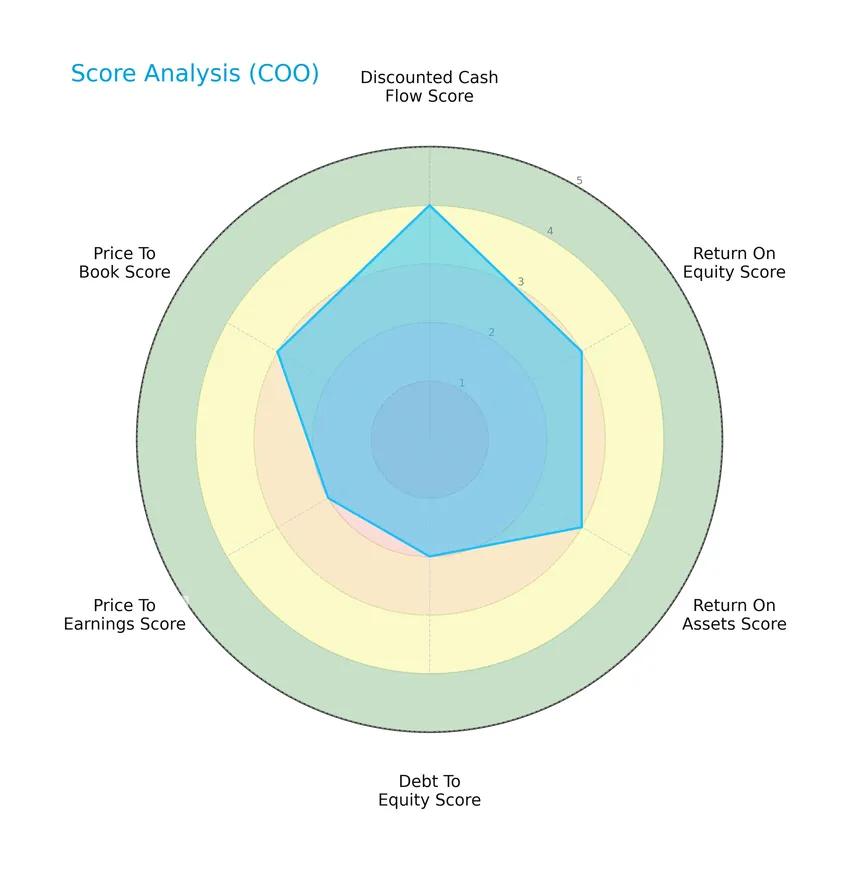
The discounted cash flow score is favorable at 4, indicating good intrinsic value assessment. Return on equity and return on assets both score moderately at 3, reflecting average profitability. Debt to equity and price to earnings scores are also moderate at 2, suggesting manageable leverage and valuation. Price to book score remains moderate at 3, consistent with the other performance indicators.
Analysis of the company’s bankruptcy risk
The Altman Z-Score places the company in the safe zone, indicating a low likelihood of bankruptcy and financial distress:

Is the company in good financial health?
The Piotroski Score diagram provides insight into the company’s financial strength and operational efficiency:

With a Piotroski Score of 7 categorized as strong, the company demonstrates solid financial health, balancing profitability, leverage, and liquidity effectively according to this metric.
Competitive Landscape & Sector Positioning
This sector analysis will explore The Cooper Companies, Inc.’s strategic positioning, revenue segments, key products, main competitors, and overall market dynamics. I will assess whether the company holds a competitive advantage compared to its peers in the healthcare instruments and supplies industry.
Strategic Positioning
The Cooper Companies, Inc. maintains a diversified product portfolio with two main segments: CooperVision, focusing on contact lenses, and CooperSurgical, centered on family and women’s health care products. Geographically, the company generates substantial revenue from the United States (2.73B) and Europe (2.38B), complemented by a growing presence in other global markets (785M).
Revenue by Segment
This pie chart illustrates The Cooper Companies, Inc.’s revenue distribution by segment for the fiscal year 2025, highlighting contributions from Coopersurgical and Coopervision.
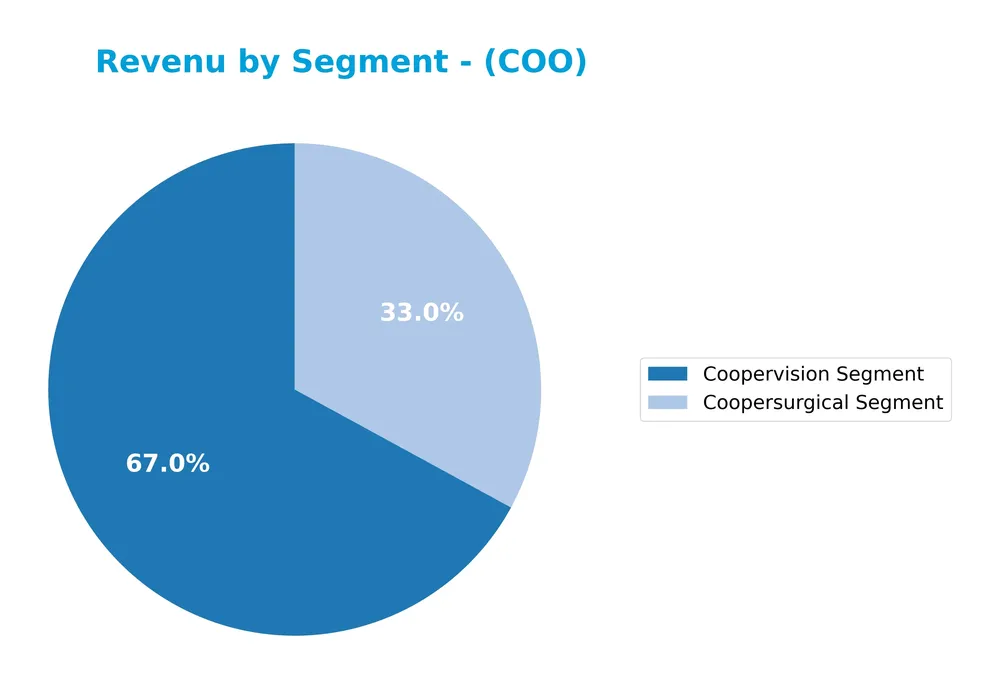
In 2025, Coopervision remains the dominant revenue driver with $2.74B, showing steady growth over recent years. Coopersurgical also demonstrates consistent expansion, reaching $1.35B, reflecting solid performance in surgical products. The business maintains a balanced but Coopervision-focused portfolio, with no drastic concentration risk but a clear reliance on the vision care segment for growth acceleration.
Key Products & Brands
The Cooper Companies, Inc. operates two main segments with diverse medical and vision care products:
| Product | Description |
|---|---|
| CooperVision Segment | Offers spherical lenses correcting near and farsightedness, and toric and multifocal lenses addressing astigmatism, presbyopia, myopia, ocular dryness, and eye fatigue worldwide. |
| CooperSurgical Segment | Focuses on family and women’s health care, providing medical devices, fertility products, genomics, diagnostics, and contraception, including surgical and office products like PARAGARD and fertility consumables. |
The Cooper Companies generate revenue primarily from CooperVision’s vision correction lenses and CooperSurgical’s family health care products, reflecting steady growth in both segments.
Main Competitors
There are 8 competitors in the Healthcare Medical – Instruments & Supplies industry; below are the top 8 leaders by market capitalization:
| Competitor | Market Cap. |
|---|---|
| Intuitive Surgical, Inc. | 201B |
| Becton, Dickinson and Company | 56B |
| ResMed Inc. | 36B |
| West Pharmaceutical Services, Inc. | 20B |
| Hologic, Inc. | 16.6B |
| The Cooper Companies, Inc. | 16.1B |
| Baxter International Inc. | 10B |
| AptarGroup, Inc. | 8.1B |
The Cooper Companies, Inc. ranks 6th among its 8 competitors with a market cap representing 8.05% of the leader, Intuitive Surgical, Inc. It stands below both the average market cap of the top 10 peers (45.4B) and the sector median (18.3B). The company is positioned 2.84% below the next competitor above, indicating a narrow gap with Hologic, Inc.
Comparisons with competitors
Check out how we compare the company to its competitors:
Does COO have a competitive advantage?
The Cooper Companies, Inc. does not currently present a competitive advantage, as its return on invested capital (ROIC) is below its weighted average cost of capital (WACC), indicating value destruction and declining profitability. The company’s global moat status is very unfavorable, reflecting challenges in sustaining excess returns and efficient capital use.
Looking ahead, Cooper operates in expanding markets including contact lenses and family and women’s health care, offering diverse products such as surgical devices, fertility and genomics solutions across multiple regions. These areas may provide future growth opportunities despite recent unfavorable income and profitability trends.
SWOT Analysis
This SWOT analysis highlights The Cooper Companies, Inc.’s key internal and external factors to guide investment decisions.
Strengths
- strong market presence in medical instruments
- diverse product segments in vision and women’s health
- favorable gross margin of 60.67%
Weaknesses
- declining net income over 5 years
- unfavorable ROIC below WACC indicating value destruction
- negative EPS growth trend
Opportunities
- expanding markets in emerging regions
- growth potential in fertility and genomics sectors
- innovation in eye care technology
Threats
- intense competition in healthcare supplies
- regulatory and reimbursement risks
- sensitivity to economic cycles affecting elective procedures
Overall, the company benefits from solid market positions and product diversity but faces challenges from declining profitability and value destruction. Strategic focus on innovation and geographic expansion is crucial to mitigate risks and restore growth.
Stock Price Action Analysis
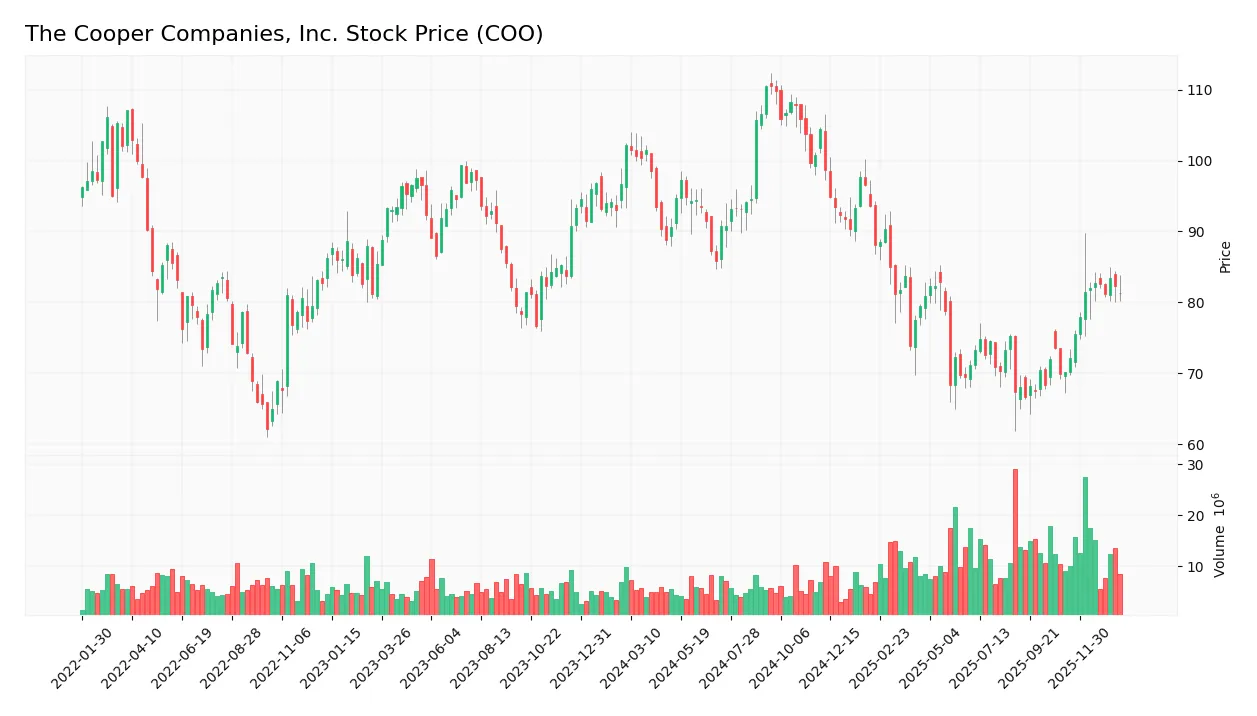
The weekly stock chart of The Cooper Companies, Inc. (COO) highlights recent price fluctuations and trend dynamics over the past 12 months:
Trend Analysis
Over the past 12 months, COO stock price decreased by 20.45%, indicating a bearish trend. The decline shows acceleration with a high volatility of 12.43 in standard deviation. The stock reached a high of 110.53 and a low of 66.68, confirming significant downward momentum during this period.
Volume Analysis
In the last three months, trading volume for COO has been increasing and strongly buyer-dominant, with buyers accounting for 77.32% of volume. This suggests heightened investor interest and positive market participation despite the overall bearish price trend.
Target Prices
Analysts present a clear consensus on The Cooper Companies, Inc., reflecting confidence in its growth potential.
| Target High | Target Low | Consensus |
|---|---|---|
| 100 | 73 | 90.88 |
The target prices suggest a positive outlook, with expectations for the stock to trade between $73 and $100, averaging near $91, indicating moderate upside potential.

Don’t Let Luck Decide Your Entry Point
Optimize your entry points with our advanced ProRealTime indicators. You’ll get efficient buy signals with precise price targets for maximum performance. Start outperforming now!
Analyst & Consumer Opinions
This section examines recent analyst ratings and consumer feedback regarding The Cooper Companies, Inc. (COO).
Stock Grades
The following table presents the latest verified stock grades from leading financial institutions for The Cooper Companies, Inc.:
| Grading Company | Action | New Grade | Date |
|---|---|---|---|
| Citigroup | Maintain | Neutral | 2025-12-08 |
| Morgan Stanley | Maintain | Equal Weight | 2025-12-08 |
| Goldman Sachs | Maintain | Sell | 2025-12-08 |
| Wells Fargo | Maintain | Equal Weight | 2025-12-05 |
| Baird | Maintain | Outperform | 2025-12-05 |
| Needham | Maintain | Buy | 2025-12-05 |
| JP Morgan | Maintain | Neutral | 2025-12-05 |
| Stifel | Maintain | Buy | 2025-12-05 |
| Piper Sandler | Maintain | Overweight | 2025-12-05 |
| Mizuho | Maintain | Outperform | 2025-12-05 |
The consensus among these analysts leans toward a positive outlook, with a majority maintaining Buy, Outperform, or Overweight ratings. However, some notable Neutral and a Sell rating from Goldman Sachs indicate a degree of caution within the market.
Consumer Opinions
Consumer sentiment around The Cooper Companies, Inc. (COO) reflects a mix of appreciation for product quality and concerns about customer service.
| Positive Reviews | Negative Reviews |
|---|---|
| “High-quality medical devices that have improved my vision significantly.” | “Customer support response times can be slow and frustrating.” |
| “Reliable products with consistent performance in eye care solutions.” | “Pricing seems a bit steep compared to competitors.” |
| “Innovative technology that stays ahead in the optical market.” | “Occasional delays in order fulfillment have caused inconvenience.” |
Overall, consumers praise Cooper Companies for their advanced, reliable eye care products. However, issues with customer service responsiveness and pricing are common points of criticism.
Risk Analysis
Below is a summary table outlining key risk categories, their descriptions, likelihood, and potential impact on The Cooper Companies, Inc.:
| Category | Description | Probability | Impact |
|---|---|---|---|
| Market Volatility | Stock price fluctuations influenced by sector trends and economic cycles | Medium | Medium |
| Financial Performance | Unfavorable ROE (4.55%) and ROIC (3.98%) may pressure profitability and valuation | Medium | High |
| Competitive Pressure | Intense competition in medical instruments and contact lens markets impacts market share | Medium | Medium |
| Regulatory Risk | Changes in healthcare regulations could affect product approvals and sales | Low | High |
| Innovation Risk | Failure to innovate new products may reduce competitiveness in fast-evolving healthcare sector | Medium | Medium |
| Liquidity Risk | Current and quick ratios are favorable but depend on effective cash management | Low | Low |
| Dividend Policy | No dividend payout could limit appeal for income-focused investors | High | Low |
The most significant risks for COO stem from its moderate financial returns and high valuation multiples, which might pressure its stock if growth slows. However, its strong Altman Z-Score of 3.77 places it safely away from bankruptcy concerns, and a Piotroski Score of 7 suggests solid financial health. Investors should watch sector competition and regulatory changes closely.
Should You Buy The Cooper Companies, Inc.?
The Cooper Companies, Inc. appears to be a moderately profitable firm with a deteriorating competitive moat suggesting value erosion. Despite a manageable leverage profile and a safe Altman Z-Score, its overall B rating indicates a cautiously favorable investment case.
Strength & Efficiency Pillars
The Cooper Companies, Inc. exhibits a sound financial foundation underscored by a safe Altman Z-score of 3.77, indicating low bankruptcy risk, and a strong Piotroski score of 7, reflecting robust financial health. Its gross margin stands at a favorable 60.67%, supporting operational efficiency, while its interest expense ratio remains low at 2.44%. The company maintains a healthy balance sheet with a debt-to-equity ratio of 0.34 and solid liquidity evidenced by a current ratio of 1.89. However, profitability metrics such as ROE (4.55%) and ROIC (3.98%) lag below the WACC of 7.86%, signaling that COO is currently not creating value for shareholders.
Weaknesses and Drawbacks
The investment case is challenged by an elevated P/E ratio of 37.3, suggesting the stock is priced at a premium, which may limit upside potential. The company’s net margin growth is negative over recent periods, with net margin shrinking by 9.04% year-over-year and a substantial net income decline of 87.27% over the past five years, raising concerns about earnings quality. Asset turnover is weak at 0.33, indicating inefficiencies in asset utilization. Additionally, the absence of dividend yield and a bearish overall stock trend, with a 20.45% price decline, may weigh on investor sentiment despite recent positive buyer dominance.
Our Verdict about The Cooper Companies, Inc.
The fundamental profile of The Cooper Companies, Inc. appears unfavorable due to declining profitability and value destruction, as highlighted by its ROIC underperforming WACC. Nonetheless, the recent period shows strong buyer dominance with a 77.32% buyer volume share and an improving short-term trend, which might suggest emerging market interest. Despite these signals, the overall bearish trend and premium valuation imply that investors could consider a cautious, wait-and-see approach before increasing exposure.
Disclaimer: This content is for informational purposes only and does not constitute financial, investment, or other professional advice. Investing in financial markets involves a significant risk of loss, and past performance is not indicative of future results.
Additional Resources
- What you need to know ahead of the Cooper Companies’ earnings release – MSN (Jan 23, 2026)
- Rakuten Investment Management Inc. Acquires New Position in The Cooper Companies, Inc. $COO – MarketBeat (Jan 22, 2026)
- What to Be Aware of Before The Cooper Companies Announce Their Earnings – Bitget (Jan 23, 2026)
- Is It Too Late To Consider Buying The Cooper Companies, Inc. (NASDAQ:COO)? – simplywall.st (Jan 06, 2026)
- The Cooper Companies, Inc. $COO Shares Acquired by Massachusetts Financial Services Co. MA – MarketBeat (Jan 20, 2026)
For more information about The Cooper Companies, Inc., please visit the official website: coopercos.com