Home > Analyses > Consumer Defensive > The Coca-Cola Company
The Coca-Cola Company defines refreshment for billions worldwide, shaping daily moments with its iconic beverages. Its portfolio spans from classic Coca-Cola to innovative plant-based drinks, reflecting a relentless drive for market leadership and quality. Trusted for over a century, the company blends tradition with cutting-edge product development. As competition intensifies and consumer tastes evolve, I ask: does Coca-Cola’s financial strength and strategic positioning still justify its premium valuation?
Table of contents
Business Model & Company Overview
The Coca-Cola Company, founded in 1886 and headquartered in Atlanta, GA, dominates the non-alcoholic beverages sector with a vast portfolio. It crafts a cohesive ecosystem of sparkling drinks, juices, teas, and plant-based beverages. This extensive lineup includes iconic brands like Coca-Cola, Sprite, and Minute Maid, supported by a global network of bottlers and distributors. The company’s scale and brand depth secure its leadership in consumer defensive staples worldwide.
Coca-Cola’s revenue engine balances product sales between concentrates, syrups, and finished beverages, fueling stable cash flow. It leverages recurring demand through retail and fountain channels across the Americas, Europe, and Asia. I see its economic moat rooted in brand power and distribution scale, which fortify its pricing power and shape the beverage industry’s future landscape.
Financial Performance & Fundamental Metrics
I will analyze The Coca-Cola Company’s income statement, key financial ratios, and dividend payout policy to assess its financial health and shareholder value.
Income Statement
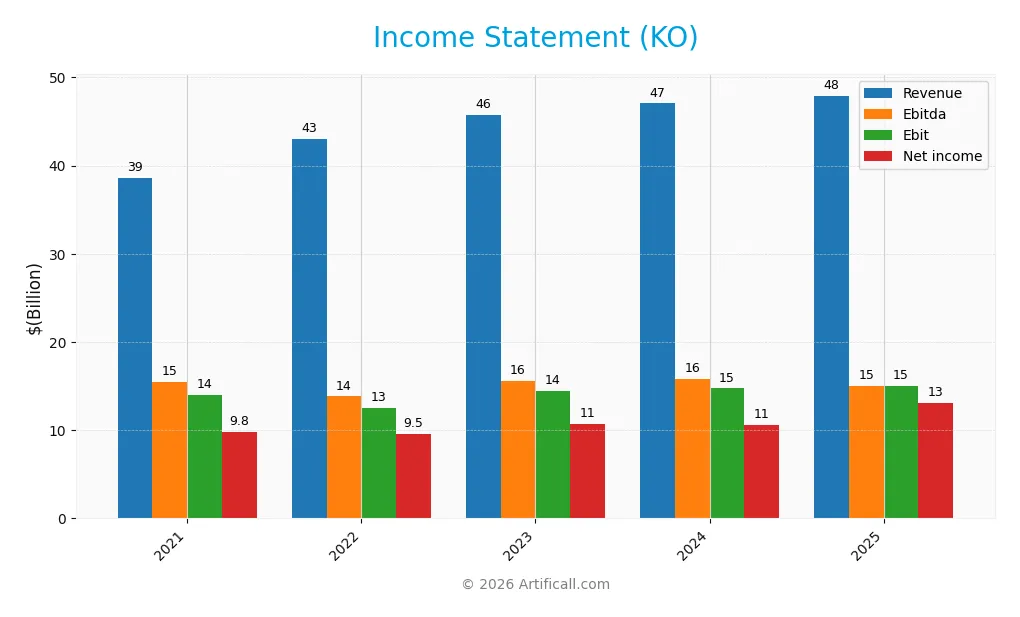
Below is The Coca-Cola Company’s income statement summary for the fiscal years 2021 through 2025, showing key profit and expense metrics in USD.
| 2021 | 2022 | 2023 | 2024 | 2025 | |
|---|---|---|---|---|---|
| Revenue | 38.7B | 43.0B | 45.8B | 47.1B | 47.9B |
| Cost of Revenue | 15.4B | 18.0B | 18.5B | 18.3B | 18.4B |
| Operating Expenses | 13.0B | 14.1B | 15.9B | 18.7B | 15.8B |
| Gross Profit | 23.3B | 25.0B | 27.2B | 28.7B | 29.5B |
| EBITDA | 15.5B | 13.8B | 15.6B | 15.8B | 18.7B |
| EBIT | 14.0B | 12.6B | 14.5B | 14.7B | 17.7B |
| Interest Expense | 1.6B | 0.9B | 1.5B | 1.7B | 1.7B |
| Net Income | 9.8B | 9.5B | 10.7B | 10.6B | 13.1B |
| EPS | 2.26 | 2.20 | 2.48 | 2.47 | 3.05 |
| Filing Date | 2022-02-22 | 2023-02-21 | 2024-02-20 | 2025-02-20 | 2026-02-20 |
Income Statement Evolution
From 2021 to 2025, Coca-Cola’s revenue rose 24% to $48B, with net income gaining 34% to $13.1B. Margins improved steadily; the gross margin reached 61.6%, and net margin climbed to 27.3%. Operating efficiency strengthened as EBIT surged nearly 20% in the last year, reflecting disciplined cost control despite modest revenue growth slowing to under 2%.
Is the Income Statement Favorable?
In 2025, fundamentals appear favorable with a robust EBIT margin of 36.8% and a net margin expanding by 21%. Interest expense remains manageable at 3.45% of revenue. Earnings per share jumped 24%, signaling profitable capital allocation. However, revenue growth’s deceleration to 1.9% merits caution. Overall, profitability and margin trends demonstrate strong operational resilience.
Financial Ratios
The following table summarizes key financial ratios for The Coca-Cola Company from 2021 through 2025, highlighting profitability, liquidity, leverage, valuation, and efficiency metrics:
| Ratios | 2021 | 2022 | 2023 | 2024 | 2025 |
|---|---|---|---|---|---|
| Net Margin | 25% | 22% | 23% | 23% | 27% |
| ROE | 42% | 40% | 41% | 43% | 41% |
| ROIC | 10% | 12% | 12% | 10% | 13% |
| P/E | 26.1 | 28.9 | 23.8 | 25.2 | 23.0 |
| P/B | 11.1 | 11.4 | 9.8 | 10.8 | 9.4 |
| Current Ratio | 1.13 | 1.15 | 1.13 | 1.03 | 1.46 |
| Quick Ratio | 0.96 | 0.93 | 0.95 | 0.84 | 1.25 |
| D/E | 1.92 | 1.68 | 1.67 | 1.84 | 1.41 |
| Debt-to-Assets | 47% | 44% | 44% | 45% | 43% |
| Interest Coverage | 6.45 | 12.37 | 7.41 | 6.03 | 8.32 |
| Asset Turnover | 0.41 | 0.46 | 0.47 | 0.47 | 0.46 |
| Fixed Asset Turnover | 3.90 | 4.37 | 4.95 | 4.10 | 4.99 |
| Dividend Yield | 2.84% | 2.77% | 3.12% | 3.12% | 2.92% |
Evolution of Financial Ratios
Return on Equity (ROE) remained robust, fluctuating slightly but ending at a strong 40.74% in 2025. The Current Ratio improved moderately from around 1.03 in 2024 to 1.46 in 2025, indicating better liquidity. Debt-to-Equity Ratio showed a declining trend from about 1.92 in 2021 to 1.41 in 2025, suggesting reduced leverage. Profitability margins notably increased, reflecting enhanced operational efficiency.
Are the Financial Ratios Favorable?
In 2025, profitability ratios such as net margin (27.34%) and ROE (40.74%) are favorable, signaling strong earnings performance. Liquidity is neutral to positive with a Current Ratio of 1.46 and Quick Ratio of 1.25. Leverage presents some concern, as the Debt-to-Equity Ratio at 1.41 is unfavorable. Market valuation ratios show mixed signals: price-to-book is unfavorable, while price-to-earnings is neutral. Overall, more than half of the key ratios rate as favorable.
Shareholder Return Policy
The Coca-Cola Company maintains a dividend payout ratio around 67%, with a stable dividend per share rising from $1.68 in 2021 to $2.04 in 2025. The annual dividend yield hovers near 2.9%, supported by free cash flow coverage of approximately 68%, indicating moderate distribution sustainability.
The company also engages in share buybacks. While its payout ratio is slightly below 70%, careful monitoring is warranted due to leverage levels above 1.4 debt-to-equity. Overall, the current policy balances shareholder returns with capital allocation, supporting sustainable long-term value creation.
Score analysis
The following radar chart displays six key financial scores that assess the company’s valuation and profitability metrics:
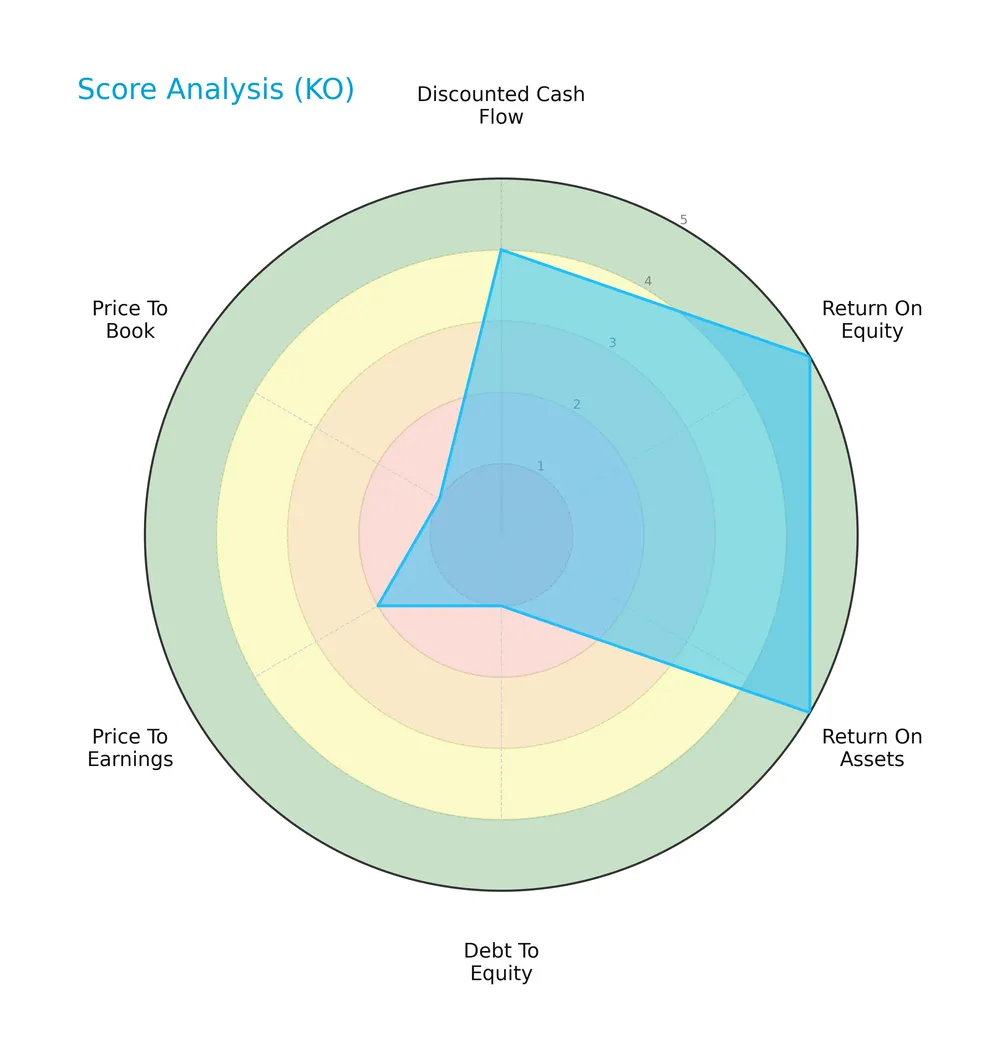
The Coca-Cola Company scores very favorably on return on equity (5) and return on assets (5), indicating strong profitability. However, debt to equity (1), price to earnings (2), and price to book (1) scores suggest valuation concerns. The discounted cash flow score is moderate at 3.
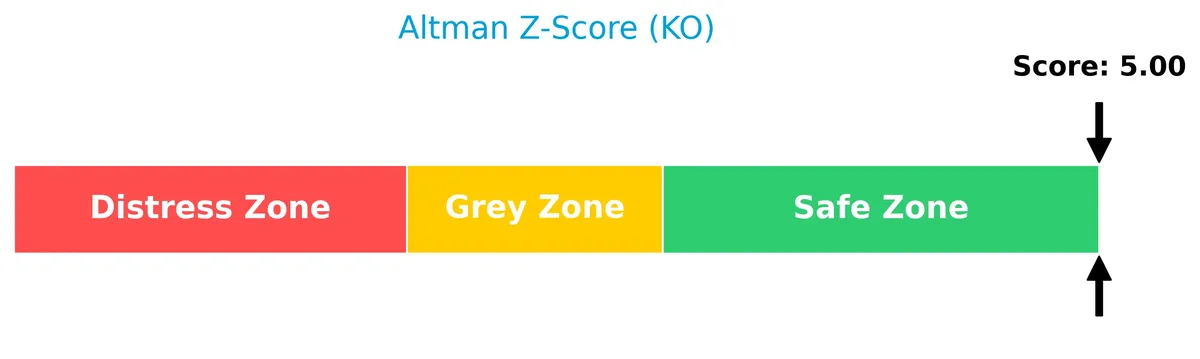
Analysis of the company’s bankruptcy risk
The Altman Z-Score indicates that The Coca-Cola Company is well within the safe zone, signaling a low risk of bankruptcy:
Is the company in good financial health?
The Piotroski Score diagram highlights the company’s financial strength and operational efficiency:

With a Piotroski Score of 7, The Coca-Cola Company demonstrates strong financial health. This level reflects solid profitability and sound financial management, though it stops short of the highest “very strong” category.
Competitive Landscape & Sector Positioning
This analysis examines The Coca-Cola Company’s strategic positioning, revenue segmentation, key products, and main competitors. I will assess whether the company maintains a competitive advantage within the non-alcoholic beverage sector.
Strategic Positioning
The Coca-Cola Company operates a diversified product portfolio spanning sparkling drinks, water, coffee, tea, juice, dairy, and plant-based beverages. Its geographic exposure is broad, with significant revenues from North America, Europe, Latin America, and the Pacific region, reflecting a global footprint and multi-segment strategy.
Revenue by Segment
This pie chart illustrates The Coca-Cola Company’s revenue breakdown by segment for the fiscal year 2025, highlighting contributions from key business areas.
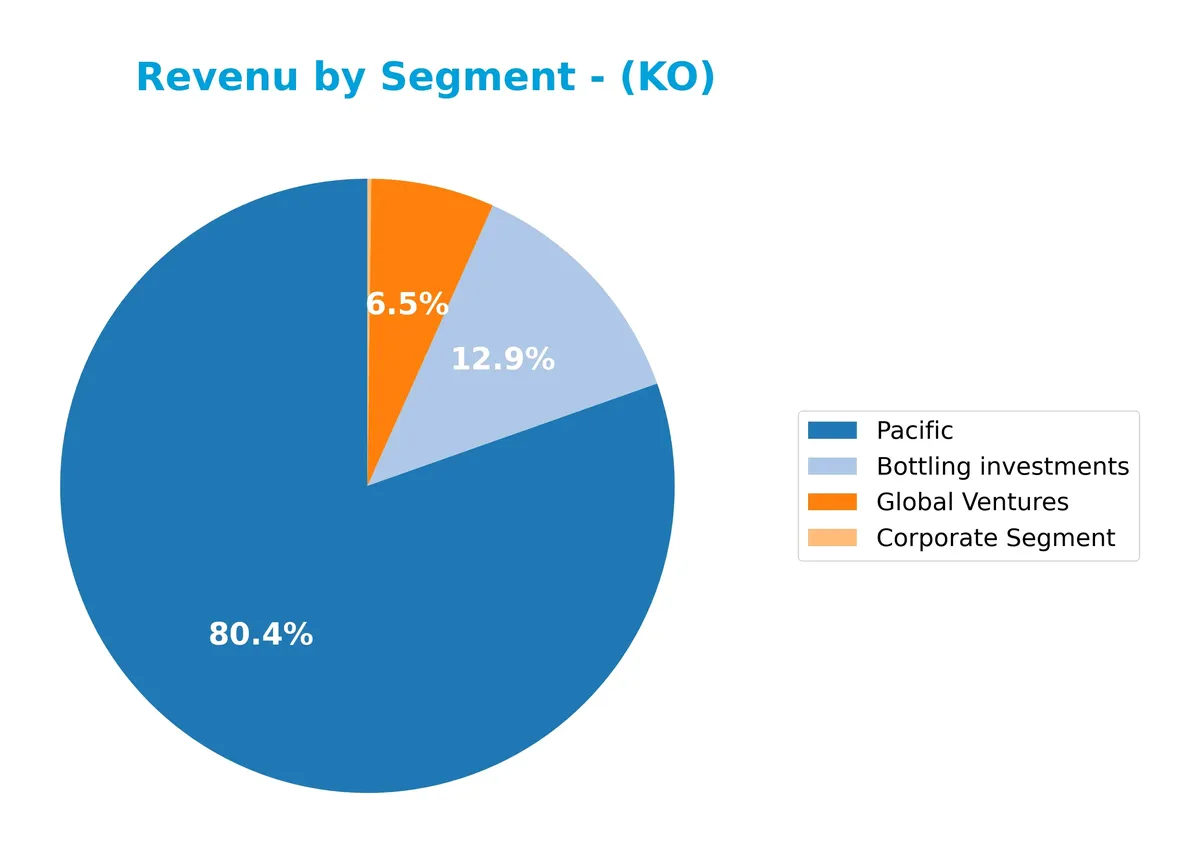
In 2025, the Pacific segment dominates revenue with $31.6B, reflecting a slight contraction from prior years. Bottling investments contribute $5.7B, showing a continued but reduced share. The absence of other segments in 2025’s data suggests a more concentrated revenue base, raising potential concentration risk despite steady core operations. Historical fluctuations in bottling revenue reflect shifting capital deployment and market dynamics.
Key Products & Brands
Below is an overview of The Coca-Cola Company’s key products and brands with concise descriptions:
| Product | Description |
|---|---|
| Sparkling Soft Drinks | Includes Coca-Cola, Diet Coke, Coca-Cola Zero Sugar, Cherry Coke, Fanta, and Sprite variants. |
| Water and Sports Drinks | Brands such as Dasani, Topo Chico, Powerade, and BODYARMOR offering hydration and electrolyte options. |
| Coffee and Tea | Coffee and tea beverages including Costa Coffee, Georgia, FUZE TEA, and Ayataka. |
| Juice and Plant-Based Beverages | Simply Orange, Minute Maid, Del Valle, AdeS, and plant-based dairy alternatives like fairlife. |
| Beverage Concentrates and Syrups | Supplies concentrates and fountain syrups to restaurants and retailers worldwide. |
| Emerging and Global Ventures | Includes brands like innocent, glacéau smartwater, glacéau vitaminwater, and Gold Peak. |
The Coca-Cola Company maintains a broad portfolio spanning sparkling drinks, hydration, coffee, and plant-based beverages. Its global brand presence and diverse product mix address varied consumer preferences in nonalcoholic beverages.
Main Competitors
There are 7 competitors in total, with the table below listing the top 7 leaders by market capitalization:
| Competitor | Market Cap. |
|---|---|
| The Coca-Cola Company | 297B |
| PepsiCo, Inc. | 194B |
| Monster Beverage Corporation | 74B |
| Coca-Cola Europacific Partners PLC | 42B |
| Keurig Dr Pepper Inc. | 38B |
| Coca-Cola Consolidated, Inc. | 13B |
| Celsius Holdings, Inc. | 12B |
The Coca-Cola Company ranks first among its 7 competitors and exceeds the average market cap of the top 10 by a wide margin. It is also well above the sector median market cap. The company holds a 15% larger market cap than the second-largest competitor, PepsiCo, highlighting a significant lead.
Comparisons with competitors
Check out how we compare the company to its competitors:
Does KO have a competitive advantage?
The Coca-Cola Company demonstrates a clear competitive advantage, evidenced by a very favorable moat status and a ROIC exceeding WACC by nearly 8%. The firm shows growing ROIC, indicating efficient capital use and sustained value creation amid evolving market conditions.
Looking ahead, Coca-Cola’s expansive portfolio across beverages and strong global distribution network support potential growth. Opportunities lie in expanding plant-based and value-added beverages, alongside geographic market diversification, which could reinforce its competitive position.
SWOT Analysis
This SWOT analysis highlights The Coca-Cola Company’s core strategic factors shaping its competitive positioning and growth prospects.
Strengths
- strong global brand recognition
- robust distribution network
- favorable profitability with 27.34% net margin
Weaknesses
- moderate revenue growth at 1.87% last year
- high price-to-book ratio at 9.35
- debt-to-equity ratio of 1.41 signals leverage risk
Opportunities
- expanding product portfolio in health-conscious beverages
- growth potential in emerging markets
- innovation in plant-based and functional drinks
Threats
- intense competition from global and local beverage brands
- regulatory pressures on sugary drinks
- currency and geopolitical risks in key markets
The Coca-Cola Company’s strengths in brand and profitability support long-term value creation. However, slower top-line growth and leverage warrant cautious capital allocation. The firm must leverage innovation and emerging markets to offset competitive and regulatory headwinds.
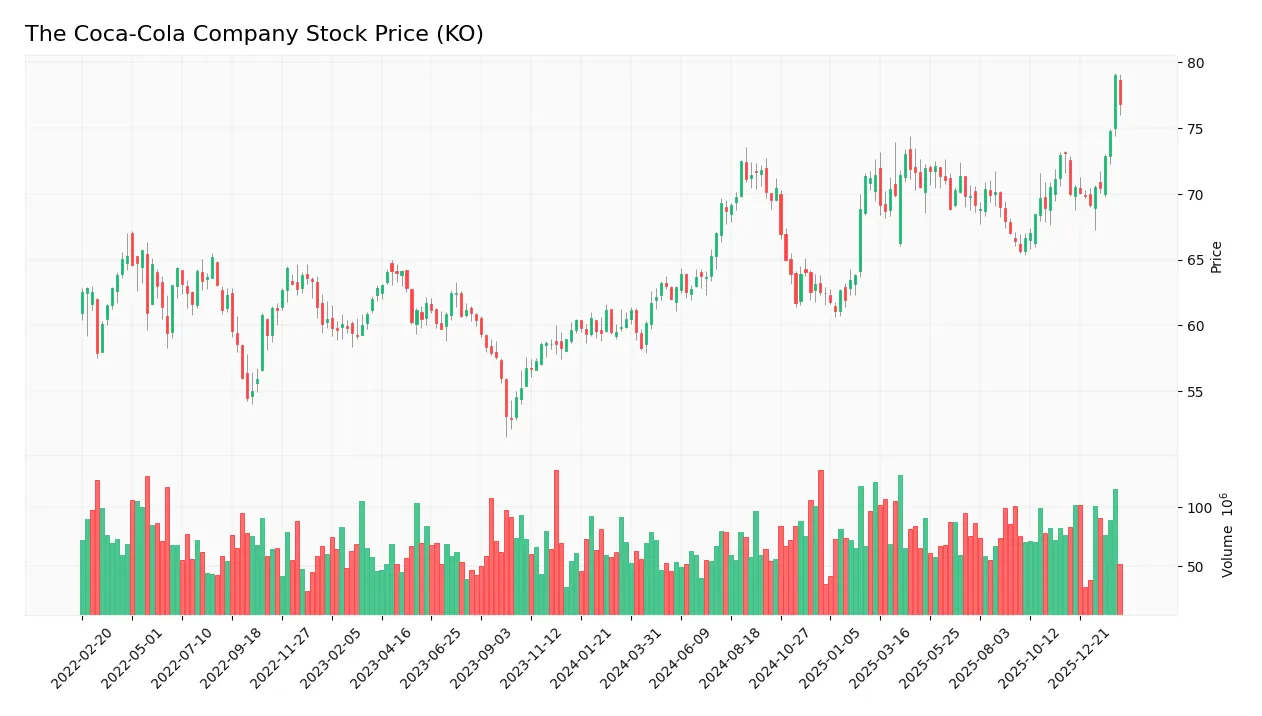
Stock Price Action Analysis
The weekly stock chart for The Coca-Cola Company (KO) highlights price movements and volatility over the past 100 weeks:
Trend Analysis
Over the past 100 weeks, KO’s stock price rose 30.5%, indicating a bullish trend with accelerating momentum. The price fluctuated between a low of 58.28 and a high of 79.84, supported by a volatility measure of 4.33%. This confirms sustained upward strength in the stock’s trajectory.
Volume Analysis
In the last three months, trading volume has increased with a slight buyer dominance at 54.12%. Buyer volume totals 548M versus seller volume of 465M. This volume pattern suggests growing investor interest and positive market participation in KO shares.
Target Prices
Analysts set a confident target price consensus for The Coca-Cola Company.
| Target Low | Target High | Consensus |
|---|---|---|
| 81 | 87 | 84.75 |
The target range between 81 and 87 signals moderate upside potential. The consensus near 85 reflects steady market confidence in KO’s performance.

Don’t Let Luck Decide Your Entry Point
Optimize your entry points with our advanced ProRealTime indicators. You’ll get efficient buy signals with precise price targets for maximum performance. Start outperforming now!
Analyst & Consumer Opinions
I present an overview of The Coca-Cola Company’s recent analyst ratings alongside consumer feedback and satisfaction metrics.
Stock Grades
Here are the most recent verified analyst grades for The Coca-Cola Company (KO) from leading financial institutions:
| Grading Company | Action | New Grade | Date |
|---|---|---|---|
| Barclays | Maintain | Overweight | 2026-02-12 |
| Jefferies | Maintain | Buy | 2026-02-11 |
| Evercore ISI Group | Maintain | Outperform | 2026-02-11 |
| JP Morgan | Maintain | Overweight | 2026-02-11 |
| RBC Capital | Maintain | Outperform | 2026-02-11 |
| Citigroup | Maintain | Buy | 2026-02-11 |
| UBS | Maintain | Buy | 2026-02-11 |
| Wells Fargo | Maintain | Overweight | 2026-02-09 |
| Jefferies | Maintain | Buy | 2026-02-04 |
| B of A Securities | Maintain | Buy | 2025-11-07 |
The consensus across top-tier firms remains firmly positive, with no downgrades or negative revisions. The pattern of “Buy,” “Overweight,” and “Outperform” grades reflects sustained confidence in KO’s market positioning.
Consumer Opinions
Consumers express a mix of loyalty and frustration toward The Coca-Cola Company, reflecting its global brand strength and product challenges.
| Positive Reviews | Negative Reviews |
|---|---|
| “Classic taste that never disappoints.” | “Too much sugar in many products.” |
| “Consistently high-quality beverages.” | “Limited options for healthier drinks.” |
| “Strong brand presence worldwide.” | “Pricing feels premium in some regions.” |
| “Great availability almost everywhere.” | “Packaging waste is a growing concern.” |
Overall, consumers praise Coca-Cola’s iconic flavor and global reach but repeatedly cite health concerns and environmental impact as key weaknesses. These issues could pressure future brand loyalty if unaddressed.
Risk Analysis
The following table summarizes key risks facing The Coca-Cola Company based on recent financial and market data:
| Category | Description | Probability | Impact |
|---|---|---|---|
| Debt Leverage | High debt-to-equity ratio (1.41) increases financial risk | Moderate | High |
| Valuation | Elevated price-to-book ratio (9.35) suggests overvaluation | Moderate | Moderate |
| Market Sensitivity | Low beta (0.364) reduces market volatility exposure | Low | Low |
| Competitive Pressure | Intense competition in non-alcoholic beverages sector | Moderate | Moderate |
| Supply Chain | Disruptions could impact production and distribution | Moderate | Moderate |
Leverage risk stands out due to the company’s unfavorable debt-to-equity ratio, raising concerns about financial flexibility. Despite a strong Altman Z-Score (5.1) indicating low bankruptcy risk, elevated valuation multiples warrant caution. The company’s stable beta limits market swings but does not eliminate operational risks.
Should You Buy The Coca-Cola Company?
The Coca-Cola Company appears to be a robust value creator with a durable competitive moat supported by growing ROIC well above WACC. Despite a challenging leverage profile, the overall rating suggests a very favorable investment case tempered by certain valuation weaknesses.
Strength & Efficiency Pillars
The Coca-Cola Company exhibits strong profitability with a net margin of 27.34% and a return on equity (ROE) of 40.74%. Its return on invested capital (ROIC) stands at 13.0%, well above the weighted average cost of capital (WACC) at 5.09%. This differential confirms that the company is a clear value creator. Operational efficiency is reinforced by a favorable EBIT margin of 36.82% and a robust interest coverage ratio of 10.67, underscoring effective capital allocation and sustainable competitive advantage.
Weaknesses and Drawbacks
The company is not without risks, notably its elevated price-to-book ratio of 9.35 and an unfavorable debt-to-equity ratio of 1.41. These metrics indicate a premium valuation and heightened financial leverage, which could pressure returns if market conditions deteriorate. While the current ratio of 1.46 is neutral, it suggests only moderate short-term liquidity. Additionally, the asset turnover ratio of 0.46 is unfavorable, pointing to potential inefficiencies in asset utilization that may constrain growth prospects.
Our Final Verdict about The Coca-Cola Company
The Coca-Cola Company’s long-term fundamentals appear solid, supported by strong profitability and value creation. The stock trend is bullish, with buyer dominance at 54.12% in recent periods, reinforcing positive momentum. Despite some valuation and leverage concerns, the overall profile suggests the company may appear attractive for long-term exposure, though investors should monitor leverage levels closely as a precaution.
Disclaimer: This content is for informational purposes only and does not constitute financial, investment, or other professional advice. Investing in financial markets involves a significant risk of loss, and past performance is not indicative of future results.
Additional Resources
- February 20, 2026 – 10-K: Annual report [Section 13 and 15(d), not S-K Item 405] – The Coca-Cola Company (Feb 20, 2026)
- Decoding Coca-Cola Co (KO): A Strategic SWOT Insight – GuruFocus (Feb 21, 2026)
- Tredje AP fonden Trims Position in CocaCola Company (The) $KO – MarketBeat (Feb 21, 2026)
- After Earnings, Is Coca-Cola Stock a Buy, a Sell, or Fairly Valued? – Morningstar (Feb 18, 2026)
- Board of Directors of The Coca-Cola Company Elects New Officer and Approves 64th Consecutive Annual Dividend Increase – The Coca-Cola Company (Feb 19, 2026)
For more information about The Coca-Cola Company, please visit the official website: coca-colacompany.com