Home > Analyses > Financial Services > The Charles Schwab Corporation
The Charles Schwab Corporation revolutionizes how millions manage wealth daily, blending cutting-edge technology with personalized financial services. It dominates the capital markets sector through retail brokerage, asset management, and advisory solutions, earning a reputation for innovation and customer trust. Schwab’s expansive platform supports both individual investors and financial advisors with seamless, integrated offerings. As market dynamics evolve, I ask: do Schwab’s fundamentals still warrant its premium valuation and robust growth prospects?

Table of contents
Business Model & Company Overview
The Charles Schwab Corporation, founded in 1971 and headquartered in Westlake, Texas, commands a dominant position in financial capital markets. It offers an integrated ecosystem of wealth management, securities brokerage, banking, asset management, and financial advisory services. Schwab’s dual focus on Investor Services and Advisor Services creates a seamless experience for retail and institutional clients alike, reinforcing its core mission to simplify investing and financial planning.
Schwab’s revenue engine balances recurring advisory fees with brokerage commissions and banking income across the Americas, Europe, and Asia. Its platform supports trading in equities, fixed income, options, and ETFs, alongside custodial and trust services. This diversified model fuels steady cash flow and client retention. I see Schwab’s economic moat in its expansive branch network, proprietary technology, and trusted brand, positioning it to shape the future of wealth management.
Financial Performance & Fundamental Metrics
I analyze The Charles Schwab Corporation’s income statement, key financial ratios, and dividend payout policy to assess its core financial health and shareholder value.
Income Statement
The table below summarizes The Charles Schwab Corporation’s key income statement figures from 2021 to 2025 in USD, reflecting its financial performance over five fiscal years.

| 2021 | 2022 | 2023 | 2024 | 2025 | |
|---|---|---|---|---|---|
| Revenue | 19B | 22.3B | 25.5B | 26B | 27.7B |
| Cost of Revenue | 476M | 1.5B | 6.7B | 6.4B | 5.5B |
| Operating Expenses | 10.8B | 11.4B | 12.5B | 11.9B | 8.5B |
| Gross Profit | 18.5B | 20.8B | 18.8B | 19.6B | 22.2B |
| EBITDA | 8.9B | 10.6B | 7.7B | 9.1B | 15B |
| EBIT | 7.7B | 9.4B | 6.4B | 7.7B | 13.7B |
| Interest Expense | 476M | 1.5B | 6.7B | 6.4B | 3.8B |
| Net Income | 5.9B | 7.2B | 5.1B | 5.9B | 8.9B |
| EPS | 2.84 | 3.52 | 2.55 | 3.00 | 4.68 |
| Filing Date | 2022-02-24 | 2023-02-24 | 2024-02-23 | 2025-02-26 | 2026-02-25 |
Income Statement Evolution
From 2021 to 2025, revenue grew by 46% to $27.7B, showing consistent expansion. Net income rose 51%, reaching $8.85B in 2025, reflecting strong profitability gains. Gross margin remained high at 80.3%, while EBIT margin improved to nearly 49.4%, signaling enhanced operational efficiency and disciplined cost control.
Is the Income Statement Favorable?
The 2025 income statement reveals robust fundamentals. Revenue growth was moderate at 6.5%, but gross profit surged 13.3%, indicating margin expansion. EBIT jumped 78% year-over-year, and net margin improved close to 32%. Despite an unfavorable 13.6% interest expense ratio, overall profitability and earnings per share growth remain favorable, supporting a strong earnings quality profile.
Financial Ratios
The table below presents key financial ratios for The Charles Schwab Corporation over recent fiscal years, illustrating profitability, valuation, liquidity, leverage, and efficiency metrics:
| Ratios | 2021 | 2022 | 2023 | 2024 | 2025 |
|---|---|---|---|---|---|
| Net Margin | 31% | 32% | 20% | 23% | 32% |
| ROE | 10.4% | 19.6% | 12.4% | 12.3% | 17.9% |
| ROIC | 7.3% | 9.6% | 4.5% | 5.6% | 2.2% |
| P/E | 27.1 | 21.8 | 24.8 | 22.8 | 20.0 |
| P/B | 2.82 | 4.29 | 3.06 | 2.80 | 3.58 |
| Current Ratio | 0.93 | 0.52 | 0.54 | 0.54 | 2953.0 |
| Quick Ratio | 0.93 | 0.52 | 0.54 | 0.54 | 2953.0 |
| D/E | 0.42 | 1.03 | 1.44 | 0.93 | 0.01 |
| Debt-to-Assets | 3.6% | 6.9% | 12.0% | 9.4% | 0.06% |
| Interest Coverage | 16.2 | 6.1 | 1.0 | 1.2 | 3.6 |
| Asset Turnover | 0.03 | 0.04 | 0.05 | 0.05 | 0.06 |
| Fixed Asset Turnover | 4.43 | 4.84 | 5.91 | 6.62 | 0.0 |
| Dividend Yield | 1.15% | 1.34% | 1.81% | 1.68% | 1.08% |
Note: The current and quick ratios for 2025 are unusually high at 2953x, indicating a possible data anomaly or unique balance sheet structure.
Evolution of Financial Ratios
Return on Equity (ROE) improved from 10.4% in 2021 to 17.9% in 2025, reflecting stronger profitability. The Current Ratio surged unusually to 2952.9 in 2025, deviating sharply from prior stable levels near 0.5 to 0.9. Debt-to-Equity Ratio declined from 0.42 in 2021 to a minimal 0.01 in 2025, indicating a significant reduction in leverage.
Are the Financial Ratios Fovorable?
Profitability ratios like net margin (32%) and ROE (17.9%) are favorable, showing solid earnings. Liquidity presents mixed signals: an extremely high current ratio is flagged unfavorable, yet quick ratio is favorable. Debt metrics remain favorable with a low debt-to-equity of 0.01, while asset turnover is unfavorable at 0.06. Market valuation ratios such as P/E (20) and dividend yield (1.08%) are neutral, resulting in an overall neutral financial ratio assessment.
Shareholder Return Policy
The Charles Schwab Corporation maintains a consistent dividend policy with a payout ratio around 22% in 2025 and a dividend yield near 1.08%. The dividend per share has remained stable, supported by strong free cash flow coverage, indicating prudent capital allocation. The company also engages in share buybacks, complementing dividends.
This balanced approach supports sustainable shareholder value by returning capital without risking financial flexibility. Schwab’s payout remains conservative relative to earnings, avoiding excessive distributions or buybacks that could impair long-term growth or financial health.
Score analysis
The radar chart below illustrates The Charles Schwab Corporation’s key financial scores across valuation and performance metrics:

The company shows strong returns with a very favorable ROE score of 5 and a favorable ROA score of 4. Its debt-to-equity score of 4 indicates prudent leverage management. However, valuation metrics lag, with very unfavorable scores of 1 in both price-to-earnings and price-to-book ratios, suggesting potential market pricing concerns.
Analysis of the company’s bankruptcy risk
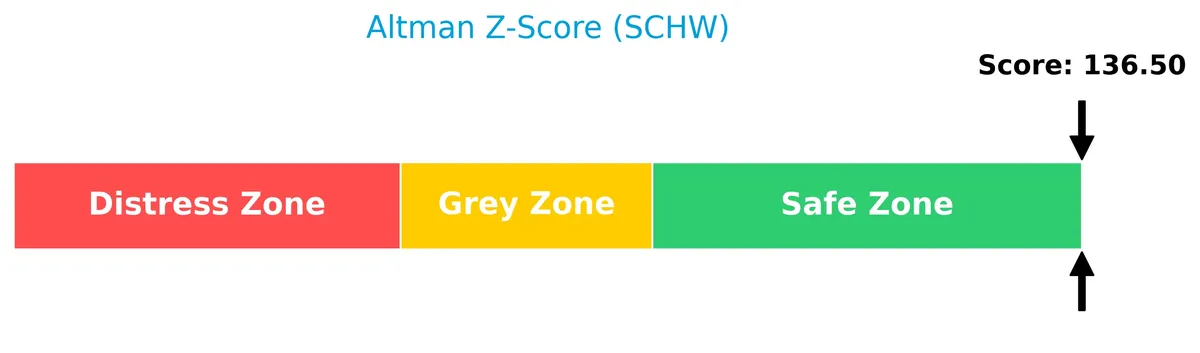
The Altman Z-Score places the company firmly in the safe zone, indicating a low risk of bankruptcy and strong financial stability:
Is the company in good financial health?
The Piotroski Score diagram highlights the company’s financial strength and robustness:

With a perfect Piotroski Score of 9, the company demonstrates very strong fundamentals, reflecting excellent profitability, liquidity, and operational efficiency. This score signals solid financial health and resilience.
Competitive Landscape & Sector Positioning
This analysis explores The Charles Schwab Corporation’s sector positioning, revenue streams, and key competitors. I will assess whether Schwab holds a competitive advantage over its peers.
Strategic Positioning
The Charles Schwab Corporation focuses on two core segments: Investor Services, generating $19B in 2025, and Advisor Services, $4.9B. Its product portfolio spans wealth management, brokerage, banking, and advisory. Geographically, it operates primarily in the US with international offices in key financial hubs.
Revenue by Segment
This pie chart illustrates The Charles Schwab Corporation’s revenue breakdown by segment for fiscal year 2025, highlighting the relative contributions of Advisor Services and Investor Services.
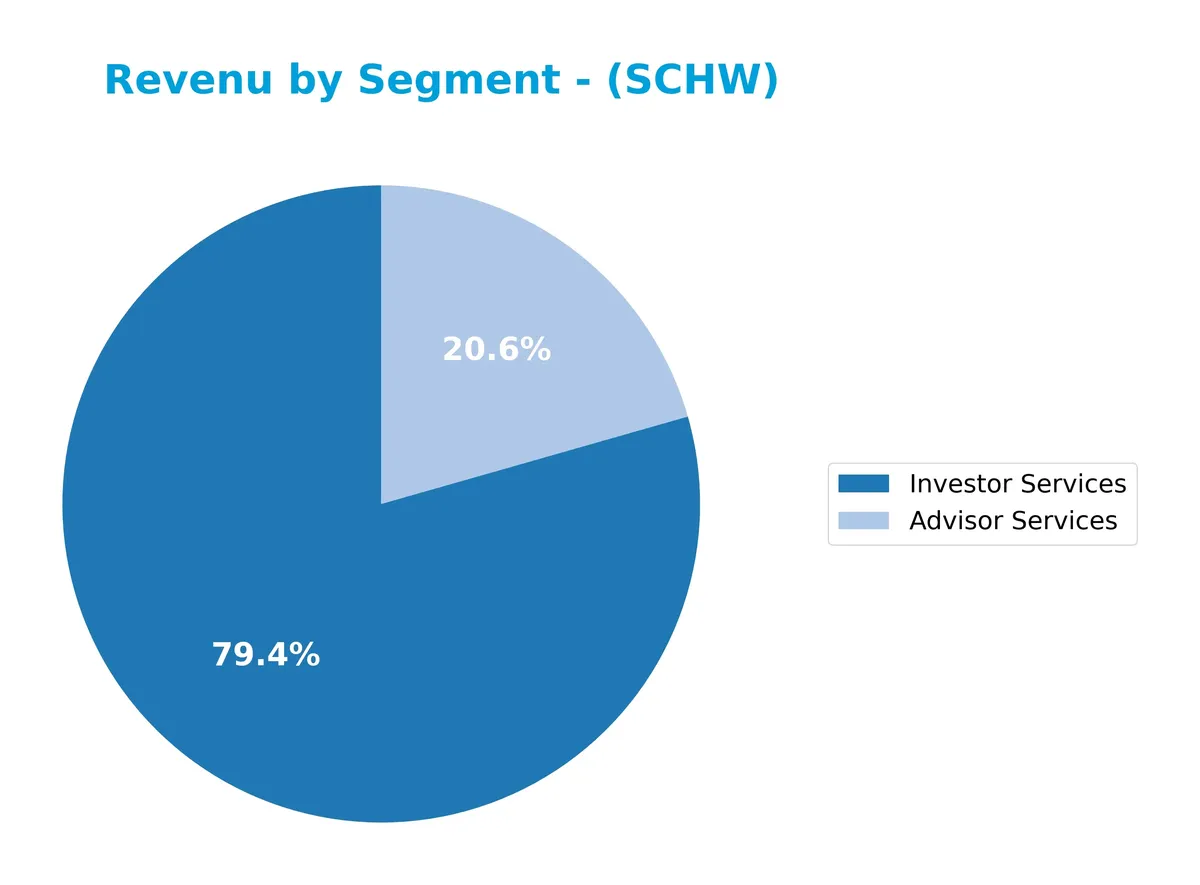
Investor Services remains the dominant revenue driver with $19B in 2025, up from $15.6B in 2024, signaling steady growth. Advisor Services also expanded to $4.9B from $4.0B, indicating strengthening client advisory demand. The company’s revenue mix shows increasing concentration in Investor Services, reflecting its core brokerage and asset management strength. Recent acceleration in both segments suggests robust market positioning despite sector cyclicality.
Key Products & Brands
The Charles Schwab Corporation offers a diverse range of financial products and services across two main business segments:
| Product | Description |
|---|---|
| Investor Services | Retail brokerage, investment advisory, banking, trust, retirement plan, equity compensation plan services, and clearing services. |
| Advisor Services | Custodial, trading, banking, support services, retirement and corporate brokerage, advice solutions, and trust services. |
Charles Schwab’s product lineup balances retail client offerings with comprehensive advisor support. Investor Services generate the bulk of revenue, reflecting a strong retail brokerage presence, while Advisor Services focus on institutional and advisory client solutions.
Main Competitors
There are 6 main competitors in the Financial – Capital Markets industry; below are the top 6 leaders by market capitalization:
| Competitor | Market Cap. |
|---|---|
| Morgan Stanley | 289B |
| The Goldman Sachs Group, Inc. | 287B |
| The Charles Schwab Corporation | 185B |
| Robinhood Markets, Inc. | 102B |
| Raymond James Financial, Inc. | 33B |
| Hut 8 Corp. | 5B |
The Charles Schwab Corporation ranks 3rd among its competitors. It holds about 60% of the market cap of the leader, Morgan Stanley. Schwab’s market cap stands above both the average market cap of the top 10 competitors (150B) and the sector median (143B). It maintains a 65.7% market cap lead over its closest rival above, Goldman Sachs.
Comparisons with competitors
Check out how we compare the company to its competitors:
Does SCHW have a competitive advantage?
The Charles Schwab Corporation does not demonstrate a competitive advantage, as its return on invested capital (ROIC) has fallen significantly below its weighted average cost of capital (WACC), indicating value destruction. The declining ROIC trend over 2021-2025 signals weakening profitability and inefficiency in capital allocation.
Looking ahead, Schwab’s broad service offerings across wealth management, brokerage, and advisory services provide multiple growth avenues. Expansion into new markets such as international locations and continued product innovation could offer future opportunities despite current challenges in sustaining economic profits.
SWOT Analysis
This analysis highlights The Charles Schwab Corporation’s key internal and external factors shaping its competitive position.
Strengths
- strong net margin at 32%
- favorable revenue and earnings growth
- very strong Piotroski score of 9
Weaknesses
- declining ROIC indicating value destruction
- unfavorable price-to-book ratio of 3.58
- weak asset turnover ratio
Opportunities
- expanding digital wealth management services
- growing advisor services segment
- market share gains from competitors’ weaknesses
Threats
- rising interest expense at 13.56%
- intense industry competition
- regulatory changes impacting fees
The company exhibits robust profitability and financial strength but faces challenges in capital efficiency. Strategic focus should prioritize improving ROIC and leveraging growth in advisory services while managing rising costs and regulatory risks.
Stock Price Action Analysis
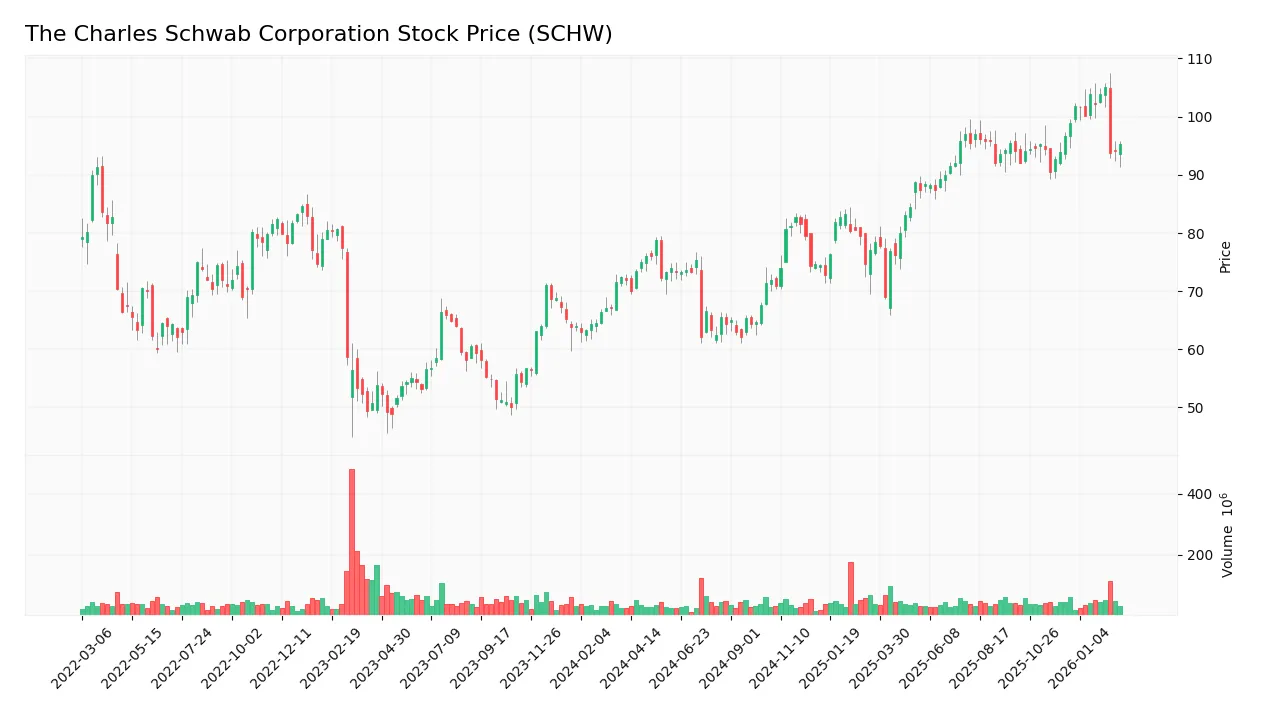
The weekly stock chart captures The Charles Schwab Corporation’s price movements and trend dynamics over the last 12 months:
Trend Analysis
Over the past year, SCHW’s stock price increased 32.63%, signaling a bullish trend with decelerating upward momentum. The price ranged from a low of 62.08 to a high of 105.08, showing significant appreciation despite volatility measured by an 11.79 standard deviation. Recent months show a slight -1.35% decline, indicating a neutral short-term trend.
Volume Analysis
Trading volume is increasing, with buyers dominating at 60.69% in the recent three months ending March 2026. Buyer volume outpaces sellers, suggesting sustained investor interest and positive market participation despite minor recent price softness.
Target Prices
Analysts set a clear target price range for The Charles Schwab Corporation, reflecting moderate upside potential.
| Target Low | Target High | Consensus |
|---|---|---|
| 105 | 148 | 122.78 |
The consensus target of $122.78 suggests analysts expect steady growth, with upside capped near $148, indicating cautious optimism in the current market cycle.

Don’t Let Luck Decide Your Entry Point
Optimize your entry points with our advanced ProRealTime indicators. You’ll get efficient buy signals with precise price targets for maximum performance. Start outperforming now!
Analyst & Consumer Opinions
This section examines recent analyst ratings and consumer feedback for The Charles Schwab Corporation (SCHW) to assess market sentiment.
Stock Grades
Here are the latest verified analyst grades for The Charles Schwab Corporation, reflecting recent consensus and actions:
| Grading Company | Action | New Grade | Date |
|---|---|---|---|
| Barclays | Maintain | Overweight | 2026-01-26 |
| UBS | Maintain | Buy | 2026-01-22 |
| Barclays | Maintain | Overweight | 2026-01-22 |
| Truist Securities | Maintain | Buy | 2026-01-22 |
| TD Cowen | Maintain | Buy | 2026-01-22 |
| Piper Sandler | Maintain | Neutral | 2026-01-14 |
| TD Cowen | Maintain | Buy | 2026-01-14 |
| Citizens | Maintain | Market Outperform | 2026-01-12 |
| Barclays | Maintain | Overweight | 2026-01-08 |
| UBS | Maintain | Buy | 2026-01-07 |
The analyst community shows strong confidence with predominantly Buy and Overweight ratings. Piper Sandler’s Neutral stance is an outlier amid a solid Buy consensus, signaling broad optimism.
Consumer Opinions
Investor sentiment around The Charles Schwab Corporation reflects a mix of appreciation for its user-friendly platform and concerns about customer service responsiveness.
| Positive Reviews | Negative Reviews |
|---|---|
| Intuitive trading platform simplifies investing for beginners. | Customer support can be slow during peak hours. |
| Competitive fees and transparent pricing structure. | Occasional glitches reported on the mobile app. |
| Robust research tools empower informed decisions. | Some users find advanced features less accessible. |
Overall, clients praise Schwab’s low fees and intuitive tools, but recurring complaints about customer service delays and technical issues suggest areas for improvement. This feedback aligns with my observation that operational efficiency remains critical in fintech leadership.
Risk Analysis
Below is a summary table highlighting key risks facing The Charles Schwab Corporation, with their likelihood and potential impact:
| Category | Description | Probability | Impact |
|---|---|---|---|
| Profitability | Low ROIC (2.15%) versus WACC (9.6%) signals weak capital efficiency, pressuring returns. | Medium | High |
| Valuation | Elevated price-to-book (3.58) and price-to-earnings (20) ratios may limit upside potential. | Medium | Medium |
| Liquidity | Extremely high current ratio (2952.94) suggests inefficient asset use, creating operational risk. | Low | Medium |
| Market Volatility | Beta at 0.91 indicates sensitivity to market downturns, exposing shares to cyclical risks. | High | Medium |
| Regulatory | Financial services sector faces ongoing regulatory scrutiny, potentially increasing compliance costs. | Medium | Medium |
The most concerning risk is Schwab’s low ROIC relative to its cost of capital, which historically undermines sustainable growth. Despite a very strong Piotroski score and safe Altman Z-score, valuation multiples remain stretched. Market volatility also poses a persistent threat given Schwab’s exposure to capital markets. Prudence dictates close monitoring of capital allocation and regulatory developments.
Should You Buy The Charles Schwab Corporation?
This analytical interpretation suggests a profile of moderate operational efficiency and very strong financial health, supported by manageable leverage. While the company appears to be shedding value with declining profitability, its overall rating of B+ reflects a resilient investment quality amid valuation concerns.
Strength & Efficiency Pillars
The Charles Schwab Corporation shows robust profitability with a net margin of 31.99% and a return on equity (ROE) of 17.92%, both favorable in the financial sector. However, its return on invested capital (ROIC) at 2.15% falls below the weighted average cost of capital (WACC) of 9.6%, indicating the company is currently a value destroyer rather than a creator. Despite this, Schwab’s very strong Piotroski score of 9 underscores operational strength and sound fundamentals.
Weaknesses and Drawbacks
Schwab faces valuation concerns with a price-to-book ratio of 3.58, deemed unfavorable, suggesting the stock trades at a premium relative to book value. The current ratio is abnormally high at 2952.94, which signals potential inefficiencies in working capital management despite a favorable quick ratio. Additionally, asset turnover is weak at 0.06, reflecting poor asset utilization. Interest expense remains a challenge at 13.56%, which could pressure earnings if rates rise.
Our Final Verdict about The Charles Schwab Corporation
The Charles Schwab Corporation’s profile suggests solid operational profitability and strong financial health, reinforced by a safe Altman Z-Score of 136.5 and a very strong Piotroski score. The bullish long-term trend and buyer dominance further support its attractive attributes. However, recent price deceleration advises a cautious approach. Overall, Schwab may appear suitable for investors seeking exposure to a fundamentally sound financial services firm with some valuation caution.
Disclaimer: This content is for informational purposes only and does not constitute financial, investment, or other professional advice. Investing in financial markets involves a significant risk of loss, and past performance is not indicative of future results.
Additional Resources
- Here is Why Growth Investors Should Buy Charles Schwab (SCHW) Now – Yahoo Finance (Feb 25, 2026)
- SCHWAB CHARLES CORP SEC 10-K Report – TradingView (Feb 25, 2026)
- Decoding Charles Schwab Corp (SCHW): A Strategic SWOT Insight – GuruFocus (Feb 26, 2026)
- March 2027 Options Now Available For Charles Schwab (SCHW) – Nasdaq (Feb 25, 2026)
- 26,678 Shares in The Charles Schwab Corporation $SCHW Purchased by Empirical Asset Management LLC – MarketBeat (Feb 25, 2026)
For more information about The Charles Schwab Corporation, please visit the official website: schwab.com