Home > Analyses > Industrials > The Boeing Company
Every time millions of passengers board a jetliner or satellites launch into orbit, Boeing’s engineering mastery is at work behind the scenes. As a titan in aerospace and defense, Boeing commands global influence through its commercial airplanes, military aircraft, space exploration, and comprehensive services. Renowned for innovation and quality, it shapes the future of air and space travel. The key question for investors: does Boeing’s current valuation fully reflect its growth prospects and industry challenges?
Table of contents
Business Model & Company Overview
The Boeing Company, founded in 1916 and headquartered in Arlington, VA, stands as a dominant leader in the aerospace and defense industry. Its integrated ecosystem spans commercial jetliners, military aircraft, satellites, and space launch systems, delivering a broad spectrum of products and services that serve global passenger, cargo, and defense markets. Boeing’s comprehensive portfolio underpins its core mission to connect and protect people worldwide through advanced aviation and space technologies.
Boeing’s revenue engine balances hardware sales with robust recurring services, including fleet support, maintenance, training, and digital solutions, across its four segments: Commercial Airplanes, Defense, Space & Security, Global Services, and Boeing Capital. This diversified approach fuels its presence in key regions such as the Americas, Europe, and Asia. Boeing’s economic moat is fortified by its unmatched scale, technological expertise, and strategic role in shaping aerospace innovation and defense capabilities worldwide.
Financial Performance & Fundamental Metrics
This section provides a clear overview of The Boeing Company’s income statement, key financial ratios, and dividend payout policy to guide informed investment decisions.
Income Statement
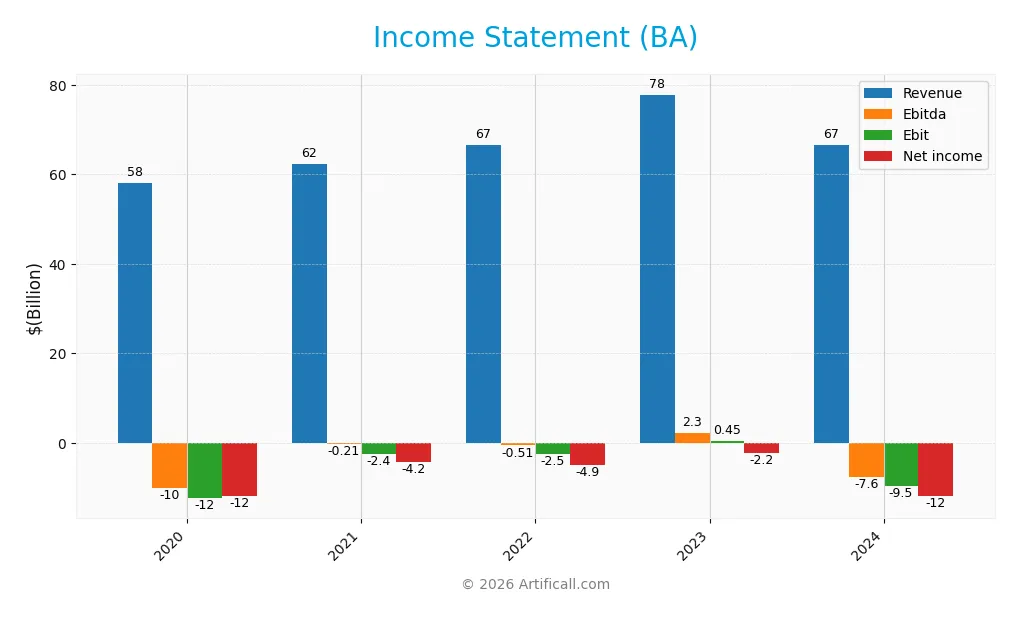
The table below summarizes The Boeing Company’s key income statement figures for the fiscal years 2020 through 2024, showing revenue, expenses, profitability, and earnings per share.
| 2020 | 2021 | 2022 | 2023 | 2024 | |
|---|---|---|---|---|---|
| Revenue | 58.2B | 62.3B | 66.6B | 77.8B | 66.5B |
| Cost of Revenue | 57.1B | 55.8B | 63.1B | 70.1B | 68.5B |
| Operating Expenses | 7.3B | 6.4B | 7.0B | 8.5B | 8.8B |
| Gross Profit | 1.0B | 6.5B | 3.5B | 7.7B | -2.0B |
| EBITDA | -10.1B | -207M | -510M | 2.3B | -7.6B |
| EBIT | -12.3B | -2.4B | -2.5B | 454M | -9.5B |
| Interest Expense | 2.2B | 2.7B | 2.5B | 2.5B | 2.7B |
| Net Income | -11.9B | -4.2B | -4.9B | -2.2B | -11.8B |
| EPS | -21.00 | -7.15 | -8.30 | -3.67 | -18.36 |
| Filing Date | 2021-02-01 | 2022-01-31 | 2023-01-27 | 2024-01-31 | 2025-02-03 |
Income Statement Evolution
From 2020 to 2024, Boeing’s revenue showed an overall moderate increase of 14.37%, yet the latest year saw a 14.49% decline. Net income remained negative throughout, with a slight overall growth of 0.47%, reflecting persistent losses. Margins deteriorated in 2024, as gross margin turned negative at -2.94%, and net margin worsened to -17.77%, signaling increased cost pressures and declining profitability.
Is the Income Statement Favorable?
The 2024 income statement reveals unfavorable fundamentals, with a negative gross profit of -$1.96B and an EBIT loss of $9.49B. Operating expenses and interest costs remain significant, despite a favorable interest expense ratio at 4.1%. Net income stood at a -$11.82B loss, with EPS dropping sharply to -$18.36, underscoring operational and financial challenges impacting overall earnings quality.
Financial Ratios
The table below presents key financial ratios for The Boeing Company (BA) over the fiscal years 2020 to 2024, providing insight into profitability, liquidity, leverage, and valuation metrics:
| Ratios | 2020 | 2021 | 2022 | 2023 | 2024 |
|---|---|---|---|---|---|
| Net Margin | -20% | -7% | -7% | -3% | -18% |
| ROE | 65% | 28% | 31% | 0.1% | 3% |
| ROIC | -8% | 0.1% | -7% | -2% | -17% |
| P/E | -10.3 | -28.2 | -23.0 | -71.0 | -9.7 |
| P/B | -6.6 | -7.9 | -7.1 | -9.2 | -29.3 |
| Current Ratio | 1.39 | 1.33 | 1.22 | 1.14 | 1.32 |
| Quick Ratio | 0.46 | 0.36 | 0.35 | 0.31 | 0.42 |
| D/E | -3.5 | -3.9 | -3.6 | -3.1 | -13.9 |
| Debt-to-Assets | 42% | 42% | 42% | 38% | 35% |
| Interest Coverage | -2.9 | 0.02 | -1.4 | -0.3 | -4.0 |
| Asset Turnover | 0.38 | 0.45 | 0.49 | 0.57 | 0.43 |
| Fixed Asset Turnover | 4.9 | 5.7 | 6.3 | 6.8 | 5.7 |
| Dividend Yield | 1.0% | 0% | 0% | 0% | 0% |
Evolution of Financial Ratios
Over the analyzed period, Boeing’s Return on Equity showed a notable increase, reaching 3.02% in 2024, indicating some improvement in profitability despite persistent overall losses. The Current Ratio remained relatively stable around 1.3, reflecting consistent short-term liquidity. The Debt-to-Equity Ratio shifted significantly to a highly negative value (-13.87) in 2024, suggesting substantial leverage fluctuations and complexity in equity structure.
Are the Financial Ratios Favorable?
In 2024, Boeing’s profitability ratios, including net margin (-17.77%) and return on invested capital (-17.17%), were unfavorable, indicating ongoing challenges in generating profits. Liquidity was mixed: the Current Ratio was neutral at 1.32, while the Quick Ratio was unfavorable at 0.42. Leverage metrics showed a favorable Debt-to-Equity ratio (-13.87) but an unfavorable interest coverage of -3.48. Efficiency was weak with an asset turnover of 0.43, while fixed asset turnover was favorable at 5.67. Overall, the financial ratios are slightly unfavorable.
Shareholder Return Policy
The Boeing Company does not pay dividends, reflecting persistent net losses and negative free cash flow per share in recent years. The company appears to prioritize reinvestment and managing operational challenges, with no share buyback programs reported.
This approach aligns with sustaining long-term value amid financial difficulties, though the absence of distributions limits immediate shareholder returns. The policy suggests a focus on recovery and strategic investment rather than cash returns to shareholders at this stage.
Score analysis
The following radar chart illustrates The Boeing Company’s key financial scores across various valuation and profitability metrics:
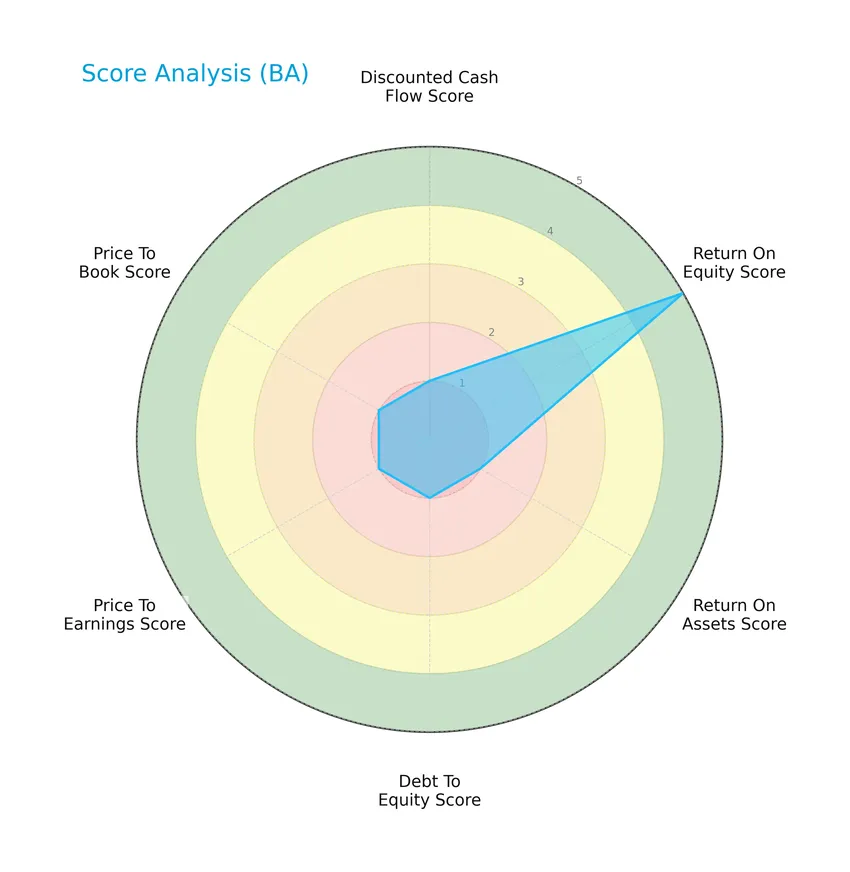
The Boeing Company shows a mixed financial profile with a very favorable return on equity score of 5, contrasted by very unfavorable scores of 1 in discounted cash flow, return on assets, debt to equity, price to earnings, and price to book ratios, indicating challenges in multiple valuation and leverage metrics.
Analysis of the company’s bankruptcy risk
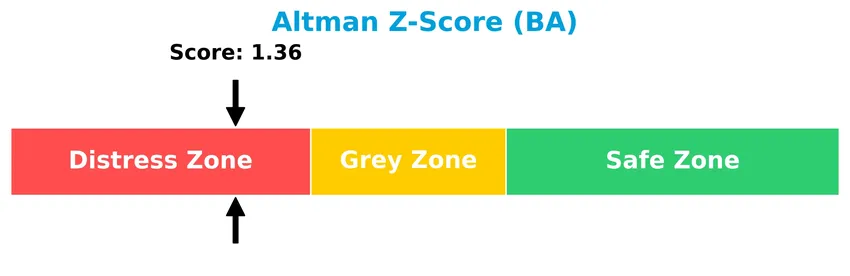
The Altman Z-Score indicates that The Boeing Company is currently in the distress zone, signaling a high risk of financial distress and potential bankruptcy:
Is the company in good financial health?
The Piotroski Score diagram provides insight into the company’s financial health based on nine fundamental criteria:

With a Piotroski Score of 4, The Boeing Company falls into the average category, reflecting moderate financial strength but also highlighting areas that may require improvement to enhance overall financial health.
Competitive Landscape & Sector Positioning
This sector analysis will explore The Boeing Company’s strategic positioning, revenue by segment, key products, main competitors, competitive advantages, and SWOT analysis. I will examine whether Boeing holds a competitive advantage over its industry peers in aerospace and defense.
Strategic Positioning
The Boeing Company maintains a diversified portfolio across aerospace and defense, with key segments in Commercial Airplanes, Defense, Space & Security, and Global Services. Geographically, revenue spans the United States (36B in 2024) and multiple international markets including Asia (12B), Europe (8.7B), and the Middle East (4.6B), reflecting broad global exposure.
Revenue by Segment
This pie chart illustrates The Boeing Company’s revenue distribution across its main business segments for the fiscal year 2024.
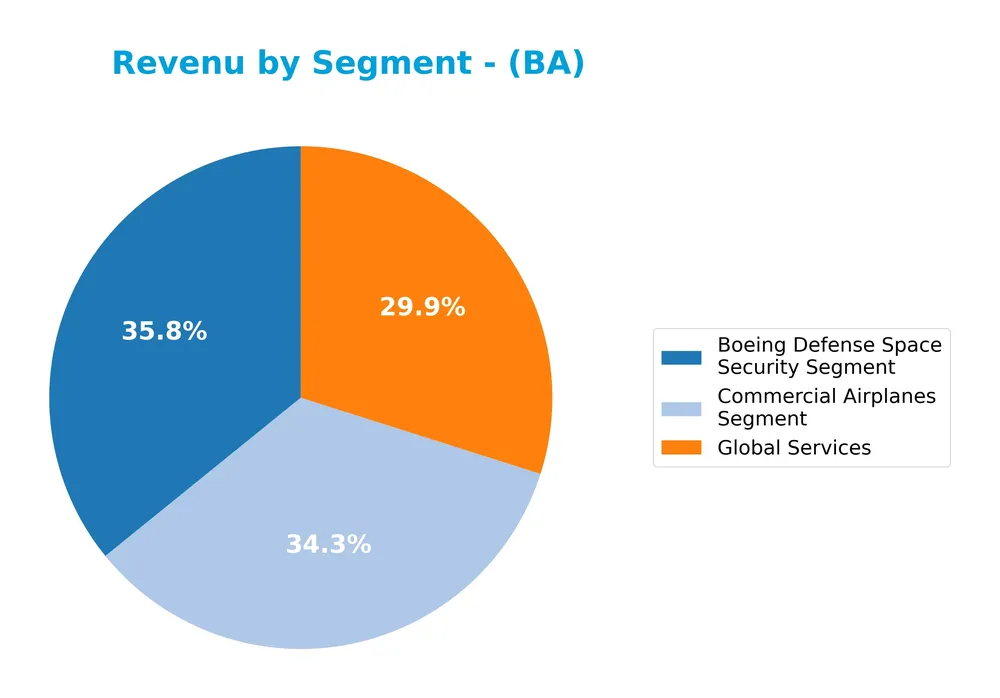
In 2024, Boeing’s revenue was primarily driven by the Boeing Defense Space Security Segment at $23.9B, followed closely by the Commercial Airplanes Segment at $22.9B and Global Services at $19.9B. The Commercial Airplanes segment experienced a notable decline from previous years, indicating some slowdown, while Defense remains stable. Global Services showed modest growth, slightly balancing the revenue mix and reducing concentration risk.
Key Products & Brands
The Boeing Company operates diverse segments offering aerospace and defense products and services as follows:
| Product | Description |
|---|---|
| Commercial Airplanes Segment | Designs, manufactures, and sells commercial jet aircraft for passenger and cargo needs along with fleet support. |
| Defense, Space & Security Segment | Develops military aircraft, weapons systems, strategic defense, intelligence systems, satellites, and space exploration. |
| Global Services Segment | Provides supply chain, logistics, engineering, maintenance, upgrades, training, technical documents, and digital services. |
| Boeing Capital Segment | Offers financing services, managing leasing portfolios, sales-type/finance leases, receivables, and investments. |
Boeing’s portfolio spans commercial jets, military and space systems, global support services, and financial solutions, reflecting its broad aerospace and defense industry presence.
Main Competitors
There are 12 competitors in the Aerospace & Defense industry, with the table below listing the top 10 leaders by market capitalization:
| Competitor | Market Cap. |
|---|---|
| GE Aerospace | 338.3B |
| RTX Corporation | 250.7B |
| The Boeing Company | 171.4B |
| Lockheed Martin Corporation | 116.3B |
| General Dynamics Corporation | 92.6B |
| Northrop Grumman Corporation | 83.6B |
| TransDigm Group Incorporated | 76.5B |
| L3Harris Technologies, Inc. | 56.9B |
| Axon Enterprise, Inc. | 44.5B |
| BWX Technologies, Inc. | 17.3B |
The Boeing Company ranks third among its competitors in market capitalization, with a market cap roughly 58.4% of the top leader, GE Aerospace. It is positioned above both the average market cap of the top 10 competitors (125B) and the median market cap in the sector (80B). The company enjoys a significant 26.95% gap above its nearest competitor, RTX Corporation, indicating a strong lead at its rank position.
Comparisons with competitors
Check out how we compare the company to its competitors:
Does BA have a competitive advantage?
The Boeing Company currently does not present a competitive advantage, as its return on invested capital (ROIC) is significantly below its weighted average cost of capital (WACC), indicating value destruction and declining profitability. Over the 2020-2024 period, the company’s ROIC trend has been sharply negative, reflecting challenges in efficiently using invested capital.
Looking ahead, Boeing operates in diverse aerospace and defense segments, including commercial airplanes, military aircraft, satellites, and global services, which could offer future growth opportunities. The company’s broad product portfolio and global market presence position it to potentially capitalize on emerging aerospace and defense demands, although recent financial trends suggest caution.
SWOT Analysis
This SWOT analysis highlights The Boeing Company’s key internal and external factors to guide investment decisions.
Strengths
- Leading aerospace & defense brand
- Diverse product portfolio across commercial, defense, space, and services
- Strong market presence in the US and globally
Weaknesses
- Negative net and EBIT margins
- Declining revenue and profitability in recent years
- Weak liquidity ratios and interest coverage
Opportunities
- Growing demand for commercial and military aircraft post-pandemic
- Expansion in space and satellite segments
- Increasing global defense budgets
Threats
- Intense competition from Airbus and other players
- Supply chain disruptions and production delays
- Geopolitical risks affecting defense contracts and exports
Overall, Boeing’s established market position and diversified operations provide solid strengths, but current financial weaknesses and industry challenges require cautious risk management. Investors should monitor Boeing’s recovery efforts and strategic shifts to capitalize on aerospace growth and mitigate ongoing threats.
Stock Price Action Analysis
The weekly stock chart of The Boeing Company (BA) illustrates price movements and volatility over the recent 12-month period, highlighting key support and resistance levels:
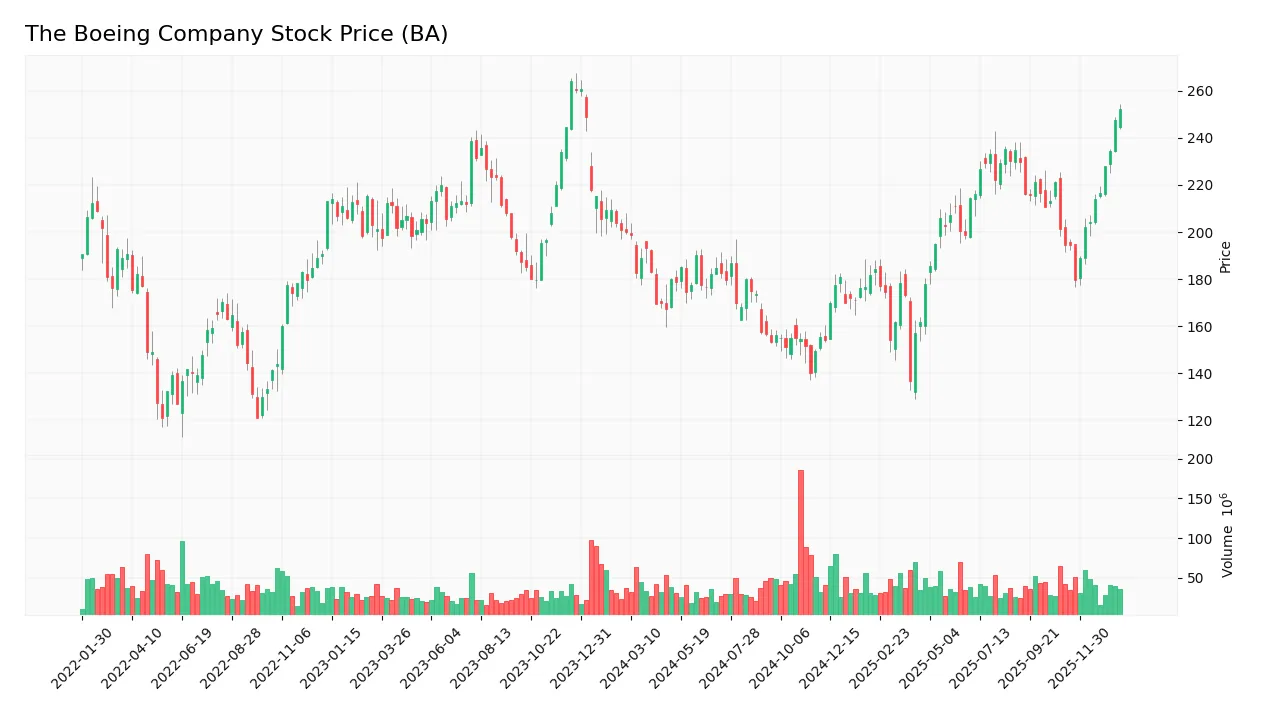
Trend Analysis
Over the past 12 months, BA’s stock price increased by 26.08%, indicating a bullish trend with clear acceleration. The stock’s price ranged between a low of 136.59 and a high of 252.15, with a notable standard deviation of 26.04, reflecting considerable volatility during this period.
Volume Analysis
Trading volume for BA has been increasing overall, with a recent three-month period strongly buyer-dominant at 72.71%. This rise in buyer volume versus seller volume suggests growing investor confidence and heightened market participation in this timeframe.
Target Prices
The current analyst consensus for The Boeing Company (BA) indicates a positive outlook with a wide target range.
| Target High | Target Low | Consensus |
|---|---|---|
| 298 | 150 | 253.8 |
Analysts expect Boeing’s stock price to potentially reach as high as 298 or drop to 150, with a consensus around 253.8, reflecting moderate bullish sentiment tempered by some downside risk.

Don’t Let Luck Decide Your Entry Point
Optimize your entry points with our advanced ProRealTime indicators. You’ll get efficient buy signals with precise price targets for maximum performance. Start outperforming now!
Analyst & Consumer Opinions
This section summarizes recent analyst ratings and consumer feedback related to The Boeing Company (BA).
Stock Grades
The following table presents recent verified stock grades for The Boeing Company from major financial analysts:
| Grading Company | Action | New Grade | Date |
|---|---|---|---|
| Bernstein | Maintain | Outperform | 2026-01-15 |
| Citigroup | Maintain | Buy | 2026-01-13 |
| JP Morgan | Maintain | Overweight | 2025-12-19 |
| Susquehanna | Maintain | Positive | 2025-11-12 |
| Freedom Capital Markets | Upgrade | Buy | 2025-11-03 |
| JP Morgan | Maintain | Overweight | 2025-10-30 |
| UBS | Maintain | Buy | 2025-10-30 |
| Bernstein | Maintain | Outperform | 2025-10-02 |
| RBC Capital | Maintain | Outperform | 2025-09-29 |
| Susquehanna | Maintain | Positive | 2025-09-15 |
The overall trend in analyst grades remains positive, with most firms maintaining buy or outperform ratings, and a recent upgrade noted by Freedom Capital Markets. Consensus among 52 analysts leans toward a “Buy” stance, reflecting general confidence in the stock.
Consumer Opinions
Consumer sentiment around The Boeing Company reflects a blend of admiration for its innovation and concerns about recent operational challenges.
| Positive Reviews | Negative Reviews |
|---|---|
| “Boeing’s aircraft are industry-leading in technology and design.” | “Delays in delivery have caused frustration among customers.” |
| “Strong safety record and commitment to quality.” | “Customer service responsiveness has declined recently.” |
| “Innovative approach to sustainable aviation solutions.” | “Some products have faced technical issues post-launch.” |
Overall, consumers consistently praise Boeing’s innovation and safety standards but express concerns regarding delivery delays and customer service responsiveness, signaling areas needing attention for enhanced satisfaction.
Risk Analysis
Below is a summary table highlighting key risk categories, their descriptions, and the assessed probability and impact for The Boeing Company:
| Category | Description | Probability | Impact |
|---|---|---|---|
| Financial Health | Negative net margin (-17.77%) and negative ROIC (-17.17%) signal operational profitability risks. | High | High |
| Bankruptcy Risk | Altman Z-Score of 1.36 places Boeing in the distress zone, indicating elevated bankruptcy risk. | Moderate | Very High |
| Debt Management | Debt-to-assets ratio at 34.66% with unfavorable interest coverage (-3.48) poses financial strain. | Moderate | High |
| Market Volatility | Beta of 1.16 suggests stock price is moderately sensitive to market swings. | High | Moderate |
| Dividend Policy | No dividend paid, which may deter income-focused investors during volatile periods. | Moderate | Moderate |
The most significant risks stem from Boeing’s financial instability, evidenced by negative profitability metrics and a distress-zone Altman Z-Score. Elevated debt levels combined with poor interest coverage exacerbate solvency concerns, making cautious risk management essential before investing.
Should You Buy The Boeing Company?
Analytically, The Boeing Company appears to be facing substantial operational challenges with declining profitability and a very unfavorable competitive moat indicating value erosion. Despite a manageable leverage profile, its overall rating is a cautious C, reflecting moderate financial health and elevated risk.
Strength & Efficiency Pillars
The Boeing Company exhibits a mixed financial profile with notable strengths in profitability metrics, particularly a robust return on equity of 302.38%, signaling strong shareholder returns. Despite a negative return on invested capital (-17.17%) falling below the WACC of 8.16%, the company does not qualify as a value creator and is instead shedding value. Financial health indicators are concerning; the Altman Z-Score at 1.36 places Boeing in the distress zone, highlighting elevated bankruptcy risk, while the Piotroski score of 4 suggests average financial strength.
Weaknesses and Drawbacks
Boeing faces significant headwinds in valuation and leverage metrics. The company’s price-to-earnings and price-to-book ratios are negative but assessed as favorable due to accounting anomalies, yet underlying earnings remain deeply negative with a net margin of -17.77%. Leverage ratios present risks, with a quick ratio of 0.42 signaling liquidity constraints and an interest coverage ratio at -3.48 indicating difficulty servicing debt. Market dynamics show buyer dominance at 72.71% recently, but the Altman Z-Score warns of financial distress, raising concerns over near-term viability.
Our Verdict about The Boeing Company
The long-term fundamental profile of The Boeing Company appears unfavorable due to negative profitability and financial distress signals. However, the current bullish stock trend with accelerating price gains and strong buyer dominance in the recent period suggests positive market sentiment. This divergence indicates that despite foundational weaknesses, the stock might appear attractive for speculative or tactical exposure, though investors should exercise caution and seek clearer signs of financial recovery before committing to long-term positions.
Disclaimer: This content is for informational purposes only and does not constitute financial, investment, or other professional advice. Investing in financial markets involves a significant risk of loss, and past performance is not indicative of future results.
Additional Resources
- Is Boeing (BA) Pricing In A Recovery After Recent Safety And Production Issues? – Yahoo Finance (Jan 23, 2026)
- Strs Ohio Raises Position in The Boeing Company $BA – MarketBeat (Jan 23, 2026)
- Is Boeing Stock (BA) Worth Buying Ahead of Q4 Earnings? Wall Street Weighs In – TipRanks (Jan 23, 2026)
- Boeing: Why Production, Not Valuation, Is The Real Story Now (NYSE:BA) – Seeking Alpha (Jan 21, 2026)
- Boeing’s Options Frenzy: What You Need to Know – Benzinga (Jan 22, 2026)
For more information about The Boeing Company, please visit the official website: boeing.com