Home > Analyses > Financial Services > The Bank of New York Mellon Corporation
The Bank of New York Mellon Corporation moves trillions daily, anchoring global finance with unmatched custody and asset management services. It commands leadership in securities services and wealth management, blending innovation with deep market expertise. Its trusted platforms support central banks, institutions, and high-net-worth clients worldwide. As 2026 unfolds, I ask: Do BNY Mellon’s robust fundamentals still justify its premium valuation and growth outlook in a shifting financial landscape?

Table of contents
Business Model & Company Overview
The Bank of New York Mellon Corporation, founded in 1784 and headquartered in New York City, stands as a dominant player in Asset Management. It operates a comprehensive financial ecosystem encompassing Securities Services, Market and Wealth Services, and Investment and Wealth Management. This structure positions the company as a pivotal partner for institutional and high-net-worth clients worldwide.
The company generates value through a balanced revenue engine combining custody, investment management, and integrated cash management solutions. Its strategic footprint spans the Americas, Europe, and Asia, serving central banks, asset managers, and family offices. The Bank of New York Mellon’s economic moat lies in its sophisticated global infrastructure and deep client relationships shaping the future of financial services.
Financial Performance & Fundamental Metrics
I analyze The Bank of New York Mellon Corporation’s income statement, key financial ratios, and dividend payout policy to assess its core financial health and shareholder returns.
Income Statement
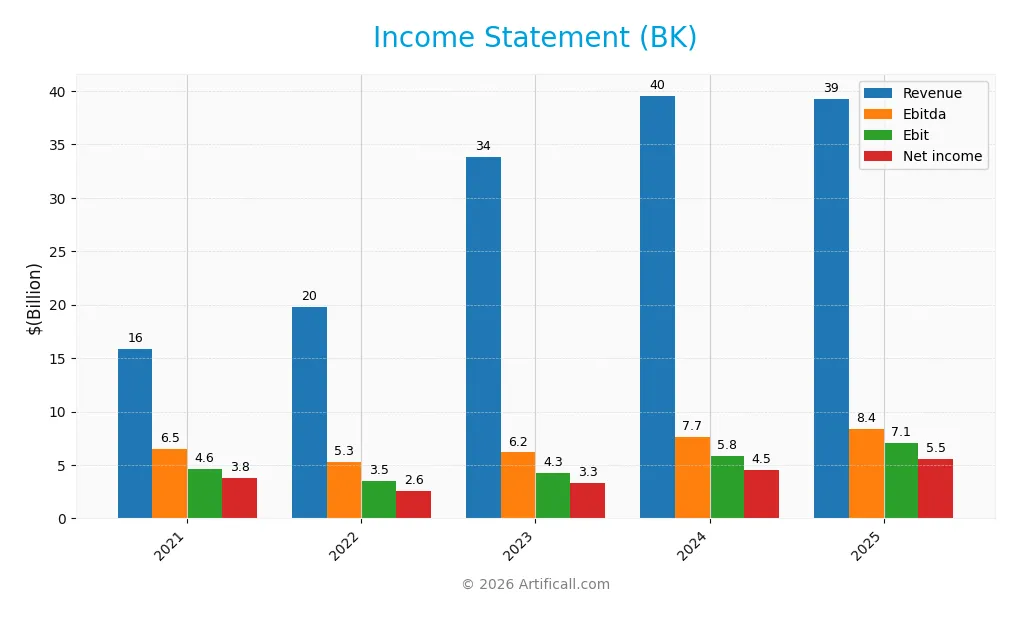
The table below presents The Bank of New York Mellon Corporation’s key income statement figures for fiscal years 2021 through 2025, offering a clear view of its financial performance.
| 2021 | 2022 | 2023 | 2024 | 2025 | |
|---|---|---|---|---|---|
| Revenue | 15.9B | 19.8B | 33.8B | 39.6B | 39.2B |
| Cost of Revenue | -4.0M | 3.7B | 16.4B | 21.4B | 19.4B |
| Operating Expenses | 11.2B | 12.7B | 13.1B | 12.3B | 12.8B |
| Gross Profit | 15.9B | 16.1B | 17.4B | 18.2B | 19.9B |
| EBITDA | 6.5B | 5.3B | 6.2B | 7.7B | 8.4B |
| EBIT | 4.6B | 3.5B | 4.3B | 5.8B | 7.1B |
| Interest Expense | 227M | 3.6B | 16.3B | 21.3B | 20.7B |
| Net Income | 3.8B | 2.6B | 3.3B | 4.5B | 5.5B |
| EPS | 4.17 | 2.91 | 3.91 | 5.84 | 7.46 |
| Filing Date | 2022-02-25 | 2023-02-27 | 2023-12-31 | 2025-02-27 | 2026-02-25 |
Income Statement Evolution
Between 2021 and 2025, BK’s revenue surged 147% overall but dipped slightly by 0.8% in the last year. Net income increased 48% over five years, with a notable 23% rise in the latest year. Gross and EBIT margins improved, reflecting stronger profitability, although net margin contracted 40% across the full period.
Is the Income Statement Favorable?
In 2025, BK posted $39.2B revenue and $5.5B net income, yielding a 14.1% net margin, deemed favorable. EBIT margin stood at 18%, supporting solid operating efficiency. However, interest expense absorbed 53% of interest income, marking a significant cost pressure. Overall, fundamentals remain favorable despite this notable expense ratio.
Financial Ratios
The following table presents key financial ratios for The Bank of New York Mellon Corporation (BK) over the last four fiscal years:
| Ratios | 2022 | 2023 | 2024 | 2025 |
|---|---|---|---|---|
| Net Margin | 13% | 10% | 11% | 14% |
| ROE | 6.3% | 8.1% | 11.0% | 12.5% |
| ROIC | 2.5% | 3.1% | 4.3% | 6.4% |
| P/E | 14.4 | 12.4 | 12.6 | 14.7 |
| P/B | 0.91 | 1.00 | 1.38 | 1.85 |
| Current Ratio | 0.74 | 0.78 | 0.65 | 0.70 |
| Quick Ratio | 0.74 | 0.78 | 0.65 | 0.70 |
| D/E | 1.06 | 1.13 | 1.10 | 0.76 |
| Debt-to-Assets | 11% | 11% | 11% | 7.2% |
| Interest Coverage | 0.96 | 0.26 | 0.27 | 0.34 |
| Asset Turnover | 0.049 | 0.082 | 0.095 | 0.083 |
| Fixed Asset Turnover | 6.1 | 10.7 | 12.1 | 11.0 |
| Dividend Yield | 3.7% | 3.6% | 2.7% | 2.1% |
Evolution of Financial Ratios
Return on Equity (ROE) showed moderate improvement, rising to 12.52% in 2025 from lower levels in prior years. The Current Ratio remained below 1.0, indicating weak short-term liquidity with slight fluctuations. Debt-to-Equity Ratio decreased to 0.76, reflecting a modest reduction in leverage. Profitability margins improved steadily, with net profit margin reaching 14.14%.
Are the Financial Ratios Favorable?
Profitability ratios like net margin and P/E ratio are favorable, reflecting efficient earnings generation and reasonable valuation. Liquidity ratios remain unfavorable, with current and quick ratios at 0.7, signaling potential short-term financial stress. Leverage ratios are neutral, with debt-to-equity at 0.76 and low debt-to-assets at 7.17%. Efficiency ratios show mixed signals, with low asset turnover but strong fixed asset turnover. Overall, the financial ratios present a neutral outlook.
Shareholder Return Policy
The Bank of New York Mellon Corporation maintains a consistent dividend policy with a payout ratio around 30-54% over recent years and a dividend yield near 2-3.7%. Dividend payments are supported by solid free cash flow coverage, and the company also engages in share buybacks.
This balanced approach signals prudent capital allocation. The dividend and buyback strategy appears sustainable, aligning with long-term shareholder value creation without overextending cash resources or risking financial flexibility.
Score analysis
Here is a radar chart illustrating the company’s key financial scores across valuation, profitability, and leverage metrics:
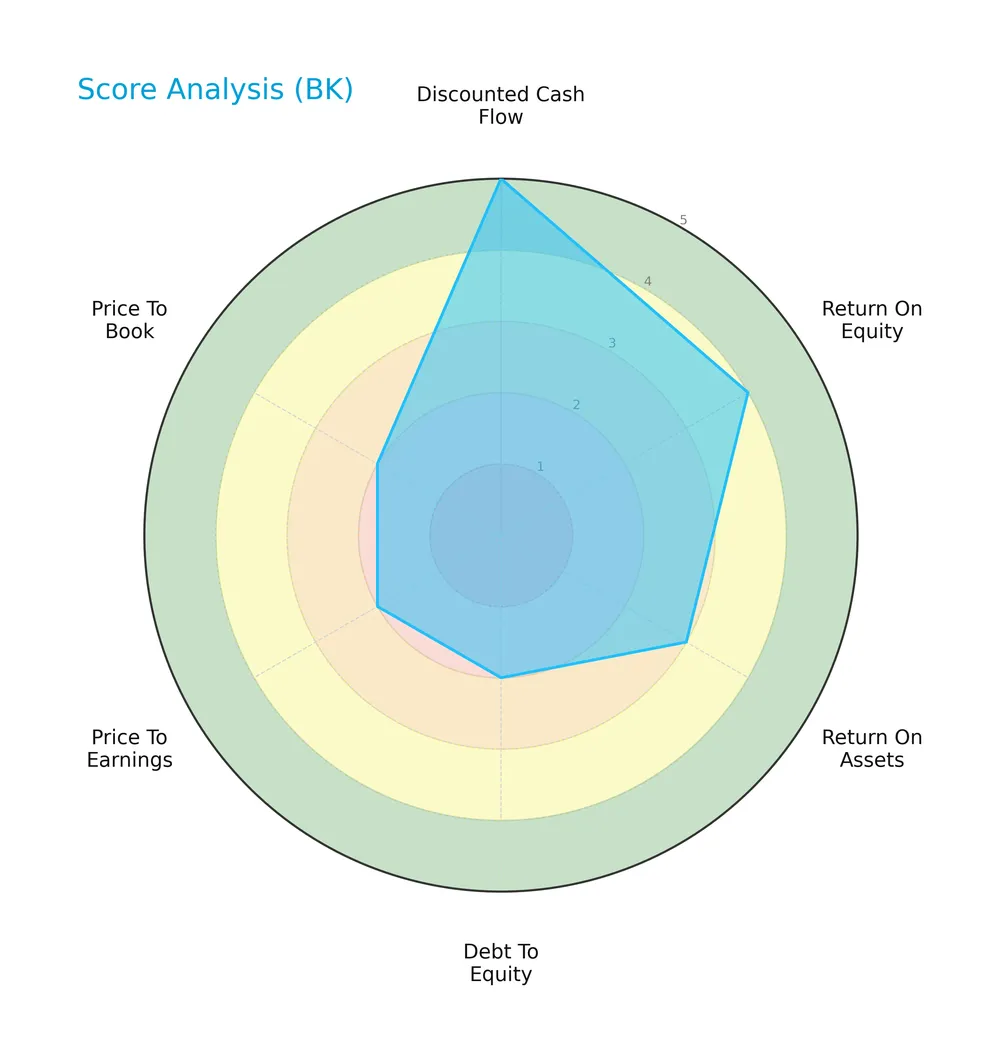
The company scores very favorably in discounted cash flow (5) and shows favorable return on equity (4). Return on assets is moderate (3). However, debt to equity, price to earnings, and price to book scores are unfavorable at 2 each, indicating valuation and leverage concerns.
Analysis of the company’s bankruptcy risk
The Altman Z-Score places the company deep in the distress zone, signaling a high risk of bankruptcy and financial distress:

Is the company in good financial health?
The Piotroski Score diagram highlights the company’s strong financial health based on profitability, liquidity, and efficiency metrics:

With a Piotroski Score of 7, the company demonstrates solid financial strength, suggesting it is fundamentally sound despite some balance sheet risks.
Competitive Landscape & Sector Positioning
This analysis explores The Bank of New York Mellon Corporation’s sector positioning and competitive dynamics. It examines strategic focus, revenue streams, key products, and main rivals. I will assess whether the company holds a competitive advantage within its industry.
Strategic Positioning
The Bank of New York Mellon maintains a diversified product portfolio across Securities Services, Market and Wealth Services, and Investment and Wealth Management. Geographically, it balances strong US revenue of $13B with significant international exposure, including $7B from non-US regions, supporting global client servicing.
Revenue by Segment
This pie chart illustrates The Bank of New York Mellon Corporation’s revenue distribution by segment for the fiscal year 2025, highlighting the key business drivers.
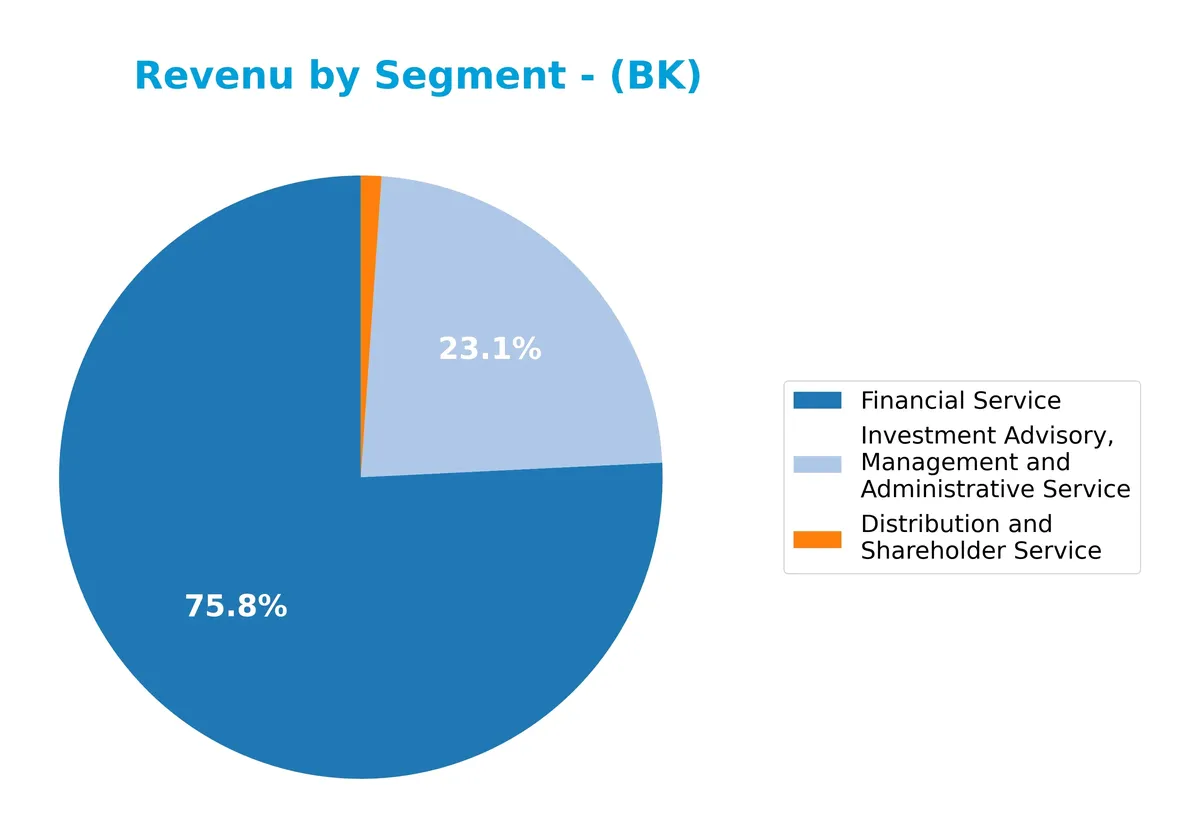
Financial Service dominates with $10.1B in revenue, underscoring its core role in the business. Investment Advisory, Management and Administrative Service follows at $3.1B, showing slight decline from prior years. Distribution and Shareholder Service remains a minor contributor at $146M. The 2025 data reveals steady growth in Financial Service, while advisory revenue shows a modest slowdown, signaling concentration risk in the primary segment.
Key Products & Brands
The Bank of New York Mellon Corporation offers a diverse range of financial services and solutions across several core segments:
| Product | Description |
|---|---|
| Securities Services | Custody, trust and depositary, accounting, ETFs, middle-office solutions, transfer agency, private equity, real estate funds, FX, securities lending, prime brokerage, data analytics, trustee, paying agency, fiduciary, escrow, issuer and support services for brokers and investors. |
| Market and Wealth Services | Clearing and custody, investment, wealth and retirement solutions, technology and enterprise data management, trading, prime brokerage, clearance and collateral management, integrated cash management including payments, FX, liquidity, receivables, payables, trade finance, and processing. |
| Investment and Wealth Management | Investment management strategies, distribution of investment products, custody, wealth and estate planning, private banking, investment, and information management services. |
| Distribution and Shareholder Service | Services supporting distribution and shareholder management, contributing modest revenue relative to other segments. |
| Financial Service | Broad financial service offerings, representing the largest revenue segment, encompassing various institutional and retail financial solutions. |
| Other Segments | Leasing, corporate treasury, derivative and other trading, corporate and bank-owned life insurance, renewable energy investment, and business exit services. |
The Bank of New York Mellon’s product portfolio spans custody to wealth management, with Financial Service as the dominant revenue driver. Its comprehensive service offering supports a wide client base, from institutional to high-net-worth individuals.
Main Competitors
There are 11 competitors in total; the table below lists the top 10 leaders by market capitalization:
| Competitor | Market Cap. |
|---|---|
| Blackstone Inc. | 191B |
| BlackRock, Inc. | 168B |
| KKR & Co. Inc. | 115B |
| The Bank of New York Mellon Corporation | 82B |
| Ares Management Corporation | 55B |
| Ameriprise Financial, Inc. | 46B |
| State Street Corporation | 36B |
| Northern Trust Corporation | 26B |
| T. Rowe Price Group, Inc. | 23B |
| Franklin Resources, Inc. | 12B |
The Bank of New York Mellon Corporation ranks 4th among its peers, holding 44.5% of the market cap of the sector leader, Blackstone Inc. It stands above both the average market cap of the top 10 competitors (75B) and the median sector market cap (46B). The company enjoys a 35.5% market cap premium over its closest competitor above, highlighting a solid mid-tier position in asset management.
Comparisons with competitors
Check out how we compare the company to its competitors:
Does BK have a competitive advantage?
The Bank of New York Mellon Corporation currently does not present a strong competitive advantage, as its ROIC remains below WACC, indicating value destruction despite improving profitability. The company’s overall moat status is slightly unfavorable, reflecting ongoing challenges in capital efficiency.
Looking ahead, BK’s diverse financial services across global markets, including Securities Services and Wealth Management, position it to capitalize on growth opportunities. Expansion in Asia Pacific and EMEA regions could drive future revenue gains amid rising demand for integrated cash and investment solutions.
SWOT Analysis
This analysis highlights The Bank of New York Mellon Corporation’s key internal and external factors to guide strategic decisions.
Strengths
- strong market position in asset management
- diversified global revenue streams
- favorable net margin and dividend yield
Weaknesses
- low current and quick ratios indicating liquidity risk
- ROIC below WACC signaling value destruction
- weak interest coverage ratio raising debt servicing concerns
Opportunities
- expanding wealth management and technology services
- growing international markets, especially Asia Pacific
- potential to improve operational efficiency and ROIC
Threats
- rising interest expenses impacting profitability
- regulatory and geopolitical risks in global markets
- intense competition in financial services
The company’s solid market presence and profitability offer a foundation for growth. However, liquidity constraints and value destruction caution a focus on improving capital efficiency and risk management.
Stock Price Action Analysis
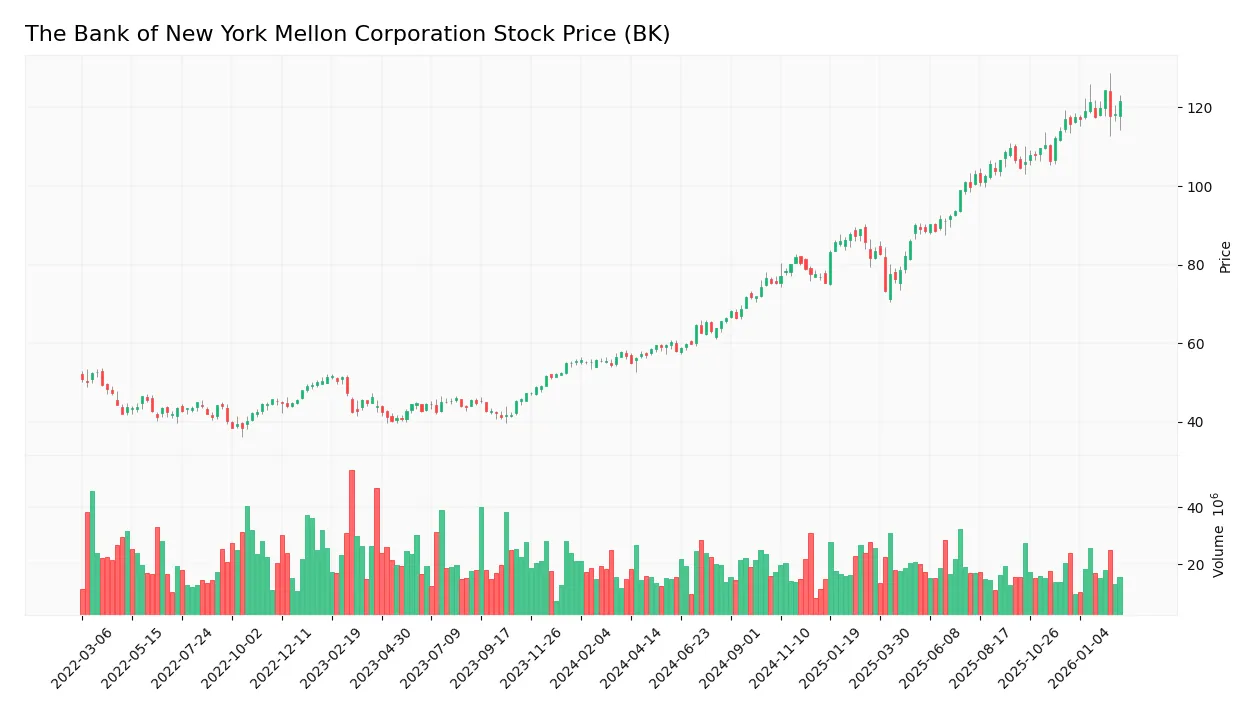
The following weekly stock chart illustrates The Bank of New York Mellon Corporation’s price movements over the past 12 months, highlighting key fluctuations and trend shifts:
Trend Analysis
Over the past 12 months, BK’s stock gained 114.33%, indicating a strong bullish trend. The price peaked at 124.32 and bottomed at 55.05, with volatility measured by a 19.78 standard deviation. Recent months show a decelerating uptrend, gaining 3.91% from mid-December 2025 to early March 2026.
Volume Analysis
In the last three months, trading volumes have decreased overall. Buyer volume dominates at 64.16%, reflecting buyer-driven activity. This declining volume amid buyer dominance suggests cautious optimism but lower market participation from sellers.
Target Prices
Analysts set a consensus target price indicating moderate upside potential for BK.
| Target Low | Target High | Consensus |
|---|---|---|
| 110 | 143 | 130.25 |
The target range suggests that analysts expect BK to trade between $110 and $143, with a consensus price near $130, reflecting cautious optimism.

Don’t Let Luck Decide Your Entry Point
Optimize your entry points with our advanced ProRealTime indicators. You’ll get efficient buy signals with precise price targets for maximum performance. Start outperforming now!
Analyst & Consumer Opinions
This section examines The Bank of New York Mellon Corporation’s analyst ratings and consumer feedback to gauge market sentiment.
Stock Grades
Here are the latest verified analyst grades for The Bank of New York Mellon Corporation from leading financial institutions:
| Grading Company | Action | New Grade | Date |
|---|---|---|---|
| Morgan Stanley | Maintain | Overweight | 2026-01-14 |
| Citigroup | Maintain | Neutral | 2026-01-14 |
| RBC Capital | Maintain | Sector Perform | 2026-01-14 |
| Wells Fargo | Maintain | Equal Weight | 2026-01-14 |
| Keefe, Bruyette & Woods | Maintain | Outperform | 2026-01-14 |
| TD Cowen | Maintain | Buy | 2026-01-07 |
| Truist Securities | Upgrade | Buy | 2026-01-07 |
| Barclays | Maintain | Overweight | 2026-01-05 |
Most analysts maintain a positive stance, with the majority rating the stock as Buy or Overweight. Truist Securities notably upgraded to Buy, reflecting an improving outlook.
Consumer Opinions
Consumer sentiment around The Bank of New York Mellon Corporation reveals a mix of appreciation for its stability and concerns about customer service responsiveness.
| Positive Reviews | Negative Reviews |
|---|---|
| Strong trust in the bank’s long-standing reputation | Slow response times from customer support |
| Efficient wealth management tools | Complex online platform navigation |
| Transparent fee structure | Limited branch accessibility |
Overall, customers praise BNY Mellon for its reliability and clear fees. However, recurring complaints about customer service delays and digital interface complexity signal areas needing urgent improvement.
Risk Analysis
Below is a summary of key risks facing The Bank of New York Mellon Corporation:
| Category | Description | Probability | Impact |
|---|---|---|---|
| Financial Health | Altman Z-Score in distress zone signals bankruptcy risk | High | High |
| Liquidity | Current and quick ratios at 0.7 indicate liquidity strain | Medium | Medium |
| Capital Cost | WACC at 19.66% far exceeds ROIC at 6.38%, value destruction | Medium | High |
| Interest Coverage | Interest coverage ratio very low at 0.34, risk on debt cost | Medium | High |
| Market Valuation | P/E and P/B scores unfavorable, may limit upside | Medium | Medium |
| Debt Management | Debt-to-equity ratio moderate but debt servicing weak | Medium | Medium |
I emphasize the Altman Z-Score as the most alarming risk, revealing a high bankruptcy likelihood despite a strong Piotroski score. The mismatch between WACC and ROIC signals poor capital allocation, a red flag in financial services. Liquidity constraints and weak interest coverage further heighten vulnerability amid rising rates. Investors must weigh these risks against favorable dividend yield and stable market position.
Should You Buy The Bank of New York Mellon Corporation?
The Bank of New York Mellon appears to be improving profitability with growing ROIC despite shedding value, suggesting a slightly unfavorable moat. Supported by a manageable leverage profile but mixed valuation metrics, its overall B+ rating indicates a very favorable, yet cautious, analytical profile.
Strength & Efficiency Pillars
The Bank of New York Mellon Corporation displays solid operational efficiency with a net margin of 14.14% and an EBIT margin near 18%. Its ROE stands at a moderate 12.52%, indicating reasonable shareholder returns. Despite a growing ROIC trend of 64.33%, the current ROIC of 6.38% falls short of its high WACC at 19.66%, signaling value destruction. Operational profitability remains a bright spot, but the company does not qualify as a value creator in its current capital structure.
Weaknesses and Drawbacks
The company is in financial distress, reflected by a perilous Altman Z-Score of 0.10, which signals a high bankruptcy risk. This solvency concern outweighs its profitability metrics. Additionally, interest coverage is critically low at 0.34, raising alarms about its ability to service debt. Liquidity is tight with a current ratio of 0.7, below the safe threshold. Valuation metrics are mixed but lean unfavorable, with a P/E of 14.74 and a P/B of 1.85, while debt-to-equity remains moderate at 0.76, limiting financial flexibility.
Our Final Verdict about The Bank of New York Mellon Corporation
Despite operational profitability and a strong Piotroski score of 7, the company’s solvency issues, as indicated by the distress zone Z-Score of 0.10, render its investment profile highly speculative. The risk of bankruptcy overshadows growth and margin improvements, making this a risky proposition for conservative capital. Investors might consider waiting for a clearer financial recovery signal before increasing exposure.
Disclaimer: This content is for informational purposes only and does not constitute financial, investment, or other professional advice. Investing in financial markets involves a significant risk of loss, and past performance is not indicative of future results.
Additional Resources
- Has The Market Run Too Far On Bank of New York Mellon Corporation (BK) After 43% One-Year Gain? – simplywall.st (Feb 27, 2026)
- The Bank of New York Mellon Corporation $BK Shares Sold by Artisan Partners Limited Partnership – MarketBeat (Feb 27, 2026)
- BNY Announces Pricing of Public Offering of $500,000,000 of Depositary Shares Representing Interests in Preferred Stock – PR Newswire (Feb 26, 2026)
- BNY offers 5.625% payout on $1,000 preferred shares until 2031 – Stock Titan (Feb 26, 2026)
- The Bank of New York Mellon Corporation (BK) Announces Proposed Public Offering of Depositary Shares – GuruFocus (Feb 26, 2026)
For more information about The Bank of New York Mellon Corporation, please visit the official website: bnymellon.com