Home > Analyses > Financial Services > The Allstate Corporation
The Allstate Corporation shapes how millions protect their most valuable assets daily. It dominates the U.S. property and casualty insurance market with a broad portfolio—from auto and homeowners coverage to specialty protection plans. Known for innovation and a trusted brand, Allstate continuously adapts to evolving risks and customer needs. As we dive into its financial health, the key question remains: does Allstate’s robust foundation still support its premium market valuation and future growth potential?

Table of contents
Business Model & Company Overview
The Allstate Corporation, founded in 1931 and headquartered in Northbrook, Illinois, stands as a leading force in the property and casualty insurance sector across the US and Canada. It weaves a comprehensive ecosystem of insurance products, spanning private auto, homeowners, specialty vehicles, and commercial lines, alongside consumer protection and health benefits. This broad yet integrated approach defines its core mission: to safeguard customers’ assets and well-being through diverse yet interconnected solutions.
Allstate’s revenue engine balances traditional insurance premiums with recurring service revenues from protection plans, roadside assistance, and data-driven analytics. It leverages a multi-channel distribution network including agencies, brokers, and digital platforms to reach a wide audience across the Americas. This strategic diversification and geographic reach fortify its economic moat, positioning it as a vital industry shaper with resilient competitive advantages.
Financial Performance & Fundamental Metrics
I analyze The Allstate Corporation’s income statement, key financial ratios, and dividend payout policy to assess its core financial health and shareholder value.
Income Statement
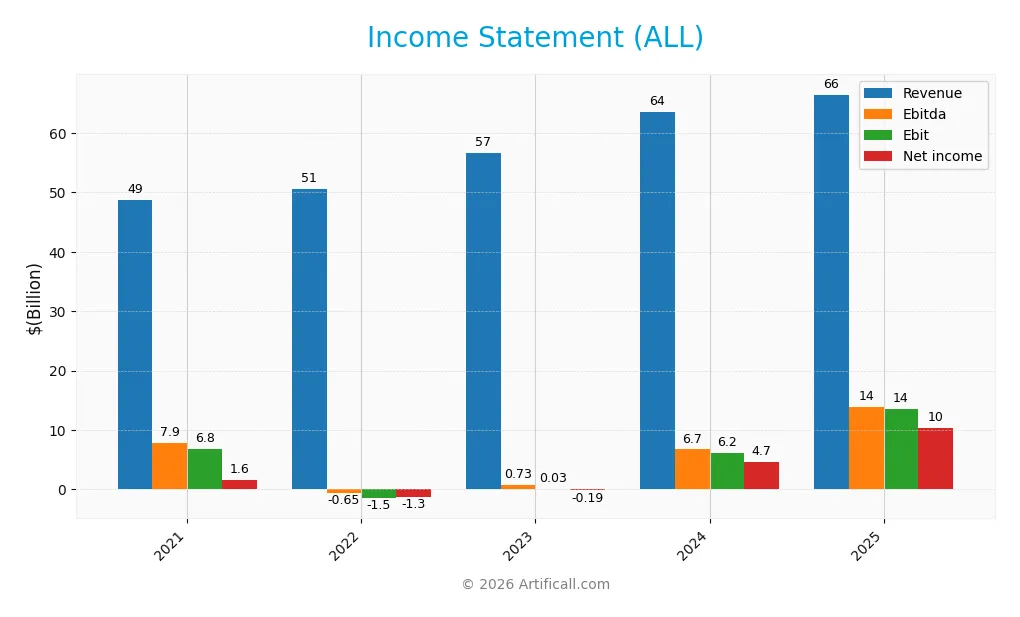
The following table presents The Allstate Corporation’s income statement figures for fiscal years 2021 through 2025, reflecting key profitability and expense metrics.
| 2021 | 2022 | 2023 | 2024 | 2025 | |
|---|---|---|---|---|---|
| Revenue | 48.7B | 50.6B | 56.6B | 63.5B | 66.5B |
| Cost of Revenue | 36.6B | 44.9B | 49.4B | 49.0B | 44.4B |
| Operating Expenses | 5.57B | 7.51B | 7.52B | 8.74B | 8.93B |
| Gross Profit | 12.0B | 5.68B | 7.17B | 14.5B | 22.1B |
| EBITDA | 7.88B | -648M | 735M | 6.72B | 13.9B |
| EBIT | 6.80B | -1.50B | 31M | 6.16B | 13.6B |
| Interest Expense | 330M | 335M | 379M | 400M | 399M |
| Net Income | 1.61B | -1.29B | -188M | 4.67B | 10.3B |
| EPS | 17.5 | -5.03 | -1.20 | 17.2 | 38.7 |
| Filing Date | 2022-02-18 | 2023-02-16 | 2024-02-21 | 2025-02-24 | 2026-02-20 |
Income Statement Evolution
From 2021 to 2025, The Allstate Corporation’s revenue grew 36.5%, showing steady expansion. Net income surged more than fivefold, reflecting major margin improvement. Gross margin climbed to 33.2%, while EBIT margin reached 20.4%. Operating expenses grew in line with revenue, supporting efficient cost management. Overall, profitability metrics strengthened significantly over the period.
Is the Income Statement Favorable?
In 2025, Allstate reported $66.5B in revenue and $10.3B in net income, delivering a net margin of 15.5%. EBIT margin stood at 20.4%, supported by low interest expense at 0.6% of revenue. Strong one-year growth in EPS and net margin confirms positive earnings momentum. The income statement fundamentals appear favorable, with robust profitability and controlled expenses.
Financial Ratios
The following table summarizes key financial ratios for The Allstate Corporation across the last five fiscal years:
| Ratios | 2021 | 2022 | 2023 | 2024 | 2025 |
|---|---|---|---|---|---|
| Net Margin | 3.3% | -2.5% | -0.3% | 7.3% | 15.5% |
| ROE | 6.4% | -7.4% | -1.1% | 21.8% | 33.6% |
| ROIC | 5.2% | -1.4% | -0.2% | 4.1% | 9.2% |
| P/E | 21.5 | -28.5 | -195.5 | 10.9 | 5.3 |
| P/B | 1.38 | 2.10 | 2.07 | 2.38 | 1.78 |
| Current Ratio | 0 | 0 | 0 | 0 | 0 |
| Quick Ratio | 0 | 0 | 0 | 0 | 0 |
| D/E | 0.32 | 0.46 | 0.45 | 0.38 | 0.24 |
| Debt-to-Assets | 8.0% | 8.1% | 7.7% | 7.2% | 6.7% |
| Interest Coverage | 19.6 | -5.5 | -0.9 | 14.4 | 33.0 |
| Asset Turnover | 0.49 | 0.52 | 0.55 | 0.57 | 0.60 |
| Fixed Asset Turnover | 51.8 | 51.3 | 65.9 | 94.9 | 106.0 |
| Dividend Yield | 2.9% | 2.8% | 2.8% | 2.1% | 1.9% |
Evolution of Financial Ratios
From 2021 to 2025, Allstate’s Return on Equity (ROE) surged from 6.41% to 33.59%, signaling robust profitability improvement. The Debt-to-Equity ratio steadily decreased from 0.32 to 0.24, indicating reduced financial leverage. However, the Current Ratio remained at zero, reflecting persistent liquidity concerns despite rising profitability.
Are the Financial Ratios Favorable?
In 2025, Allstate’s profitability metrics are strong, with a net margin of 15.47% and ROE at 33.59%, both favorable. Leverage is conservative, shown by a debt-to-equity ratio of 0.24. Liquidity ratios are unfavorable, with current and quick ratios at zero. Asset turnover is neutral at 0.6, while valuation metrics like P/E at 5.29 are favorable. Overall, the financial ratios lean favorably but highlight liquidity risks.
Shareholder Return Policy
The Allstate Corporation maintains a consistent dividend policy, with a payout ratio around 10% in 2025 and a dividend yield near 1.9%. Dividends per share have slightly decreased from 4.08 in 2024 to 4 in 2025, supported by strong free cash flow coverage, indicating prudent capital allocation.
Additionally, the company engages in share buybacks, balancing returns to shareholders. This distribution approach appears sustainable given Allstate’s solid operating margins and cash flow generation, supporting long-term shareholder value without risking excessive payouts or leverage.
Score analysis
The radar chart below presents key financial scores assessing value, profitability, and leverage for The Allstate Corporation:
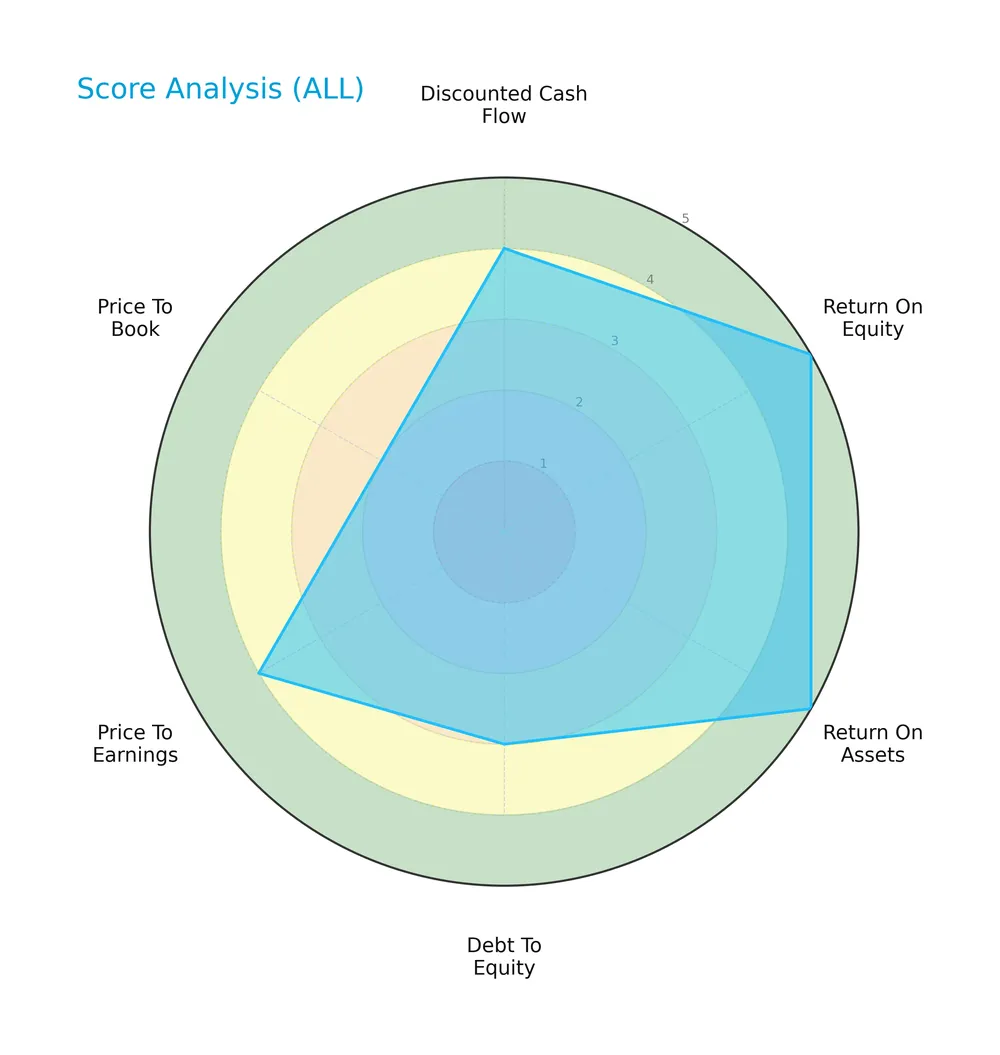
The company scores very favorably on return on equity (5) and return on assets (5). It maintains favorable discounted cash flow (4) and price-to-earnings (4) scores. Debt-to-equity stands at a moderate 3, while price-to-book appears unfavorable at 2.
Analysis of the company’s bankruptcy risk
The Altman Z-Score situates the company in the grey zone, indicating a moderate risk of financial distress and bankruptcy:

Is the company in good financial health?
The Piotroski Score chart evaluates the company’s financial strength based on profitability, leverage, liquidity, and efficiency criteria:

With a Piotroski Score of 6, the company shows average financial health, suggesting moderate strength but room for improvement in key fundamentals.
Competitive Landscape & Sector Positioning
This analysis explores The Allstate Corporation’s strategic position within the property and casualty insurance sector. It examines revenue sources, key products, and competitive dynamics. I will assess whether Allstate holds a meaningful competitive advantage over its main rivals.
Strategic Positioning
The Allstate Corporation concentrates heavily on property and casualty insurance, generating $59.7B in 2025, with smaller but growing segments in Protection Services ($3.55B) and Health and Benefits ($676M). Its geographic exposure is primarily U.S.-centric, with over $54.6B revenue, and limited international presence.
Revenue by Segment
This pie chart presents The Allstate Corporation’s revenue distribution by segment for the fiscal year 2025, highlighting the relative scale of each business line.
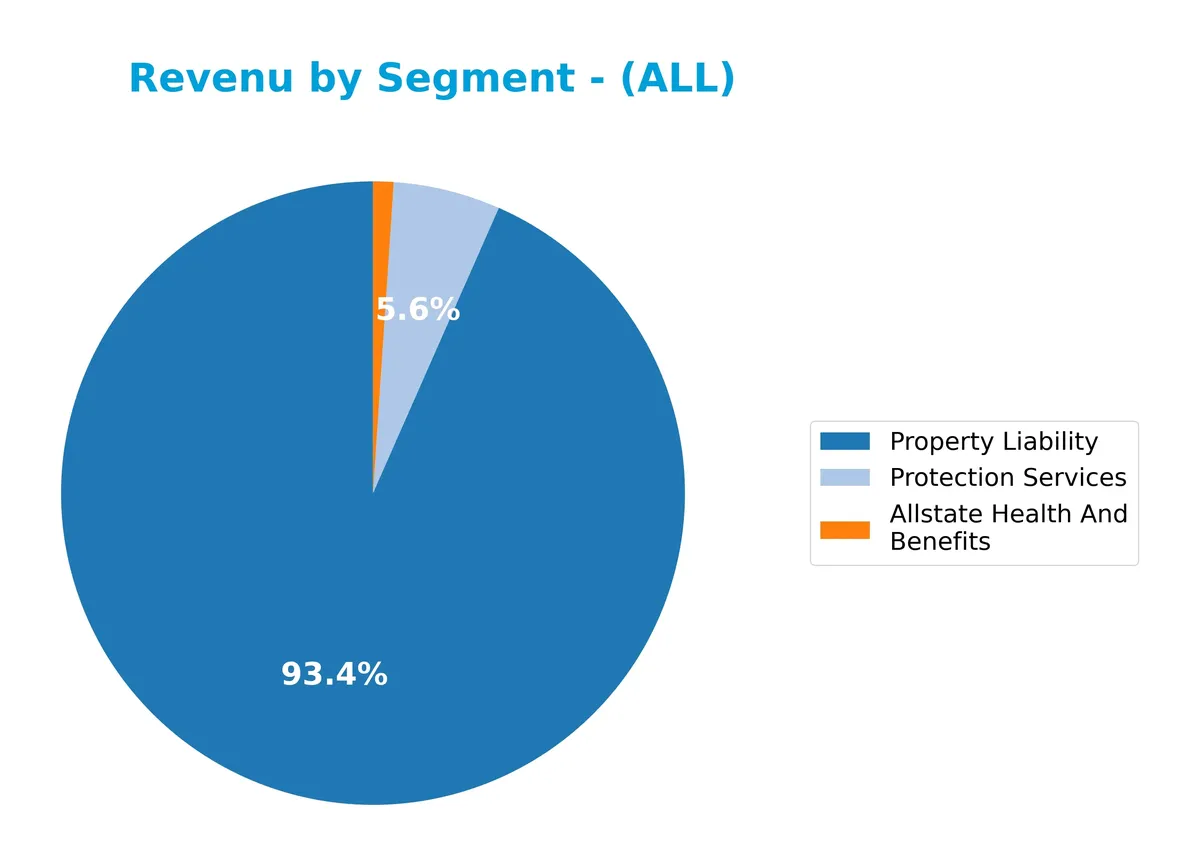
In 2025, Property Liability dominates with $59.7B, reflecting Allstate’s core insurance strength. Protection Services contribute $3.55B, showing steady growth as a complementary segment. Allstate Health And Benefits dropped sharply to $676M from $2.54B in 2024, signaling potential volatility or strategic shifts. The heavy reliance on Property Liability underscores concentration risk but also reinforces Allstate’s moat in property and casualty insurance.
Key Products & Brands
The Allstate Corporation operates through distinct product lines and brand segments, detailed below:
| Product | Description |
|---|---|
| Allstate Protection | Offers private passenger auto, homeowners, specialty auto (motorcycle, trailer, motor home), and other personal lines insurance. Includes commercial lines under Allstate and Encompass brands. |
| Protection Services | Provides consumer product protection plans, vehicle service contracts, roadside assistance, data and analytic solutions, and identity protection. Brands include Allstate Protection Plans, Dealer Services, Roadside Services, Arity, and Identity Protection. |
| Allstate Health and Benefits | Delivers life, accident, critical illness, short-term disability, and other health insurance products. |
| Run-off Property-Liability | Offers property and casualty insurance in run-off operations. |
The company’s product portfolio spans core property and casualty insurance alongside diversified protection services and health benefits. This multi-segment approach balances traditional underwriting with growing service-oriented revenue streams.
Main Competitors
There are 7 total competitors, with the table below listing the top 7 leaders by market capitalization:
| Competitor | Market Cap. |
|---|---|
| The Progressive Corporation | 124.4B |
| Chubb Limited | 124.1B |
| The Travelers Companies, Inc. | 64.4B |
| The Allstate Corporation | 53.9B |
| W. R. Berkley Corporation | 26.4B |
| Cincinnati Financial Corporation | 25.2B |
| Loews Corporation | 21.6B |
The Allstate Corporation ranks 4th among its competitors. Its market cap is 43.4% of the leader’s, The Progressive Corporation. Allstate sits below the average market cap of the top 10 competitors (62.9B) but above the sector median (53.9B). It maintains a 19.3% market cap gap over its closest rival above it.
Comparisons with competitors
Check out how we compare the company to its competitors:
Does ALL have a competitive advantage?
The Allstate Corporation presents a sustainable competitive advantage. Its return on invested capital exceeds its cost of capital by 4.6%, with a strong upward ROIC trend, indicating efficient capital use and value creation.
Looking ahead, Allstate’s diversified insurance products and expanding protection services in the U.S. and Canada position it well. Opportunities include growth in specialty lines and data-driven services, supporting continued profitability gains.
SWOT Analysis
This analysis highlights The Allstate Corporation’s key strategic factors to inform investment decisions.
Strengths
- strong market position in US property & casualty insurance
- diverse product portfolio across multiple insurance lines
- very favorable financial metrics with growing ROIC and strong profitability
Weaknesses
- low liquidity ratios signaling potential short-term financial stress
- limited international revenue exposure
- moderate debt-to-equity ratio limiting financial flexibility
Opportunities
- expanding protection services and telematics data analytics
- rising demand for health and benefits insurance products
- potential for geographic expansion outside the US
Threats
- intense competition in insurance sector
- regulatory changes affecting underwriting and pricing
- impact of climate change on property and casualty claims
Allstate’s solid franchise and improving profitability create a durable competitive advantage. However, liquidity concerns and limited global footprint require cautious capital management and strategic expansion. The company must leverage emerging opportunities while mitigating industry and regulatory risks.
Stock Price Action Analysis
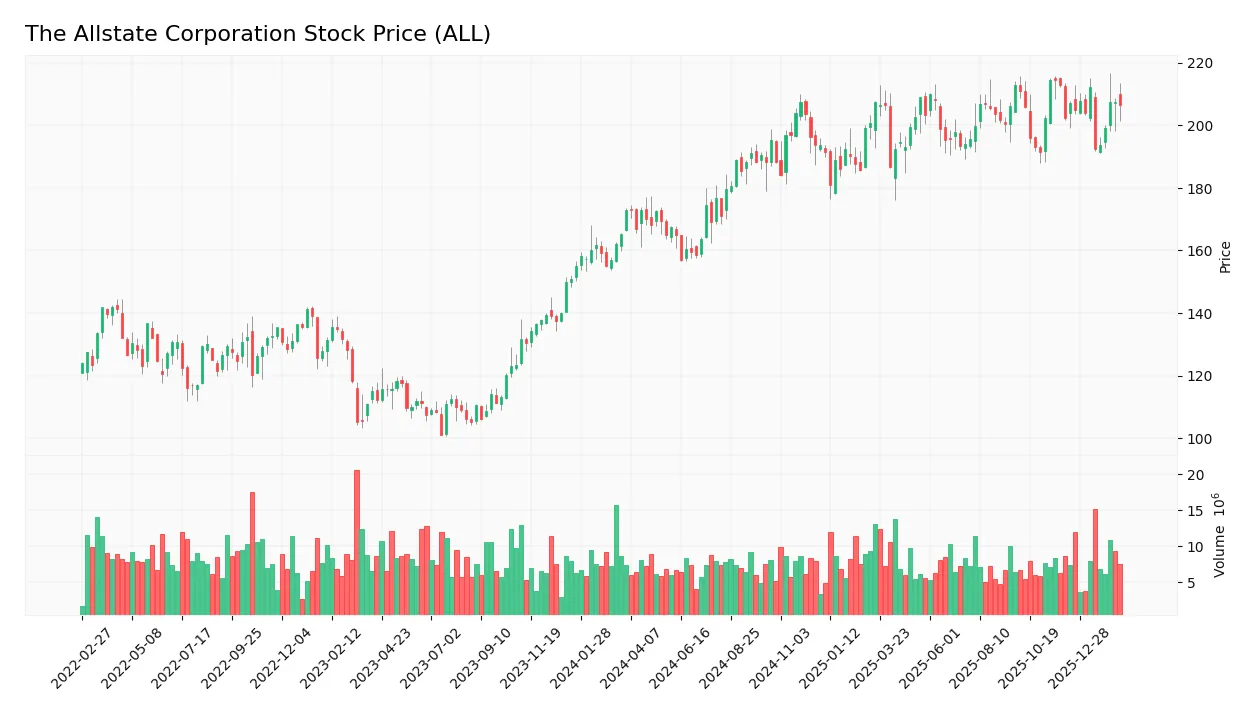
The weekly stock chart for The Allstate Corporation (ALL) reveals price movements and volatility patterns over the past 12 months:
Trend Analysis
Over the past year, ALL’s stock price rose 19.28%, confirming a bullish trend with decelerating momentum. The price fluctuated between 157.07 and 214.32. Despite a 14.68 volatility level, the trend remains positive but slower. The recent 2.03% gain over two and a half months suggests a neutral near-term trend.
Volume Analysis
Trading volume increased overall, with buyers accounting for 51.64% of activity. However, in the recent period, sellers dominated 56.88%, indicating a slight shift to seller-driven volume. This suggests cautious investor sentiment and increased market participation amid uncertainty.
Target Prices
Analysts set a consensus target price for The Allstate Corporation, reflecting a balanced outlook.
| Target Low | Target High | Consensus |
|---|---|---|
| 215 | 281 | 239.57 |
The target range from 215 to 281 signals moderate optimism. The consensus near 240 suggests steady appreciation potential.

Don’t Let Luck Decide Your Entry Point
Optimize your entry points with our advanced ProRealTime indicators. You’ll get efficient buy signals with precise price targets for maximum performance. Start outperforming now!
Analyst & Consumer Opinions
This section reviews The Allstate Corporation’s recent analyst ratings alongside key consumer feedback and sentiment trends.
Stock Grades
The following table presents recent verified analyst grades for The Allstate Corporation, illustrating current market sentiment:
| Grading Company | Action | New Grade | Date |
|---|---|---|---|
| Keefe, Bruyette & Woods | Maintain | Outperform | 2026-02-11 |
| Citigroup | Maintain | Neutral | 2026-02-10 |
| Mizuho | Maintain | Outperform | 2026-02-09 |
| Wells Fargo | Maintain | Equal Weight | 2026-02-06 |
| JP Morgan | Maintain | Overweight | 2026-02-05 |
| Cantor Fitzgerald | Maintain | Neutral | 2026-02-05 |
| Wells Fargo | Maintain | Equal Weight | 2026-01-13 |
| TD Cowen | Downgrade | Hold | 2026-01-12 |
| Keefe, Bruyette & Woods | Maintain | Outperform | 2026-01-06 |
| William Blair | Downgrade | Market Perform | 2025-12-18 |
Most analysts maintain a neutral to moderately positive stance, with several Outperform and Overweight ratings. Recent downgrades suggest increased caution, reflecting a balanced but watchful market view.
Consumer Opinions
Consumers express a mix of trust and frustration toward The Allstate Corporation, reflecting its complex service landscape.
| Positive Reviews | Negative Reviews |
|---|---|
| Responsive customer service during claims process | Slow claim settlements causing dissatisfaction |
| Comprehensive coverage options tailored to needs | Premiums perceived as high compared to competitors |
| User-friendly digital tools improve policy management | Occasional communication lapses reported |
Overall, customers appreciate Allstate’s strong coverage and helpful support. However, recurring concerns about claim delays and pricing transparency temper enthusiasm.
Risk Analysis
Below is an overview of key risk factors for The Allstate Corporation, highlighting their likelihood and potential impact:
| Category | Description | Probability | Impact |
|---|---|---|---|
| Liquidity Risk | Current and quick ratios are zero, signaling potential short-term liquidity challenges. | Medium | High |
| Financial Distress | Altman Z-Score in the grey zone at 2.31, indicating moderate bankruptcy risk. | Medium | Medium |
| Market Volatility | Low beta of 0.235 suggests limited sensitivity to market swings but may limit upside. | Low | Low |
| Valuation Risk | Price-to-book ratio at 1.78 is neutral, but price-to-earnings is low, indicating possible undervaluation. | Medium | Medium |
| Debt Levels | Favorable debt-to-equity at 0.24 and debt-to-assets at 6.73%, indicating manageable leverage. | Low | Low |
The most pressing risk is Allstate’s liquidity, with unfavorable current and quick ratios signaling potential cash constraints. The moderate Altman Z-Score warns against complacency in financial health, especially in a volatile insurance sector. Despite strong profitability and low leverage, these liquidity concerns require close monitoring.
Should You Buy The Allstate Corporation?
The Allstate Corporation appears to be a profitable company with growing operational efficiency and a durable competitive moat supported by rising ROIC well above WACC. Despite a moderate leverage profile and a grey zone Altman Z-Score, the overall A rating suggests a favorable investment profile.
Strength & Efficiency Pillars
The Allstate Corporation delivers solid operational efficiency, reflected in a net margin of 15.47% and a return on equity of 33.59%. Its return on invested capital stands at 9.23%, comfortably above the 4.58% weighted average cost of capital, confirming the company as a clear value creator. The growing ROIC trend underscores a sustainable competitive advantage. Favorable gross and EBIT margins (33.23% and 20.4%, respectively) further highlight its profitability and cost discipline.
Weaknesses and Drawbacks
The Altman Z-Score at 2.31 places Allstate in the “grey zone,” signaling moderate solvency risk that warrants caution. The current and quick ratios are notably unfavorable at 0, suggesting potential liquidity constraints. Although leverage is moderate with a debt-to-equity ratio of 0.24, the price-to-book ratio at 1.78 is neutral, not offering a strong valuation cushion. Recent market activity shows a slightly seller-dominant trend, with buyer dominance at 43.12%, indicating short-term pressure.
Our Final Verdict about The Allstate Corporation
Despite encouraging profitability and value creation, the grey zone Altman Z-Score introduces solvency uncertainty that investors cannot ignore. The bullish long-term trend contrasts with recent seller dominance, suggesting that while the fundamentals could support long-term exposure, a cautious wait-and-see approach for a better entry point may be prudent. Overall, the profile might appear appealing but carries moderate risk.
Disclaimer: This content is for informational purposes only and does not constitute financial, investment, or other professional advice. Investing in financial markets involves a significant risk of loss, and past performance is not indicative of future results.
Additional Resources
- Stevens Capital Management LP Acquires 5,864 Shares of The Allstate Corporation $ALL – MarketBeat (Feb 21, 2026)
- Allstate announces preferred dividends payable April 15, 2026 – PR Newswire (Feb 20, 2026)
- Decoding Allstate Corp (ALL): A Strategic SWOT Insight – GuruFocus (Feb 21, 2026)
- Tredje AP fonden Acquires 33,000 Shares of The Allstate Corporation $ALL – MarketBeat (Feb 21, 2026)
- Wells Fargo Raises its Price Target on The Allstate Corporation (ALL) to $228 – Yahoo Finance (Feb 09, 2026)
For more information about The Allstate Corporation, please visit the official website: allstate.com