Home > Analyses > Utilities > The AES Corporation
The AES Corporation powers millions of homes and industries worldwide, shaping how energy fuels modern life. With a diverse generation portfolio spanning coal, gas, renewables, and cutting-edge storage technologies, AES stands at the forefront of the utilities sector. Its global reach and commitment to innovation underscore its influence and resilience. As energy markets evolve rapidly, I ask: does AES’s fundamental strength justify its current valuation and growth prospects?

Table of contents
Business Model & Company Overview
The AES Corporation, founded in 1981 and headquartered in Arlington, Virginia, stands as a dominant force in the diversified utilities sector. It operates a vast power generation and utility ecosystem, delivering electricity through a mix of coal, gas, hydro, wind, solar, biomass, and renewables. This integrated approach serves a broad customer base, from industrial users to residential and governmental sectors, creating a cohesive energy platform across multiple markets.
AES generates value with a balanced portfolio of power plants and utility operations, managing approximately 31,459 MW of generation capacity. Its footprint spans the Americas, Europe, and Asia, optimizing revenue through wholesale markets and direct electricity sales. The company’s competitive advantage lies in its diverse fuel mix and global reach, underpinning its role as a key architect of the energy transition worldwide.
Financial Performance & Fundamental Metrics
I will analyze The AES Corporation’s income statement, key financial ratios, and dividend payout policy to assess its operational efficiency and shareholder value.
Income Statement
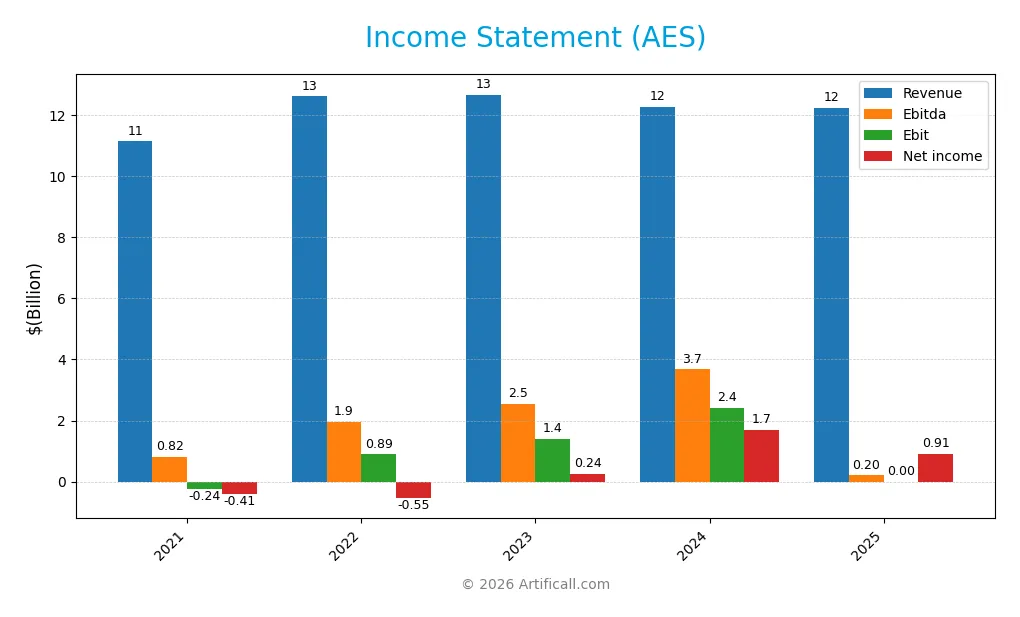
Below is The AES Corporation’s Income Statement summary for fiscal years 2021 to 2025, showing key profitability and expense metrics in USD.
| 2021 | 2022 | 2023 | 2024 | 2025 | |
|---|---|---|---|---|---|
| Revenue | 11.14B | 12.62B | 12.68B | 12.28B | 12.23B |
| Cost of Revenue | 8.43B | 10.07B | 10.16B | 9.96B | 0 |
| Operating Expenses | 166M | 207M | 255M | 288M | 241M |
| Gross Profit | 2.71B | 2.55B | 2.52B | 2.32B | 0 |
| EBITDA | 818M | 1.94B | 2.53B | 3.68B | 201M |
| EBIT | -238M | 890M | 1.41B | 2.41B | 0 |
| Interest Expense | 826M | 1.06B | 1.30B | 1.52B | -1.41B |
| Net Income | -413M | -546M | 242M | 1.69B | 910M |
| EPS | -0.61 | -0.82 | 0.37 | 2.38 | 0 |
| Filing Date | 2022-02-28 | 2023-03-01 | 2024-02-26 | 2025-03-11 | 2026-03-02 |
Income Statement Evolution
From 2021 to 2025, AES’s revenue increased moderately by 9.8%, peaking near 12.7B before dipping slightly to 12.2B in 2025. Net income showed strong growth overall, rising over 320%, but declined sharply in the most recent year. Margins weakened in 2025, with gross and EBIT margins falling to zero, signaling margin compression and volatility.
Is the Income Statement Favorable?
In 2025, AES reported 12.23B revenue and 910M net income, yielding a 7.4% net margin, which remains favorable despite margin erosion. Interest expense improved significantly, lowering financing costs. However, the absence of gross profit and EBIT data marks a red flag on profitability quality. The mix of favorable net margin and weak operating metrics results in a neutral fundamental assessment.
Financial Ratios
The table below presents key financial ratios for The AES Corporation across recent fiscal years, offering a snapshot of profitability, liquidity, leverage, and market valuation:
| Ratios | 2021 | 2022 | 2023 | 2024 | 2025 |
|---|---|---|---|---|---|
| Net Margin | -3.7% | -4.3% | 1.9% | 13.7% | 7.4% |
| ROE | -14.8% | -22.4% | 9.7% | 46.3% | 22.4% |
| ROIC | 7.6% | 7.0% | -15.1% | 4.5% | -2.5% |
| P/E | -39.5x | -35.1x | 53.2x | 5.4x | 0 |
| P/B | 5.8x | 7.9x | 5.2x | 2.5x | 0 |
| Current Ratio | 1.13 | 1.18 | 0.68 | 0.80 | 0.25 |
| Quick Ratio | 1.00 | 1.01 | 0.61 | 0.73 | 0.25 |
| D/E | 6.7x | 9.6x | 10.8x | 8.0x | 1.7x |
| Debt-to-Assets | 57% | 61% | 60% | 61% | 58% |
| Interest Coverage | 3.1x | 2.2x | 1.7x | 1.3x | -0.1x |
| Asset Turnover | 0.34 | 0.33 | 0.28 | 0.26 | 1.03 |
| Fixed Asset Turnover | 0.56 | 0.55 | 0.42 | 0.37 | 0 |
| Dividend Yield | 2.5% | 2.2% | 3.4% | 5.3% | 0 |
Evolution of Financial Ratios
From 2021 to 2025, AES’s Return on Equity (ROE) improved substantially, reaching 22.4% in 2025. The Current Ratio declined sharply, dropping from above 1.1 in earlier years to 0.25 in 2025, signaling weakening liquidity. Debt-to-Equity Ratio remained high, around 1.7 in 2025, indicating persistent leverage. Profitability showed mixed signals, with some improvement but instability overall.
Are the Financial Ratios Fovorable?
In 2025, AES’s profitability is neutral with a 7.44% net margin but ROE is favorable at 22.4%, surpassing many industry peers. Liquidity ratios, including Current and Quick Ratios at 0.25, are unfavorable and raise concerns. Leverage is significant, with a 58.3% debt-to-assets ratio and poor interest coverage. Asset turnover at 1.03 is favorable, yet overall, 57% of ratios are unfavorable, suggesting caution.
Shareholder Return Policy
The AES Corporation maintains a dividend payout ratio around 55%, with a stable dividend per share near 0.66-0.68 USD in recent years. Despite a zero dividend yield reported for 2025, previous years show a yield above 3%, supported partially by free cash flow coverage and moderate share buybacks.
The policy balances distributions with ongoing investments, though free cash flow has been negative recently, signaling potential risk in sustaining payouts without increased cash generation. This approach reflects a cautious attempt to support shareholder returns while managing capital expenditures and debt, aiming for long-term value creation.
Score analysis
The following radar chart illustrates The AES Corporation’s key financial scores across multiple valuation and profitability metrics:

The company scores very favorably in discounted cash flow, return on equity, and return on assets. However, its debt-to-equity ratio is unfavorable. Valuation multiples, including price-to-earnings and price-to-book, rank very unfavorably, indicating market concerns.
Analysis of the company’s bankruptcy risk
The Altman Z-Score places the company in the grey zone, signaling a moderate risk of bankruptcy and financial uncertainty:

Is the company in good financial health?
The Piotroski Score diagram highlights the company’s financial strength based on nine critical criteria:

With a very strong Piotroski Score of 8, the company demonstrates robust financial health, signaling solid profitability, efficiency, and liquidity fundamentals.
Competitive Landscape & Sector Positioning
This section examines The AES Corporation’s strategic positioning, revenue segments, key products, and main competitors. I will assess whether AES holds a sustainable competitive advantage within the diversified utilities sector.
Strategic Positioning
The AES Corporation operates a diversified utility portfolio spanning generation, renewables, and energy infrastructure. It maintains broad geographic exposure across the Americas, Europe, and Asia, with significant revenue from the US (4.7B in 2024) and Latin America. This mix balances traditional and emerging energy sources.
Revenue by Segment
The pie chart displays The AES Corporation’s revenue distribution by segment for the fiscal year 2025, highlighting the company’s primary income sources and their relative sizes.
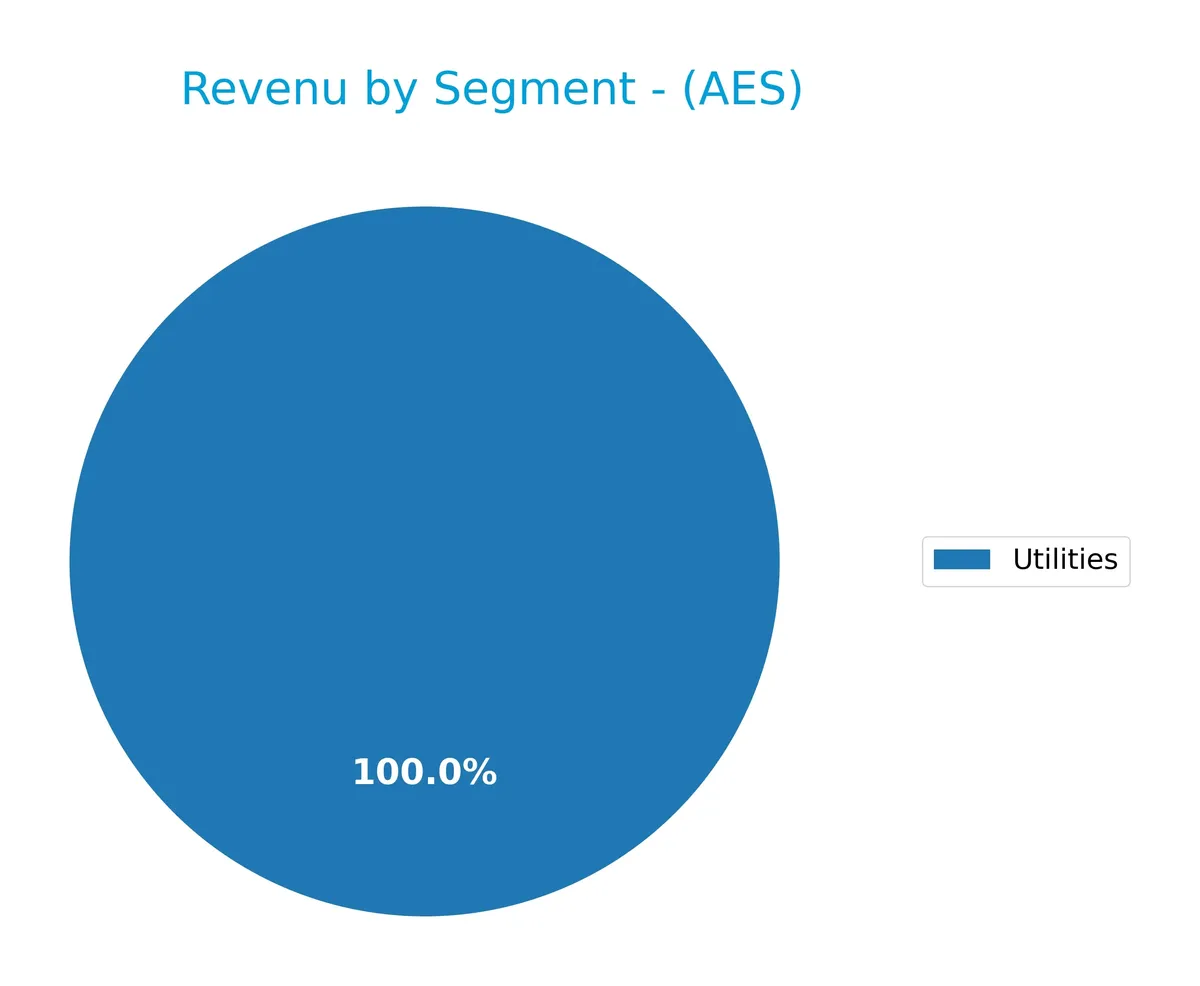
In 2025, Utilities generated $4.0B, the sole reported segment. This marks a shift from prior years where Energy Infrastructure and Renewables contributed significantly. The absence of these segments in 2025 data suggests a possible reorganization or reporting change. Utilities now dominate revenue, indicating concentration risk but also reflecting AES’s strategic focus on stable, regulated assets. Investors should watch for segment diversification in upcoming reports.
Key Products & Brands
The AES Corporation’s key products and brands span power generation, utilities, and renewable energy segments:
| Product | Description |
|---|---|
| Electricity Generation | Generation of electricity using coal, gas, hydro, wind, solar, biomass, and landfill gas. |
| Electric Distribution | Distribution, transmission, and sale of electricity to residential, commercial, industrial, and governmental customers. |
| Energy Infrastructure | Assets and services supporting power generation and delivery infrastructure. |
| Renewables | Renewable energy sources including solar, wind, energy storage, and biomass. |
| New Energy Technologies | Emerging technologies in energy, including advanced storage and innovative generation methods. |
AES operates a diversified portfolio across multiple geographies, with a strong focus on a balanced generation mix and expanding renewables. This mix supports resilience amid evolving energy markets and regulatory environments.
Main Competitors
The Utilities sector includes 2 main competitors, with the table listing the top 10 leaders by market capitalization:
| Competitor | Market Cap. |
|---|---|
| Sempra | 58.6B |
| The AES Corporation | 10.6B |
The AES Corporation ranks 2nd among its competitors, holding 17.3% of the market cap of the leader, Sempra. It sits below both the average market cap of the top 10 and the median market cap for the sector. AES maintains a substantial 478.6% market cap gap from Sempra, indicating a significant scale difference with its closest rival.
Comparisons with competitors
Check out how we compare the company to its competitors:
Does AES have a competitive advantage?
AES currently lacks a competitive advantage, as its return on invested capital (ROIC) falls significantly below its weighted average cost of capital (WACC). The company shows a sharp decline in ROIC, indicating value destruction and deteriorating profitability over the 2021-2025 period.
Looking ahead, AES operates a diverse power generation portfolio across multiple regions and fuels, including renewables and energy storage. This geographic and technological breadth offers potential opportunities for growth and adaptation in evolving energy markets.
SWOT Analysis
This SWOT analysis highlights The AES Corporation’s key internal and external factors shaping its strategic outlook.
Strengths
- diversified power generation portfolio
- strong ROE at 22.4%
- very strong Piotroski score of 8
Weaknesses
- declining ROIC well below WACC
- weak liquidity ratios (current and quick ratio at 0.25)
- high debt load with D/E of 1.71
Opportunities
- expanding renewables and energy storage markets
- growth potential in Latin America and Asia
- rising global demand for cleaner energy
Threats
- regulatory risks in multiple jurisdictions
- commodity price volatility impacting fuel costs
- intense competition and technological disruption
AES’s strengths in diversification and profitability contrast with its value-destructive capital returns and liquidity risks. Its strategy must focus on reducing leverage and enhancing ROIC while capitalizing on renewable energy growth to mitigate regulatory and market threats.
Stock Price Action Analysis
The upcoming weekly chart highlights The AES Corporation’s stock price movements over the past 12 months, illustrating key highs, lows, and volatility trends:

Trend Analysis
Over the past year, AES’s stock declined sharply by 15.67%, indicating a bearish trend with accelerating downward momentum. The price ranged between 21.59 and 9.93, reflecting elevated volatility (2.93 std dev). However, a recent rebound of 5.03% over the last two and a half months suggests a nascent recovery phase.
Volume Analysis
Trading volume has increased, with buyers accounting for 51.09% overall. Over the recent three months, buyer dominance strengthened to 61.81%, signaling strong buyer-driven activity and growing investor interest in the stock. This volume trend supports a potential shift in market sentiment.
Target Prices
Analysts present a moderately optimistic target consensus for The AES Corporation.
| Target Low | Target High | Consensus |
|---|---|---|
| 15 | 23 | 17.14 |
The target range reflects expectations of steady growth, with a consensus price suggesting modest upside potential relative to current levels.

Don’t Let Luck Decide Your Entry Point
Optimize your entry points with our advanced ProRealTime indicators. You’ll get efficient buy signals with precise price targets for maximum performance. Start outperforming now!
Analyst & Consumer Opinions
This section reviews The AES Corporation’s recent analyst ratings alongside consumer feedback to assess market sentiment.
Stock Grades
Here is the latest comprehensive overview of The AES Corporation’s stock ratings from recognized analysts:
| Grading Company | Action | New Grade | Date |
|---|---|---|---|
| Seaport Global | Upgrade | Neutral | 2026-02-27 |
| Barclays | Downgrade | Equal Weight | 2026-02-04 |
| Jefferies | Maintain | Hold | 2026-02-04 |
| Argus Research | Upgrade | Buy | 2025-12-05 |
| Jefferies | Upgrade | Hold | 2025-11-18 |
| Mizuho | Maintain | Outperform | 2025-11-06 |
| Morgan Stanley | Maintain | Overweight | 2025-10-22 |
| Barclays | Maintain | Overweight | 2025-10-21 |
| Susquehanna | Maintain | Positive | 2025-10-13 |
| Barclays | Maintain | Overweight | 2025-07-22 |
The overall trend reveals a cautious shift from overweight and outperform stances toward more neutral and hold ratings recently. Analysts appear to be moderating enthusiasm while maintaining confidence above sell levels.
Consumer Opinions
Consumer sentiment around The AES Corporation reflects a mix of appreciation for its innovation and concern over service reliability.
| Positive Reviews | Negative Reviews |
|---|---|
| “AES leads in renewable energy solutions.” | “Frequent outages disrupt our operations.” |
| “Strong commitment to sustainability.” | “Customer support response times are slow.” |
| “Innovative technology drives efficiency.” | “Billing errors happen too often.” |
Overall, consumers praise AES for its forward-thinking energy projects and sustainability focus. However, recurring complaints about service interruptions and customer support indicate areas needing urgent improvement.
Risk Analysis
Below is a summary table highlighting key risks for The AES Corporation based on financial metrics and market conditions:
| Category | Description | Probability | Impact |
|---|---|---|---|
| Liquidity Risk | Current ratio at 0.25 signals weak short-term liquidity | High | High |
| Leverage Risk | Debt-to-equity at 1.71 and debt-to-assets 58.3% show heavy reliance on debt | High | High |
| Profitability Risk | Negative ROIC (-2.46%) below WACC (3.17%) indicates value destruction | Medium | High |
| Market Risk | Beta near 0.94 implies moderate sensitivity to market swings | Medium | Medium |
| Dividend Risk | Zero dividend yield risks investor income expectations | Low | Medium |
| Bankruptcy Risk | Altman Z-Score just below 3 places company in “grey zone” | Medium | High |
I see liquidity and leverage risks as the most pressing. AES’s current ratio is critically low, threatening operational flexibility. High debt levels heighten default risk, especially since ROIC is negative and fails to cover capital costs. The Altman Z-Score confirms moderate financial distress. Investors must weigh these risks against AES’s sector dynamics and recent market volatility.
Should You Buy The AES Corporation?
Analytically, The AES Corporation appears to have a challenging leverage profile and a deteriorating profitability moat, suggesting value destruction. Despite these headwinds, operational efficiency signals strong return metrics, supporting a moderate B+ rating and a cautious investment interpretation.
Strength & Efficiency Pillars
The AES Corporation posts a solid return on equity of 22.4%, reflecting competent capital management. Its net margin of 7.44% indicates moderate profitability, though the return on invested capital (ROIC) stands at -2.46%, signaling operational challenges. The weighted average cost of capital (WACC) is 3.17%, but since ROIC is below WACC, AES is currently a value destroyer. Despite this, the company benefits from a very strong Piotroski score of 8, underscoring robust financial strength.
Weaknesses and Drawbacks
AES sits in the Altman Z-Score grey zone with a score of 2.96, indicating moderate bankruptcy risk. The debt-to-equity ratio of 1.71 and debt-to-assets at 58.29% expose elevated leverage and financial vulnerability. Liquidity is strained with a current ratio of only 0.25, well below the safe benchmark of 1. The company’s price-to-earnings and price-to-book metrics are unavailable but flagged as very favorable, possibly reflecting valuation complexities. These factors suggest caution amid rising financial risks.
Our Final Verdict about The AES Corporation
AES’s long-term fundamentals show mixed signals. The company struggles with value creation and leverage risks, yet maintains a strong financial health score and recent buyer dominance. Despite these strengths, the grey zone Altman Z-Score and operational inefficiencies suggest prudence. The profile might appear speculative and may warrant a wait-and-see approach until solvency concerns ease and ROIC recovers.
Disclaimer: This content is for informational purposes only and does not constitute financial, investment, or other professional advice. Investing in financial markets involves a significant risk of loss, and past performance is not indicative of future results.
Additional Resources
- Consortium Led by Global Infrastructure Partners and EQT Agrees to Acquire AES – PR Newswire (Mar 02, 2026)
- AES Stock Alert: Halper Sadeh LLC is Investigating Whether The AE – The National Law Review (Mar 02, 2026)
- Stock Market Today, March 2: The AES Corporation Drops After $15 Buyout Deal Disappoints Market Expectations – The Motley Fool (Mar 02, 2026)
- AES Indiana’s parent company to go private in BlackRock-led $33B deal – Indiana Capital Chronicle (Mar 02, 2026)
- AES expected to turn private following purchase of company by consortium – Fox 59 (Mar 02, 2026)
For more information about The AES Corporation, please visit the official website: aes.com