Home > Analyses > Industrials > Textron Inc.
Textron Inc. powers critical missions and daily adventures alike, from advanced military helicopters to rugged off-road vehicles. This aerospace and defense giant commands respect through its Bell helicopters, Textron Aviation jets, and cutting-edge unmanned systems. Known for relentless innovation and diverse industrial capabilities, Textron shapes sectors spanning defense, aviation, and recreation. As 2026 unfolds, I question whether Textron’s broad portfolio and solid market stance still justify its premium valuation and growth ambitions.

Table of contents
Business Model & Company Overview
Textron Inc., founded in 1923 and headquartered in Providence, Rhode Island, commands a dominant position in Aerospace & Defense. Its diverse portfolio integrates aircraft, defense, industrial, and finance businesses into a cohesive ecosystem. Textron Aviation produces business jets and military aircraft, while Bell delivers helicopters and tiltrotor aircraft. Textron Systems and Industrial segments extend its reach into unmanned systems, advanced marine crafts, and specialty vehicles, creating a robust industrial footprint with 34,000 employees worldwide.
Textron’s revenue engine balances manufacturing with aftermarket services and finance. It generates recurring income through maintenance, repair, and parts sales, complemented by financing solutions for aircraft and helicopters. Its global presence spans the Americas, Europe, Asia, and Australia, ensuring broad market access. Textron’s economic moat lies in its integrated product-service ecosystem, positioning it as a cornerstone in shaping the future of aerospace and defense.
Financial Performance & Fundamental Metrics
I will analyze Textron Inc.’s income statement, key financial ratios, and dividend payout policy to reveal its core profitability and capital allocation efficiency.
Income Statement
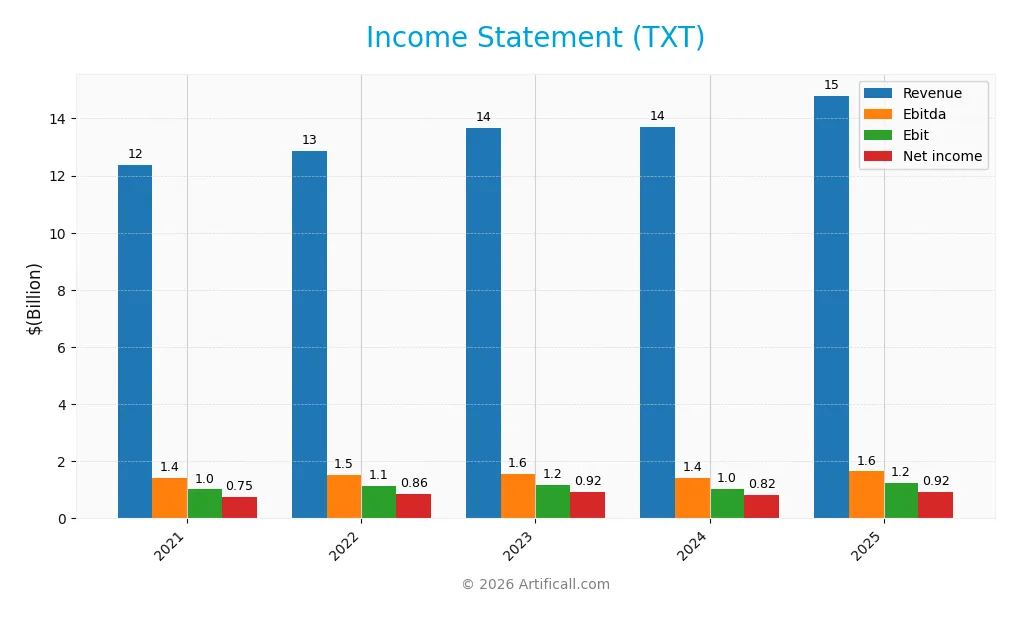
The table below summarizes Textron Inc.’s key income statement figures for fiscal years 2021 through 2025, reflecting revenue, profitability, and earnings per share trends.
| 2021 | 2022 | 2023 | 2024 | 2025 | |
|---|---|---|---|---|---|
| Revenue | 12.4B | 12.9B | 13.7B | 13.7B | 14.8B |
| Cost of Revenue | 10.3B | 10.2B | 10.8B | 11.2B | 12.3B |
| Operating Expenses | 1.2B | 1.8B | 1.8B | 1.6B | 1.3B |
| Gross Profit | 2.1B | 2.7B | 2.8B | 2.5B | 2.5B |
| EBITDA | 1.4B | 1.5B | 1.6B | 1.4B | 1.6B |
| EBIT | 1.0B | 1.1B | 1.2B | 1.0B | 1.2B |
| Interest Expense | 142M | 107M | 77M | 97M | 97M |
| Net Income | 746M | 861M | 921M | 824M | 921M |
| EPS | 3.33 | 4.05 | 4.62 | 4.38 | 5.11 |
| Filing Date | 2022-02-17 | 2023-02-16 | 2024-02-12 | 2025-02-06 | 2026-02-11 |
Income Statement Evolution
Textron’s revenue rose steadily from 12.4B in 2021 to 14.8B in 2025, a 19.5% increase. Net income grew faster, up 23.5% to 921M, while gross profit remained stable at 2.5B. Margins held firm; gross margin stayed neutral near 17%, and EBIT margin hovered around 8.4%, reflecting consistent operational control.
Is the Income Statement Favorable?
In 2025, Textron delivered solid fundamentals with an 8% revenue jump and 20% EBIT growth. The net margin improved slightly to 6.2%, supported by a low interest expense ratio of 0.66%, which is favorable. EPS rose 18%, signaling effective capital allocation. Overall, 64% of income statement metrics rate favorable, underscoring a generally positive financial profile.
Financial Ratios
The following table presents key financial ratios for Textron Inc. over the fiscal years 2021 to 2025, highlighting profitability, liquidity, leverage, and market valuation metrics:
| Ratios | 2021 | 2022 | 2023 | 2024 | 2025 |
|---|---|---|---|---|---|
| Net Margin | 6.0% | 6.7% | 6.7% | 6.0% | 6.2% |
| ROE | 10.9% | 12.1% | 13.2% | 11.4% | 11.7% |
| ROIC | 5.8% | 5.9% | 7.0% | 5.8% | 9.4% |
| P/E | 22.4x | 17.5x | 17.6x | 17.8x | 17.0x |
| P/B | 2.46x | 2.12x | 2.32x | 2.03x | 1.99x |
| Current Ratio | 2.57 | 2.19 | 1.92 | 1.76 | 5.94 |
| Quick Ratio | 1.46 | 1.22 | 1.03 | 0.84 | 2.33 |
| D/E | 0.55 | 0.50 | 0.55 | 0.50 | 0.45 |
| Debt-to-Assets | 24% | 22% | 23% | 21% | 19% |
| Interest Coverage | 6.1x | 8.3x | 13.7x | 8.8x | 12.9x |
| Asset Turnover | 0.78 | 0.79 | 0.81 | 0.81 | 0.82 |
| Fixed Asset Turnover | 4.88x | 5.10x | 5.52x | 5.42x | 5.71x |
| Dividend Yield | 0.11% | 0.12% | 0.10% | 0.11% | 0.12% |
Evolution of Financial Ratios
Textron’s Return on Equity (ROE) remained stable, around 11.7% in 2025, showing consistent profitability. The Current Ratio spiked sharply to 5.94, indicating growing liquidity, while the Debt-to-Equity Ratio improved to 0.45, reflecting reduced financial leverage. Overall, profitability margins stayed neutral but steady throughout the period.
Are the Financial Ratios Favorable?
In 2025, Textron’s liquidity showed mixed signals: a high Current Ratio (5.94) flagged as unfavorable, but a strong Quick Ratio (2.33) marked favorable. Profitability and leverage ratios, including ROE (11.7%) and Debt-to-Equity (0.45), were neutral to favorable. Market valuation metrics like P/E (17.04) and P/B (1.99) appeared neutral. Overall, the ratios suggest a slightly favorable financial position with some liquidity caution.
Shareholder Return Policy
Textron Inc. maintains a low dividend payout ratio around 2%, with dividends per share rising modestly to $0.11 in 2025. The annual dividend yield remains below 0.13%, supported by share buybacks and strong free cash flow coverage, minimizing distribution risk.
This conservative approach balances steady returns with reinvestment capacity. Share buybacks complement dividends, enhancing shareholder value without straining capital. The policy appears consistent with sustainable long-term value creation, reflecting prudent capital allocation amid moderate profitability and robust liquidity.
Score analysis
The following radar chart visualizes key financial scores that assess the company’s valuation and operational effectiveness:
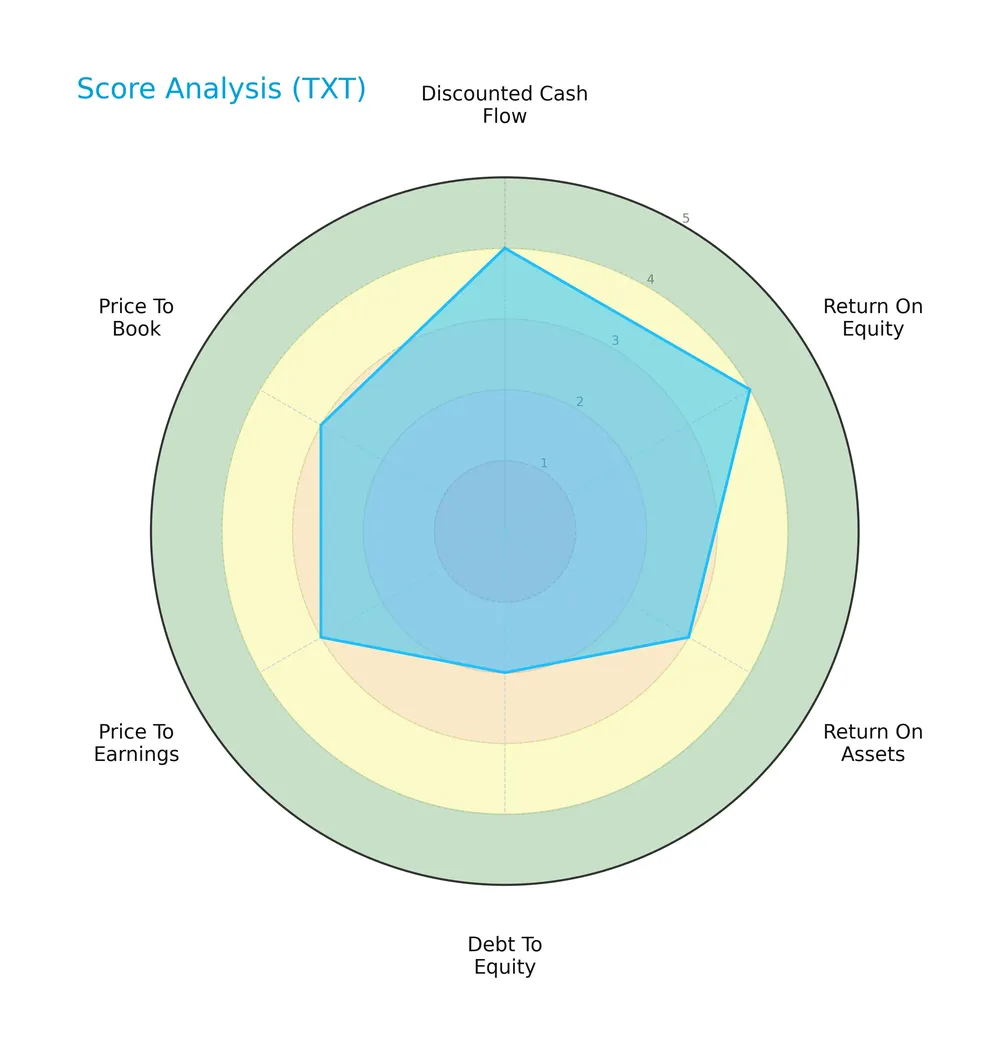
Textron Inc. scores favorably on discounted cash flow and return on equity, reflecting strong profitability. Return on assets and valuation multiples are moderate. Debt to equity remains a weak spot, signaling higher leverage risk.
Analysis of the company’s bankruptcy risk
The Altman Z-Score places Textron in the grey zone, indicating a moderate risk of financial distress and bankruptcy:

Is the company in good financial health?
This Piotroski diagram illustrates Textron’s solid financial strength based on nine key criteria:
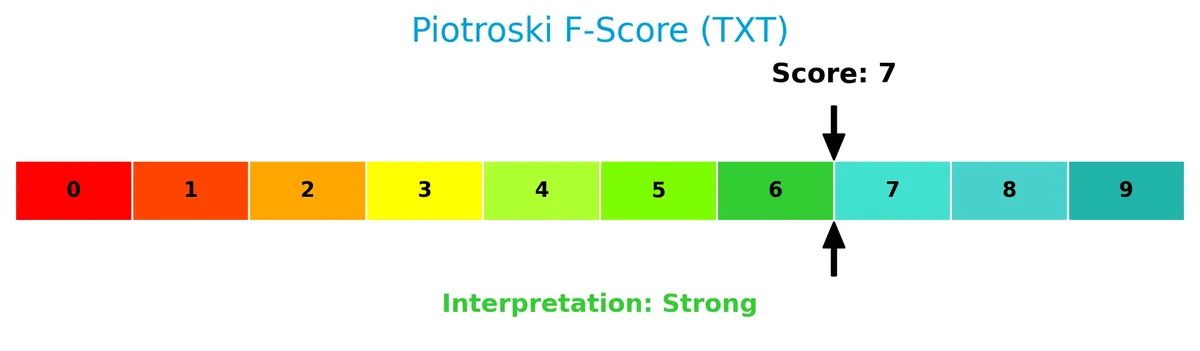
With a Piotroski Score of 7, Textron demonstrates strong financial health, suggesting prudent management of profitability, leverage, and liquidity metrics.
Competitive Landscape & Sector Positioning
This section analyzes Textron Inc.’s strategic positioning, revenue segments, key products, and main competitors within the aerospace and defense sector. I will examine whether Textron holds a competitive advantage over its industry peers.
Strategic Positioning
Textron Inc. maintains a diversified portfolio across aerospace, defense, industrial, and finance sectors. Its revenues in 2024 are balanced between Textron Aviation (5.3B), Bell (3.6B), Industrial (3.5B), and Textron Systems (1.2B). Geographically, the U.S. dominates with 9.7B, complemented by Europe (1.2B) and other international markets (2.8B).
Revenue by Segment
This pie chart displays Textron Inc.’s revenue breakdown by segment for fiscal year 2024, highlighting the relative contribution of each business unit.
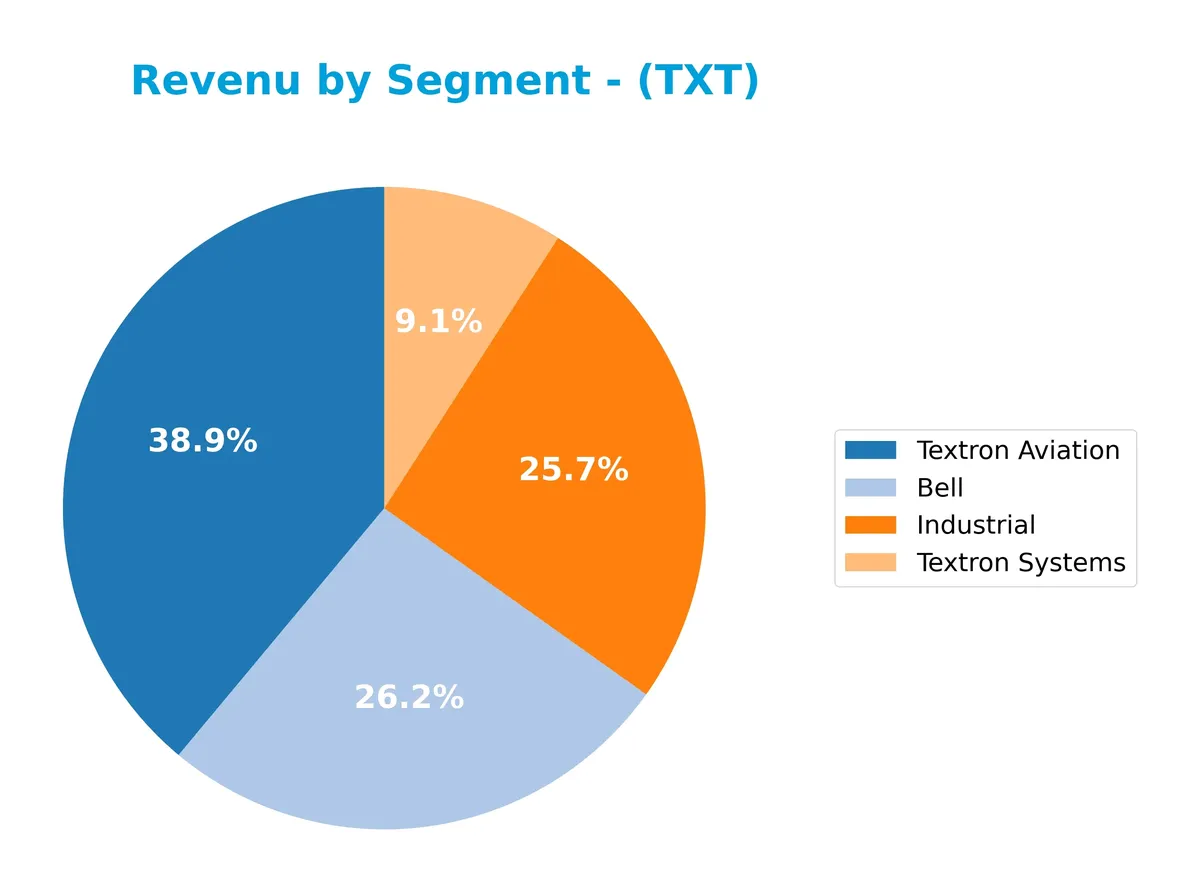
Textron Aviation leads with $5.3B, driving the company’s top line. Bell and Industrial segments follow closely, with $3.6B and $3.5B respectively, showing balanced diversification. Textron Systems contributes a smaller $1.2B, indicating lower scale but steady presence. In 2024, Aviation’s slight slowdown contrasts with Bell’s acceleration, signaling a subtle shift toward rotary-wing growth. This mix reduces concentration risk while reflecting evolving market demands.
Key Products & Brands
The table below details Textron Inc.’s key products and brands across its main business segments:
| Product | Description |
|---|---|
| Textron Aviation | Manufactures and services business jets, turboprop and piston engine aircraft, military trainers, and defense aircraft. Offers maintenance, inspection, repair, and commercial parts sales. |
| Bell | Supplies military and commercial helicopters, tiltrotor aircraft, and related spare parts and services. |
| Textron Systems | Provides unmanned aircraft systems, electronic systems, advanced marine crafts, piston aircraft engines, military training, weapons, armored and specialty vehicles. |
| Industrial | Produces blow-molded plastic fuel systems, clear-vision systems, golf cars, off-road vehicles, snowmobiles, turf-care equipment, and aviation ground support equipment. |
| Finance | Offers financing services for purchasing new and pre-owned aircraft and Bell helicopters. |
Textron’s diversified portfolio spans aerospace, defense, industrial products, and finance, supporting broad market exposure across multiple sectors.
Main Competitors
Textron Inc. faces 12 competitors in Aerospace & Defense, with the top 10 leaders by market capitalization listed below:
| Competitor | Market Cap. |
|---|---|
| GE Aerospace | 338B |
| RTX Corporation | 251B |
| The Boeing Company | 171B |
| Lockheed Martin Corporation | 116B |
| General Dynamics Corporation | 93B |
| Northrop Grumman Corporation | 84B |
| TransDigm Group Incorporated | 77B |
| L3Harris Technologies, Inc. | 57B |
| Axon Enterprise, Inc. | 44B |
| BWX Technologies, Inc. | 17B |
Textron Inc. ranks 11th among 12 competitors, with a market cap just 5.07% of the leader, GE Aerospace. It stands below both the average market cap of the top 10 (125B) and the median sector cap (80B). The company is only 0.76% behind the next competitor above, indicating a narrow gap with its closest rival.
Comparisons with competitors
Check out how we compare the company to its competitors:
Does Textron have a competitive advantage?
Textron currently shows a slightly favorable moat with a growing ROIC but a ROIC that remains below its WACC, indicating the company is not yet creating value above its cost of capital. Its profitability improves, but the firm is still shedding value, reflecting challenges in sustaining a competitive advantage.
Looking ahead, Textron’s diverse aerospace, defense, and industrial segments, combined with its global presence, offer opportunities for growth through new products and expanding markets internationally. Continued innovation and efficiency gains could enhance its competitive positioning in these sectors.
SWOT Analysis
This analysis highlights Textron Inc.’s key internal and external factors impacting its strategic positioning and investment potential.
Strengths
- Diversified aerospace and defense portfolio
- Strong revenue growth of 8% in 2025
- Favorable interest coverage ratio of 12.8
Weaknesses
- High current ratio of 5.94 signals inefficient working capital
- Moderate ROIC of 9.4%, close to WACC
- Low dividend yield at 0.12%
Opportunities
- Expanding defense budgets globally
- Growth in unmanned systems and advanced marine crafts
- Increasing demand for hybrid vehicle fuel systems
Threats
- Geopolitical risks affecting international sales
- Intense competition in aerospace and defense
- Supply chain volatility impacting production costs
Textron’s strengths in diversification and revenue growth support resilience, but its liquidity inefficiencies and moderate profitability require focus. Capitalizing on defense spending and innovation can drive future gains, while careful risk management is essential amid global uncertainties.
Stock Price Action Analysis
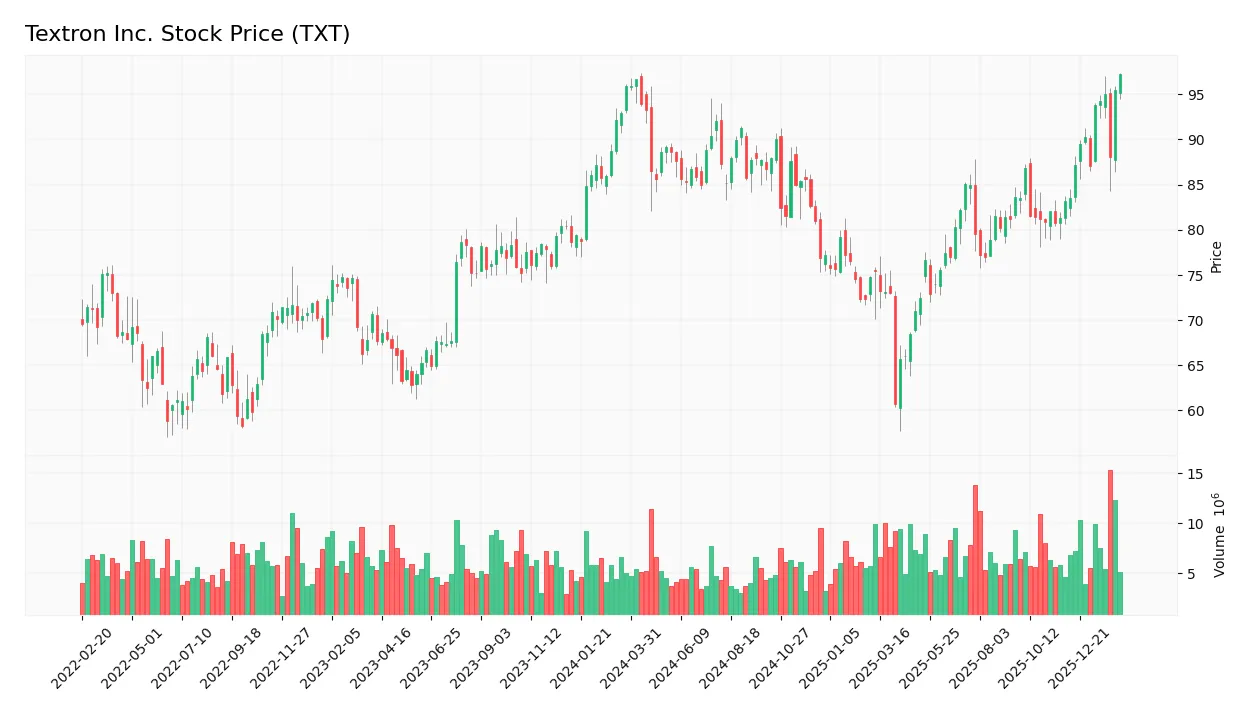
The following weekly chart details Textron Inc.’s stock price movements over the past 12 months, highlighting key highs and lows:
Trend Analysis
Over the past 12 months, TXT’s stock price increased by 1.49%, indicating a bullish trend with acceleration. The price ranged from a low of 60.72 to a high of 97.28, reflecting moderate volatility (std dev 7.36). Recent shorter-term gains accelerated by 16.98% from late 2025 to early 2026.
Volume Analysis
Trading volume shows an increasing trend, with a total of 750M shares traded recently. Buyers dominate 52.72% of volume overall, rising sharply to 77.86% in the last three months. This strong buyer dominance signals heightened market participation and positive investor sentiment toward TXT.
Target Prices
Analysts set a clear target price consensus for Textron Inc. reflecting moderate upside potential.
| Target Low | Target High | Consensus |
|---|---|---|
| 92 | 110 | 101 |
The target range suggests analysts expect Textron’s stock to trade between $92 and $110, with a consensus near $101, indicating cautious optimism.

Don’t Let Luck Decide Your Entry Point
Optimize your entry points with our advanced ProRealTime indicators. You’ll get efficient buy signals with precise price targets for maximum performance. Start outperforming now!
Analyst & Consumer Opinions
This section reviews analyst ratings and consumer feedback to provide a balanced view of Textron Inc.’s performance.
Stock Grades
Here are the latest verified stock grades for Textron Inc. from leading financial institutions:
| Grading Company | Action | New Grade | Date |
|---|---|---|---|
| Jefferies | Maintain | Buy | 2026-02-02 |
| Citigroup | Maintain | Neutral | 2026-01-29 |
| JP Morgan | Maintain | Neutral | 2026-01-29 |
| UBS | Maintain | Neutral | 2026-01-15 |
| Citigroup | Maintain | Neutral | 2026-01-13 |
| JP Morgan | Maintain | Neutral | 2025-10-27 |
| UBS | Maintain | Neutral | 2025-10-24 |
| TD Cowen | Maintain | Hold | 2025-10-24 |
| Barclays | Maintain | Overweight | 2025-07-29 |
| UBS | Upgrade | Neutral | 2025-07-28 |
The consensus trends toward a Hold rating, reflecting balanced investor sentiment. Most firms maintain neutral stances, with isolated Buy and Overweight views signaling cautious optimism.
Consumer Opinions
Textron Inc. sparks a mix of admiration and caution among its customers, reflecting a complex brand reputation.
| Positive Reviews | Negative Reviews |
|---|---|
| High-quality manufacturing and durable products | Customer service response times can lag |
| Innovative aerospace and defense solutions | Pricing sometimes perceived as premium |
| Strong commitment to safety and reliability | Occasional delays in product delivery |
Consumers consistently praise Textron’s product durability and innovation. However, service responsiveness and pricing remain common concerns.
Risk Analysis
Below is a summary table outlining key risks facing Textron Inc. in 2026:
| Category | Description | Probability | Impact |
|---|---|---|---|
| Market Volatility | Aerospace & defense sector exposure may cause share price swings | Medium | High |
| Supply Chain | Disruptions could delay production of aircraft and defense components | Medium | Medium |
| Financial Leverage | Moderate debt raises refinancing and interest rate risks | Low | Medium |
| Dividend Policy | Low dividend yield (0.12%) may deter income-focused investors | High | Low |
| Liquidity | Unusually high current ratio (5.94) may indicate inefficient asset use | Medium | Low |
| Bankruptcy Risk | Altman Z-Score in grey zone signals moderate financial distress potential | Medium | High |
| Geopolitical | Defense sales sensitive to government budgets and international tensions | Medium | High |
Textron’s most concerning risks combine moderate probability with high impact. The Altman Z-Score near 2.87 indicates some financial stress, though not critical. Geopolitical tensions and sector volatility remain persistent threats. The company’s strong Piotroski score and favorable WACC provide partial mitigation. Investors should monitor liquidity efficiency and debt levels closely.
Should You Buy Textron Inc.?
Textron appears to be improving profitability with growing ROIC, suggesting operational efficiency gains. Its competitive moat looks slightly favorable but not yet durable. Despite manageable leverage, debt metrics remain a caution. The overall B+ rating reflects a very favorable but cautious profile.
Strength & Efficiency Pillars
Textron Inc. shows solid operational efficiency with a net margin of 6.22% and a return on equity (ROE) of 11.7%. Its return on invested capital (ROIC) stands at 9.41%, exceeding the weighted average cost of capital (WACC) of 7.5%, confirming Textron as a value creator. The company’s EBIT margin at 8.41% and interest coverage ratio of 12.84 reinforce its ability to generate profits while managing debt costs effectively. These metrics highlight a company steadily improving profitability in a competitive industrial sector.
Weaknesses and Drawbacks
Textron currently resides in the Altman Z-Score grey zone with a score of 2.87, indicating moderate bankruptcy risk that warrants caution. While leverage metrics like debt-to-equity at 0.45 and a strong current ratio of 5.94 suggest liquidity strength, the high current ratio may indicate inefficient working capital use. Valuation multiples remain moderate with a P/E of 17.04 and P/B of 1.99, offering limited margin for significant upside. The low dividend yield of 0.12% is a drawback for income-focused investors.
Our Final Verdict about Textron Inc.
Textron displays a fundamentally solid profile with improving profitability and shareholder value creation. The bullish overall market trend combined with strong recent buyer dominance (77.9%) suggests positive momentum. Despite moderate solvency risk flagged by the Altman Z-Score grey zone, the company’s operational metrics and valuation appear stable. This profile could appeal to investors seeking growth with a moderate risk appetite, though a watchful approach is advisable to monitor solvency trends.
Disclaimer: This content is for informational purposes only and does not constitute financial, investment, or other professional advice. Investing in financial markets involves a significant risk of loss, and past performance is not indicative of future results.
Additional Resources
- Independent Advisor Alliance Sells 23,381 Shares of Textron Inc. $TXT – MarketBeat (Feb 06, 2026)
- Textron Inc (TXT) Q4 2025 Earnings Call Highlights: Record Revenue and Strong Aviation Growth – Yahoo Finance (Jan 28, 2026)
- Textron: A Lot Of “Meh” To Go Around (NYSE:TXT) – Seeking Alpha (Feb 10, 2026)
- Textron Inc. – Investor Relations – Textron Inc. – Investor Relations (Aug 07, 2025)
- Among 4% of firms, Kautex Textron earns CDP climate A leadership rating – Stock Titan (Feb 09, 2026)
For more information about Textron Inc., please visit the official website: textron.com