Home > Analyses > Energy > Texas Pacific Land Corporation
Texas Pacific Land Corporation controls nearly a million acres in the heart of the Permian Basin, shaping energy production and water management in one of the world’s most prolific oil regions. Its unique royalty interests and innovative water services position it as a pivotal player in oil and gas exploration. I’m keen to explore whether TPL’s strong asset base and niche operations justify its premium valuation amid evolving energy markets.

Table of contents
Business Model & Company Overview
Texas Pacific Land Corporation, founded in 1888 and headquartered in Dallas, TX, dominates the oil and gas exploration and production sector through its extensive land and resource management. It oversees roughly 880,000 acres, combining royalty interests and leasing activities into a cohesive ecosystem focused on maximizing land value. This core business integrates mineral rights, easements, and commercial leases, creating a robust platform in the energy landscape.
The company’s revenue engine balances land royalties with a growing Water Services segment, offering water sourcing, treatment, and infrastructure in the Permian Basin. Texas Pacific Land’s footprint spans key energy markets in the Americas, underpinned by recurring royalties and service contracts. Its competitive advantage lies in controlling scarce land and water assets, ensuring a durable economic moat that shapes the industry’s future.
Financial Performance & Fundamental Metrics
I analyze Texas Pacific Land Corporation’s income statement, key financial ratios, and dividend payout policy to assess its core financial health and shareholder value.
Income Statement
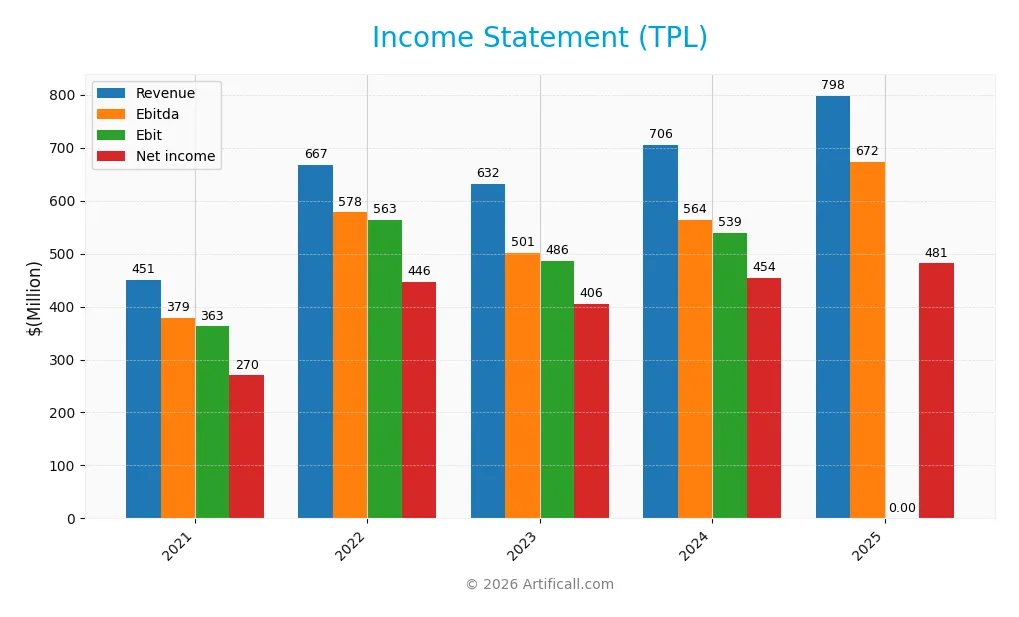
Below is Texas Pacific Land Corporation’s income statement for the fiscal years 2021 through 2025, showing key financial metrics and their annual progression.
| 2021 | 2022 | 2023 | 2024 | 2025 | |
|---|---|---|---|---|---|
| Revenue | 451M | 667M | 632M | 706M | 798M |
| Cost of Revenue | 29M | 33M | 48M | 71M | 0 |
| Operating Expenses | 59M | 72M | 97M | 95M | 206M |
| Gross Profit | 421M | 635M | 583M | 635M | 0 |
| EBITDA | 379M | 578M | 501M | 564M | 672M |
| EBIT | 363M | 563M | 486M | 539M | 0 |
| Interest Expense | 0 | 0 | 0 | 0 | -0.7M |
| Net Income | 270M | 446M | 406M | 454M | 481M |
| EPS | 3.87 | 6.42 | 5.87 | 6.58 | 6.98 |
| Filing Date | 2022-02-23 | 2023-02-22 | 2024-02-21 | 2025-02-19 | 2026-02-18 |
Income Statement Evolution
Texas Pacific Land Corporation’s revenue rose steadily from 450M in 2021 to 798M in 2025, a 77% increase over five years. Net income followed a similar trajectory, growing 78.3% to 481M in 2025. Margins showed mixed results: net margin held strong at 60.3%, but gross and EBIT margins dropped sharply in the latest year, reflecting margin pressure.
Is the Income Statement Favorable?
The 2025 income statement shows solid fundamentals with 13.1% revenue growth year-over-year and a favorable net margin of 60.3%. However, gross profit and EBIT margins collapsed to zero, signaling cost structure changes or accounting shifts. EPS grew 6.0% despite this, but rising operating expenses matching revenue growth raise caution. Overall, the income statement is broadly favorable yet flagged by margin deterioration.
Financial Ratios
Below is a summary table of key financial ratios for Texas Pacific Land Corporation (TPL) over the past five fiscal years, reflecting profitability, liquidity, leverage, and valuation metrics:
| Ratios | 2021 | 2022 | 2023 | 2024 | 2025 |
|---|---|---|---|---|---|
| Net Margin | 60% | 67% | 64% | 64% | 60% |
| ROE | 41% | 58% | 39% | 40% | 33% |
| ROIC | 39% | 54% | 35% | 36% | 30% |
| P/E | 36 | 41 | 30 | 56 | 41 |
| P/B | 15 | 23 | 12 | 22 | 14 |
| Current Ratio | 7.8 | 11.1 | 13.7 | 8.3 | 4.4 |
| Quick Ratio | 6.2 | 9.2 | 13.7 | 8.3 | 4.4 |
| D/E | 0.002 | 0.003 | 0.001 | 0.0004 | 0.011 |
| Debt-to-Assets | 0.19% | 0.22% | 0.10% | 0.04% | 1.0% |
| Interest Coverage | 0 | 0 | 0 | 0 | -858 |
| Asset Turnover | 0.59 | 0.76 | 0.55 | 0.57 | 0.49 |
| Fixed Asset Turnover | 3.6 | 5.0 | 4.6 | 1.3 | 4.5 |
| Dividend Yield | 0.88% | 1.37% | 0.83% | 1.36% | 0.75% |
Evolution of Financial Ratios
From 2021 to 2025, Return on Equity (ROE) trended downward from 41.4% to 33.0%, indicating a moderate decline in profitability. The Current Ratio dropped considerably from 13.7 in 2023 to 4.4 in 2025, reflecting reduced short-term liquidity. Debt-to-Equity remained exceptionally low, stable around 0.01, signaling minimal leverage risk throughout the period.
Are the Financial Ratios Favorable?
In 2025, profitability metrics like net margin (60.3%) and ROE (33.0%) are favorable, supported by strong ROIC (30.1%) well above the WACC (8.0%). However, liquidity is mixed: the current ratio (4.4) is flagged unfavorable despite a favorable quick ratio. Leverage is minimal and favorable with a debt-to-equity ratio of 0.01. Market valuation ratios (PE 41.1, PB 13.6) and dividend yield (0.75%) are unfavorable, while asset turnover (0.49) is low, indicating moderate operational efficiency. Overall, the ratios present a slightly favorable financial stance with notable valuation and liquidity caveats.
Shareholder Return Policy
Texas Pacific Land Corporation maintains a consistent dividend policy with a payout ratio around 30%, a dividend yield near 0.75%, and a stable dividend per share trend. Share buybacks are evident, supported by strong free cash flow coverage, indicating prudent capital allocation.
The company’s dividend payments remain sustainable relative to cash flows and earnings. This balanced approach between dividends and buybacks aligns with long-term shareholder value creation, minimizing risks of over-distribution or excessive repurchases despite relatively high valuation multiples.
Score analysis
The following radar chart summarizes key valuation and financial performance scores for Texas Pacific Land Corporation:
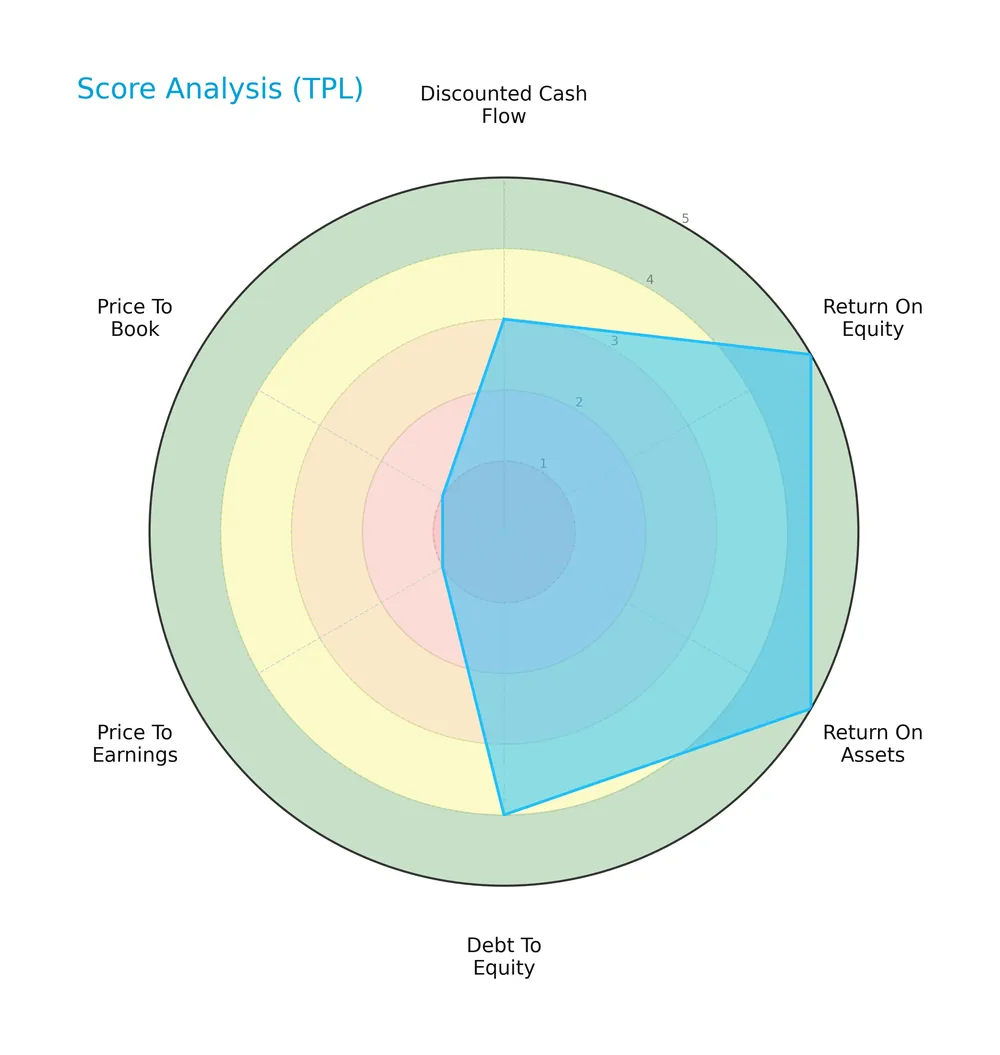
The company shows very favorable returns on equity and assets, reflecting strong profitability. Debt to equity is favorable, indicating prudent leverage. However, valuation metrics such as price-to-earnings and price-to-book scores are very unfavorable, suggesting market price concerns.
Analysis of the company’s bankruptcy risk
Texas Pacific Land Corporation’s Altman Z-Score places it well within the safe zone, indicating a very low risk of bankruptcy:

Is the company in good financial health?
The Piotroski Score diagram highlights the company’s moderate financial health status:

With a Piotroski Score of 5, Texas Pacific Land Corporation demonstrates average financial strength, suggesting neither strong nor weak fundamentals at this point.
Competitive Landscape & Sector Positioning
This analysis explores Texas Pacific Land Corporation’s strategic positioning, revenue segments, key products, and main competitors. I will assess whether Texas Pacific Land holds a competitive advantage in the energy sector.
Strategic Positioning
Texas Pacific Land Corporation maintains a concentrated strategic position focused on land and resource management within Texas, primarily the Permian Basin. Its revenue streams center on oil and gas royalties (411M in 2025) and water sales and royalties (170M), showing specialization rather than geographic or product diversification.
Revenue by Segment
This pie chart illustrates Texas Pacific Land Corporation’s revenue distribution by segment for fiscal year 2025. It highlights the relative contribution of each business line to total revenues.
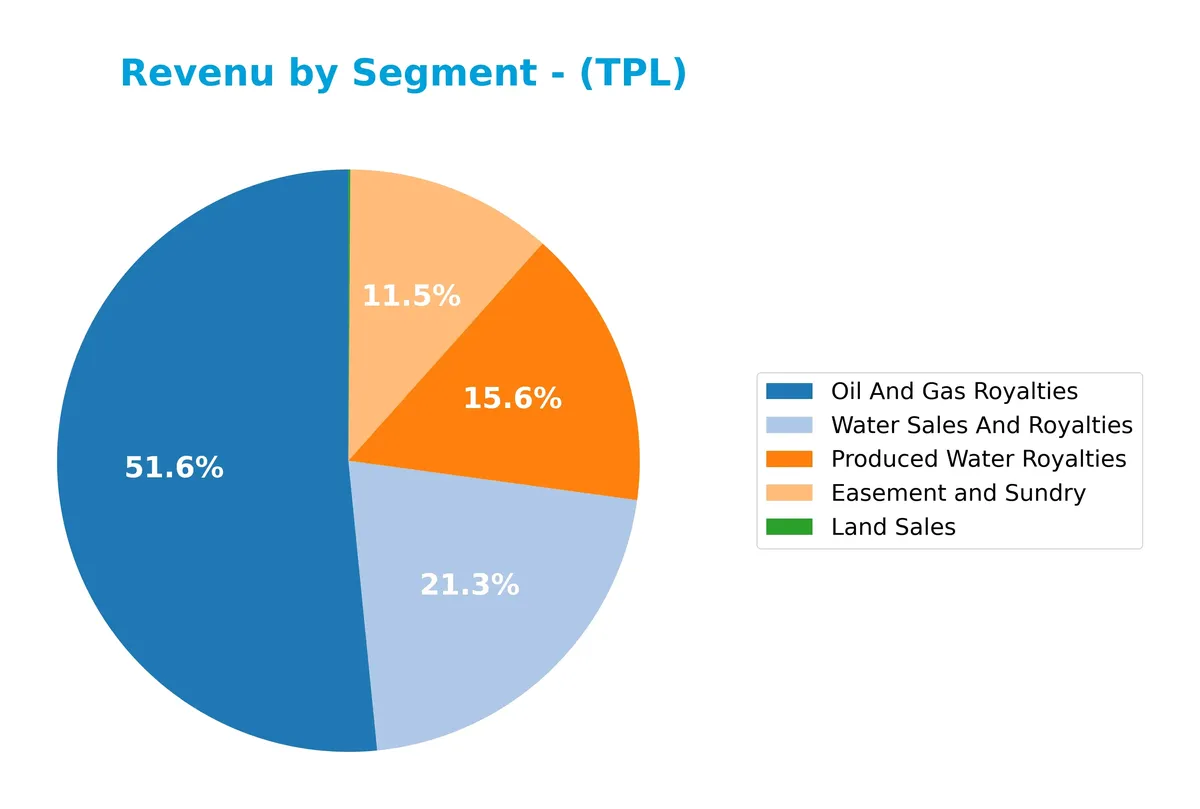
In 2025, Oil And Gas Royalties dominate with $412M, driving the core business despite a decline from 2022’s peak. Water Sales And Royalties and Produced Water Royalties show steady growth, reaching $170M and $124M respectively, signaling diversification. Easement and Sundry revenues increased to $92M, reinforcing ancillary income streams. Land Sales remain minimal at $0.8M, indicating limited reliance on volatile land transactions.
Key Products & Brands
Texas Pacific Land Corporation generates revenue through diverse land, mineral, and water-related offerings:
| Product | Description |
|---|---|
| Oil and Gas Royalties | Royalties from nonparticipating interests under approximately 460,000 acres in western Texas. |
| Produced Water Royalties | Royalties on water produced from company-owned land, supporting Permian Basin operators’ water needs. |
| Water Sales and Royalties | Full-service water solutions including sourcing, treatment, infrastructure, and disposal in the Permian Basin. |
| Easement and Sundry | Income from oil, gas, power line easements, commercial leases, and sale of materials like caliche. |
| Land Sales | Sales of land parcels within the company’s extensive 880,000-acre landholdings. |
Texas Pacific Land’s product mix centers on leveraging its vast land assets through royalties, easements, water services, and selective land sales, capturing value across oil, gas, and water sectors.
Main Competitors
Texas Pacific Land Corporation faces 10 main competitors in the Oil & Gas Exploration & Production industry. Below is a table of the top 10 leaders by market capitalization:
| Competitor | Market Cap. |
|---|---|
| ConocoPhillips | 120.5B |
| EOG Resources, Inc. | 58.8B |
| Diamondback Energy, Inc. | 44.3B |
| Occidental Petroleum Corporation | 41.8B |
| EQT Corporation | 33.4B |
| Expand Energy Corporation | 26.1B |
| Devon Energy Corporation | 24.2B |
| Texas Pacific Land Corporation | 20.5B |
| Coterra Energy Inc. | 20.3B |
| APA Corporation | 9.0B |
Texas Pacific Land Corporation ranks 8th among its top 10 competitors by market cap. Its scale stands at about 25% of the leader, ConocoPhillips. The company is below the average market cap of 39.9B for the top 10 but above the sector median of 29.8B. It maintains a notable 20.3% gap from its immediate superior competitor, Devon Energy.
Comparisons with competitors
Check out how we compare the company to its competitors:
Does Texas Pacific Land Corporation have a competitive advantage?
Texas Pacific Land Corporation exhibits a competitive advantage, demonstrated by its ROIC exceeding WACC by 22%, indicating efficient capital use and value creation. However, its ROIC trend is declining, signaling a potential erosion of profitability over time.
Looking ahead, the company manages extensive land and water services in the Permian Basin, offering growth opportunities in resource management and water infrastructure. These areas could support future revenue streams amid evolving energy sector demands.
SWOT Analysis
This SWOT analysis highlights Texas Pacific Land Corporation’s key internal and external factors affecting its strategic position.
Strengths
- strong net margin at 60%
- high ROIC of 30% well above WACC
- low debt with 1% debt-to-assets
Weaknesses
- declining ROIC trend
- high P/E and P/B ratios signal overvaluation
- unfavorable asset turnover ratio
Opportunities
- growing revenue with 77% increase over 5 years
- expanding water services in Permian Basin
- rising demand for land and mineral rights
Threats
- volatile oil & gas prices
- regulatory risks in energy sector
- competition from alternative energy sources
Overall, Texas Pacific Land Corporation demonstrates robust profitability and asset management but faces valuation risks and declining profitability trends. The company should leverage its land and water service assets to capture growth while managing market and regulatory uncertainties.
Stock Price Action Analysis
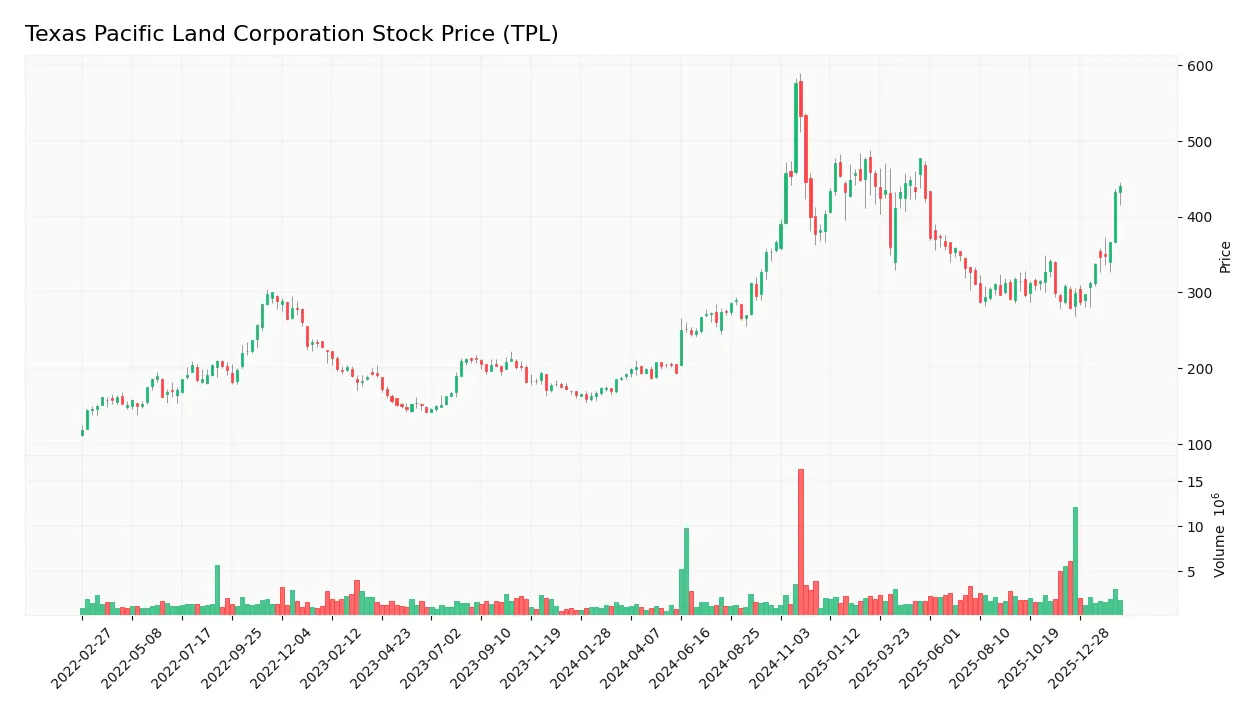
The weekly stock chart presents Texas Pacific Land Corporation’s price movements over the past 100 weeks, highlighting key highs, lows, and momentum shifts:
Trend Analysis
Over the past 100 weeks, TPL’s stock price rose 128.54%, signaling a strong bullish trend with marked acceleration. The price ranged between 187.21 and 576.67, reflecting high volatility (std deviation 84.84). Recent months show a 42.92% gain with continued acceleration and notable slope of 13.19.
Volume Analysis
Trading volume for TPL is increasing, with buyers dominating 54.98% overall. In the last three months, buyer dominance surged to 79.9%, signaling strongly buyer-driven activity. This volume pattern suggests growing investor interest and confidence in the stock’s momentum.
Target Prices
Analysts present a unified target price consensus for Texas Pacific Land Corporation.
| Target Low | Target High | Consensus |
|---|---|---|
| 1,050 | 1,050 | 1,050 |
The consensus target of $1,050 reflects strong confidence in TPL’s valuation, indicating limited expected volatility among analysts.

Don’t Let Luck Decide Your Entry Point
Optimize your entry points with our advanced ProRealTime indicators. You’ll get efficient buy signals with precise price targets for maximum performance. Start outperforming now!
Analyst & Consumer Opinions
This section examines analyst ratings and consumer feedback to provide a comprehensive view of Texas Pacific Land Corporation’s market perception.
Stock Grades
Here are the latest verified stock grades for Texas Pacific Land Corporation from recognized analysts:
| Grading Company | Action | New Grade | Date |
|---|---|---|---|
| BWS Financial | Maintain | Buy | 2024-08-12 |
| BWS Financial | Maintain | Buy | 2024-05-10 |
| BWS Financial | Maintain | Buy | 2024-04-02 |
| Stifel | Maintain | Hold | 2024-01-23 |
| Stifel | Maintain | Hold | 2023-11-30 |
| Stifel | Maintain | Hold | 2023-05-22 |
| Stifel | Maintain | Hold | 2023-05-21 |
| Stifel | Maintain | Hold | 2023-04-27 |
| Stifel | Maintain | Hold | 2023-04-26 |
| Stifel | Maintain | Hold | 2023-04-12 |
The grading trend shows consistent Buy ratings from BWS Financial and steady Hold ratings from Stifel over recent periods. This mixed but stable pattern reflects differing analyst views on the stock’s near-term prospects.
Consumer Opinions
Consumers display a mixed but generally favorable view of Texas Pacific Land Corporation (TPL), reflecting its niche market position.
| Positive Reviews | Negative Reviews |
|---|---|
| Strong land asset value growth | Limited dividend payouts |
| Transparent and reliable management | Complex business model for new investors |
| Consistent royalty income stream | Stock price volatility concerns |
Overall, consumers appreciate TPL’s steady asset appreciation and management transparency. However, some express frustration with limited dividends and complexity, which may deter less experienced investors.
Risk Analysis
The table below outlines key risks facing Texas Pacific Land Corporation, their likelihood, and potential impact on performance:
| Category | Description | Probability | Impact |
|---|---|---|---|
| Valuation Risk | High P/E (41.14) and P/B (13.57) ratios indicate the stock trades at a premium. | Medium | High |
| Operational Risk | Low asset turnover (0.49) may signal inefficiencies in using assets to generate revenue. | Medium | Medium |
| Interest Coverage | Negative interest coverage reflects vulnerability to rising borrowing costs or financial stress. | Low | High |
| Sector Exposure | Exposure to volatile oil & gas market prices affects revenue and cash flow stability. | High | High |
| Dividend Yield | Low dividend yield (0.75%) may disappoint income-focused investors during market downturns. | Medium | Low |
Texas Pacific Land Corporation benefits from strong profitability and a safe Altman Z-Score, but its valuation premium and sector cyclicality pose significant risks. The oil price volatility in 2025 highlighted sensitivity to energy market swings, demanding cautious portfolio sizing.
Should You Buy Texas Pacific Land Corporation?
Texas Pacific Land Corporation appears to be a profitable company with robust value creation despite a declining ROIC trend suggesting a slightly favorable moat. Its leverage profile is manageable, supporting a very favorable B+ rating, though valuation metrics remain a cautionary note.
Strength & Efficiency Pillars
Texas Pacific Land Corporation demonstrates robust profitability with a net margin of 60.31% and a strong return on equity of 33.0%. Its return on invested capital (ROIC) stands at 30.12%, significantly exceeding the weighted average cost of capital (WACC) of 8.04%. This clear spread confirms the company is a value creator, efficiently generating returns well above its capital costs. Despite a declining ROIC trend, the company maintains operational strength and capital allocation discipline, highlighted by a favorable debt-to-equity ratio of 0.01.
Weaknesses and Drawbacks
The company’s valuation metrics present notable risks. A high price-to-earnings ratio of 41.14 and price-to-book ratio of 13.57 indicate an expensive premium, potentially limiting upside. Its current ratio of 4.4, while seemingly strong, is flagged unfavorable here, possibly reflecting excessive liquidity that could signal inefficient capital use. Additionally, interest coverage is negative, pointing to challenges in covering interest expenses from operating income. Asset turnover is weak at 0.49, suggesting underutilization of assets relative to revenue.
Our Final Verdict about Texas Pacific Land Corporation
The company’s solid profitability and value creation suggest a fundamentally attractive profile. Its bullish long-term trend and strong buyer dominance signal growing investor confidence. However, elevated valuation multiples and some operational inefficiencies warrant caution. Texas Pacific Land Corporation might appear compelling for long-term exposure but investors should consider valuation risks and monitor operational metrics for signs of improvement before increasing exposure.
Disclaimer: This content is for informational purposes only and does not constitute financial, investment, or other professional advice. Investing in financial markets involves a significant risk of loss, and past performance is not indicative of future results.
Additional Resources
- Texas Pacific Land opens Midland water sites to visiting shareholders – Stock Titan (Feb 18, 2026)
- Decoding Texas Pacific Land Corp (TPL): A Strategic SWOT Insight – GuruFocus (Feb 19, 2026)
- Texas Pacific Land (NYSE:TPL) Announces Quarterly Earnings Results, Beats Expectations By $0.06 EPS – MarketBeat (Feb 18, 2026)
- Horizon Kinetics buys Texas Pacific Land (TPL) share for $425 By Investing.com – Investing.com South Africa (Feb 18, 2026)
- Insights into Texas Pacific Land Q4 Earnings – Benzinga (Feb 18, 2026)
For more information about Texas Pacific Land Corporation, please visit the official website: texaspacific.com