Home > Analyses > Technology > Texas Instruments Incorporated
Texas Instruments transforms everyday technology by powering countless electronic devices with its advanced semiconductors. Its leadership in analog and embedded processing chips shapes industries from automotive to communications. Renowned for innovation and engineering excellence, Texas Instruments commands deep customer trust and a proven track record of profitability. As the semiconductor landscape evolves rapidly, I question whether its fundamentals still support its premium valuation and future growth prospects.
Table of contents
Business Model & Company Overview
Texas Instruments Incorporated, founded in 1930 and based in Dallas, Texas, stands as a dominant force in the semiconductor industry. It crafts a cohesive ecosystem of analog and embedded processing solutions that power diverse electronics worldwide. With 34,000 employees, the company integrates power management, signal processing, and microcontrollers into a unified mission to advance electronic design and manufacturing.
Its revenue engine balances high-margin analog components and embedded processors, serving industrial, automotive, and consumer markets across the Americas, Europe, and Asia. Direct sales and distributors fuel global reach, while specialized products like DLP projectors and application-specific ICs deepen its footprint. This competitive advantage establishes Texas Instruments as a cornerstone shaping semiconductor innovation and resilience.
Financial Performance & Fundamental Metrics
I analyze Texas Instruments Incorporated’s income statement, key financial ratios, and dividend payout policy to assess its financial health and shareholder value creation.
Income Statement
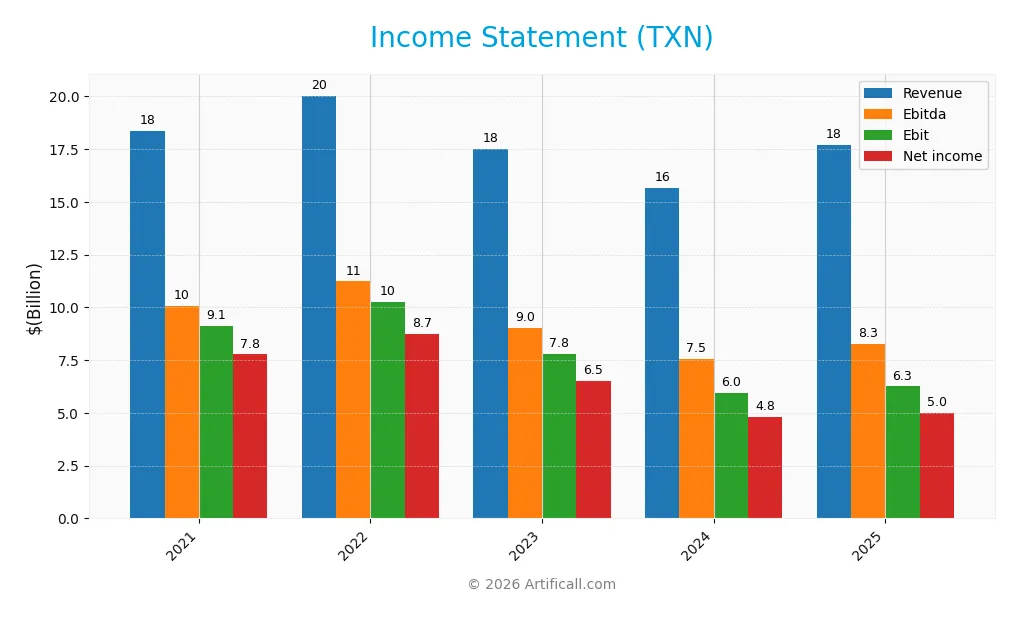
The table below summarizes Texas Instruments Incorporated’s key income statement metrics for fiscal years 2021 through 2025, presented in USD.
| 2021 | 2022 | 2023 | 2024 | 2025 | |
|---|---|---|---|---|---|
| Revenue | 18.3B | 20.0B | 17.5B | 15.6B | 17.7B |
| Cost of Revenue | 6.0B | 6.3B | 6.5B | 6.5B | 7.6B |
| Operating Expenses | 3.4B | 3.6B | 3.7B | 3.6B | 4.1B |
| Gross Profit | 12.4B | 13.8B | 11.0B | 9.1B | 10.1B |
| EBITDA | 10.1B | 11.2B | 9.0B | 7.5B | 8.3B |
| EBIT | 9.1B | 10.2B | 7.8B | 6.0B | 6.3B |
| Interest Expense | 184M | 214M | 353M | 508M | 543M |
| Net Income | 7.8B | 8.7B | 6.5B | 4.8B | 5.0B |
| EPS | 8.38 | 9.51 | 7.13 | 5.24 | 5.45 |
| Filing Date | 2022-02-04 | 2023-02-03 | 2024-02-02 | 2025-02-14 | 2026-02-06 |
Income Statement Evolution
Texas Instruments’ revenue experienced a slight decline of 3.6% from 2021 to 2025, despite a 13% rebound in the last year. Net income dropped significantly by 35.6% over the period, reflecting margin pressures. Gross and EBIT margins remained favorable, above 35%, but net margin contracted by over 33%, signaling rising costs or weaker profitability.
Is the Income Statement Favorable?
In 2025, fundamentals appear generally favorable with revenue up 13% and gross profit rising nearly 11%. Operating expenses grew in line with revenue, maintaining stable operational leverage. EBIT growth was modest at 4.9%, while net margin declined 7.8%, indicating some pressure on bottom-line efficiency. EPS growth of 4.8% supports earnings resilience despite margin headwinds.
Financial Ratios
The following table summarizes key financial ratios for Texas Instruments Incorporated (TXN) over the past five fiscal years:
| Ratios | 2021 | 2022 | 2023 | 2024 | 2025 |
|---|---|---|---|---|---|
| Net Margin | 42.4% | 43.7% | 37.2% | 30.7% | 28.3% |
| ROE | 58.3% | 60.0% | 38.5% | 28.4% | 30.7% |
| ROIC | 34.4% | 35.7% | 21.7% | 14.7% | 16.5% |
| P/E | 22.4 | 17.3 | 23.8 | 35.6 | 31.5 |
| P/B | 13.0 | 10.4 | 9.2 | 10.1 | 9.7 |
| Current Ratio | 5.33 | 4.70 | 4.55 | 4.12 | 4.35 |
| Quick Ratio | 4.58 | 3.77 | 3.35 | 2.88 | 2.83 |
| D/E | 0.62 | 0.62 | 0.66 | 0.80 | 0.86 |
| Debt-to-Assets | 33.3% | 33.7% | 34.7% | 38.3% | 40.6% |
| Interest Coverage | 48.7 | 47.4 | 20.8 | 10.8 | 11.1 |
| Asset Turnover | 0.74 | 0.74 | 0.54 | 0.44 | 0.51 |
| Fixed Asset Turnover | 3.57 | 2.91 | 1.75 | 1.38 | 1.44 |
| Dividend Yield | 2.23% | 2.84% | 2.94% | 2.80% | 3.17% |
Evolution of Financial Ratios
Texas Instruments’ ROE declined from a peak near 60% in 2022 to about 31% in 2025, indicating reduced profitability. The Current Ratio remained consistently high, fluctuating slightly around 4.3 to 5.3, showing ample liquidity. Debt-to-Equity rose from 0.62 in 2021 to 0.86 in 2025, reflecting a moderate increase in leverage.
Are the Financial Ratios Fovorable?
Profitability metrics such as net margin (28.3%) and ROE (30.7%) are favorable, displaying strong returns despite some decline. Liquidity is mixed: a high Current Ratio is marked unfavorable, while the Quick Ratio is favorable. Leverage ratios show neutrality with debt-to-equity at 0.86. Valuation multiples like P/E and P/B appear unfavorable. Overall, the ratios lean slightly favorable.
Shareholder Return Policy
Texas Instruments maintains a dividend payout ratio near 100%, with a consistent dividend per share growth and a yield around 3.2% in 2025. The company also funds dividends through free cash flow but with limited coverage, raising caution on sustainability if cash flow declines.
The company supplements shareholder returns with share buybacks. This combined approach supports a balanced return strategy. However, the near-full payout ratio demands close monitoring to ensure long-term value creation amid market fluctuations and capital needs.
Score analysis
The following radar chart illustrates Texas Instruments Incorporated’s key financial scores across valuation, profitability, and leverage metrics:
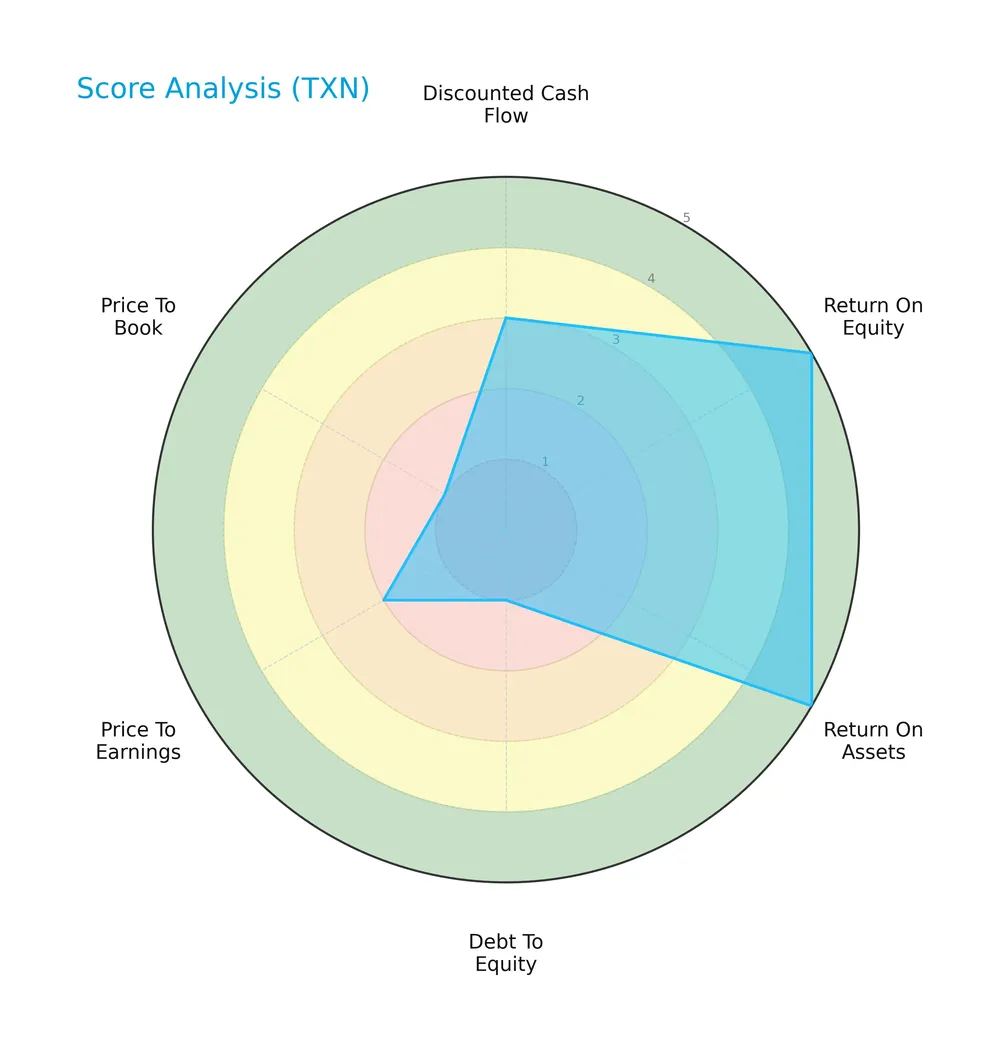
Texas Instruments scores very favorably on return on equity and assets, showing operational strength. However, debt-to-equity and price-to-book ratios are very unfavorable, indicating capital structure and valuation concerns. Overall, scores reflect moderate investment appeal.
Analysis of the company’s bankruptcy risk
Texas Instruments’ Altman Z-Score firmly places it in the safe zone, indicating a very low risk of bankruptcy:

Is the company in good financial health?
The Piotroski Score diagram highlights Texas Instruments’ solid financial health based on profitability, leverage, and liquidity factors:

With a strong Piotroski Score of 7, Texas Instruments demonstrates robust financial fundamentals, signaling resilience and operational efficiency despite some valuation weaknesses.
Competitive Landscape & Sector Positioning
This sector analysis examines Texas Instruments Incorporated’s strategic positioning, revenue streams, and key products within semiconductors. I will assess whether Texas Instruments holds a competitive advantage over its main industry rivals.
Strategic Positioning
Texas Instruments concentrates on semiconductors with two core segments: Analog, generating $14B in 2025, and Embedded Processing at $2.7B. Geographically, it diversifies sales across the US ($6.8B), China ($3.8B), EMEA ($3.7B), Japan ($1.2B), and Asia ($1.9B), supporting balanced global exposure.
Revenue by Segment
This pie chart illustrates Texas Instruments’ revenue distribution by product segment for the fiscal year 2025, highlighting the relative contribution of Analog and Embedded Processing segments.
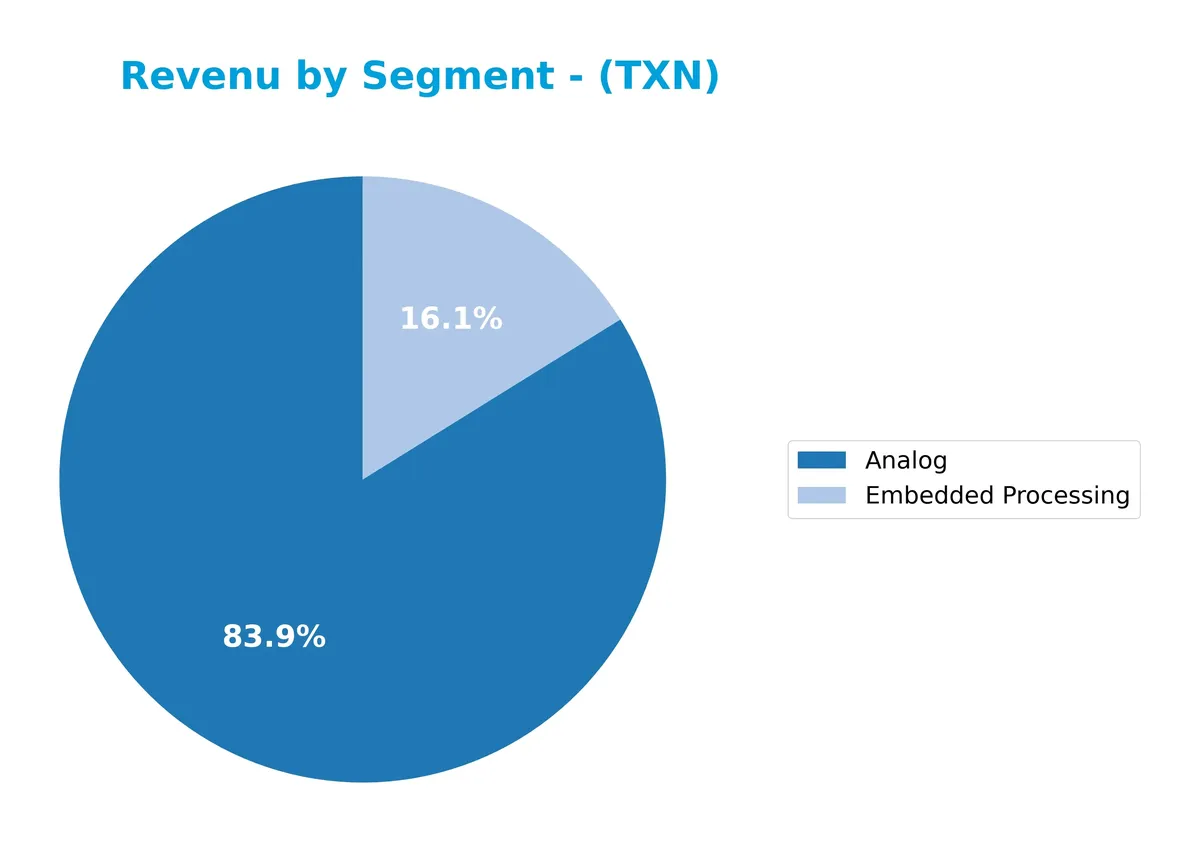
In 2025, Analog revenue reached $14B, reinforcing its position as the core driver of Texas Instruments’ business. Embedded Processing contributed $2.7B, showing steady support but smaller scale. Compared to prior years, Analog rebounded after a dip in 2024, signaling renewed demand. The absence of smaller segments in recent data suggests portfolio concentration, which may heighten exposure to Analog market cycles.
Key Products & Brands
The table below outlines Texas Instruments’ core product lines and their descriptions:
| Product | Description |
|---|---|
| Analog | Power management products including battery solutions, regulators, converters, switches, and signal chain devices. |
| Embedded Processing | Microcontrollers, digital signal processors, and applications processors used across industrial, automotive, and more. |
| DLP Products | Digital Light Processing products primarily for projectors delivering high-definition images. |
| Calculators | Handheld electronic calculators for consumer and educational use. |
| Application-Specific ICs | Custom integrated circuits tailored for specific computing applications. |
Texas Instruments leads in analog and embedded processing semiconductor products. Its diverse portfolio spans power management, signal processing, and computing chips, serving broad industrial and consumer markets.
Main Competitors
There are 38 competitors in total, with the following top 10 leaders by market capitalization:
| Competitor | Market Cap. |
|---|---|
| NVIDIA Corporation | 4.6T |
| Broadcom Inc. | 1.6T |
| Taiwan Semiconductor Manufacturing Company Limited | 1.6T |
| ASML Holding N.V. | 415B |
| Advanced Micro Devices, Inc. | 363B |
| Micron Technology, Inc. | 353B |
| Lam Research Corporation | 232B |
| Applied Materials, Inc. | 214B |
| QUALCOMM Incorporated | 185B |
| Intel Corporation | 173B |
Texas Instruments Incorporated ranks 12th among 38 competitors in the semiconductor sector. Its market cap is 4.38% of the leader, NVIDIA. The company stands below the average market cap of the top 10 but remains above the median market cap of the sector. Texas Instruments is approximately 16.77% smaller than its closest competitor above.
Comparisons with competitors
Check out how we compare the company to its competitors:
Does TXN have a competitive advantage?
Texas Instruments demonstrates a competitive advantage through a strong economic moat, generating returns on invested capital (ROIC) well above its weighted average cost of capital (WACC), indicating value creation. Its gross margin at 57% and net margin above 28% compare favorably to industry peers, underscoring efficient capital use and profitable operations.
Looking ahead, TXN’s diversified product segments in analog and embedded processing position it well to capture growth in industrial, automotive, and personal electronics markets. Expansion in China and the United States supports revenue opportunities, although a declining ROIC trend cautions on sustaining profitability levels over time.
SWOT Analysis
This analysis highlights Texas Instruments Incorporated’s core competitive factors and market challenges.
Strengths
- Strong market position in analog semiconductors
- Robust profitability with 28% net margin
- High ROE at 31% signaling efficient capital use
Weaknesses
- Declining ROIC trend signals reduced profitability
- High valuation multiples (PE 31.5, PB 9.7) raise investment risk
- Elevated current ratio (4.35) may indicate inefficient asset use
Opportunities
- Growing demand in automotive and industrial markets
- Expansion in Asia-Pacific markets, especially China
- Innovation in power management and embedded processing
Threats
- Semiconductor supply chain disruptions
- Intense competition from global chipmakers
- Geopolitical tensions impacting China sales
Texas Instruments demonstrates a durable moat with strong profitability and capital returns. However, its declining ROIC and stretched valuation require cautious monitoring. Growth hinges on leveraging new industrial and regional markets while managing geopolitical and competitive risks.
Stock Price Action Analysis
The following weekly chart illustrates Texas Instruments Incorporated’s stock price movement over the past 12 months:
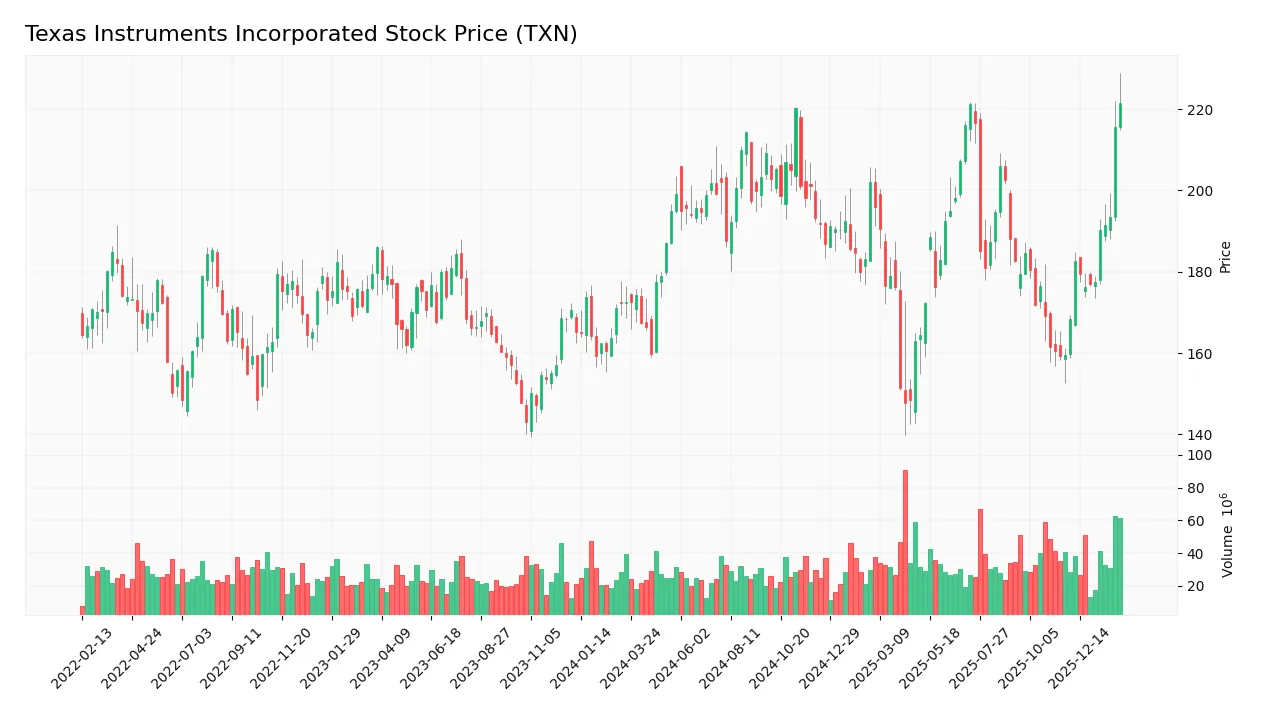
Trend Analysis
Over the past 12 months, TXN’s stock price increased by 28.36%, indicating a bullish trend with acceleration. The price ranged between 147.6 and 221.44, showing significant upward momentum. The standard deviation of 16.2% highlights notable volatility in the uptrend.
Volume Analysis
In the last three months, trading volume has increased and is strongly buyer-driven, with buyers accounting for 82.54% of activity. This surge in buying suggests robust investor confidence and heightened market participation in TXN shares.
Target Prices
Analysts set a clear target consensus for Texas Instruments Incorporated.
| Target Low | Target High | Consensus |
|---|---|---|
| 160 | 260 | 204.64 |
The target range indicates moderate optimism, with a consensus around $205 signaling confidence in TXN’s growth potential.

Don’t Let Luck Decide Your Entry Point
Optimize your entry points with our advanced ProRealTime indicators. You’ll get efficient buy signals with precise price targets for maximum performance. Start outperforming now!
Analyst & Consumer Opinions
This section examines the latest grades and consumer feedback regarding Texas Instruments Incorporated’s market performance and reputation.
Stock Grades
The following table summarizes recent stock grade actions from recognized financial institutions for Texas Instruments Incorporated:
| Grading Company | Action | New Grade | Date |
|---|---|---|---|
| Rosenblatt | Maintain | Buy | 2026-02-05 |
| Rosenblatt | Maintain | Buy | 2026-01-28 |
| Goldman Sachs | Maintain | Sell | 2026-01-28 |
| Deutsche Bank | Maintain | Hold | 2026-01-28 |
| Keybanc | Maintain | Overweight | 2026-01-28 |
| Stifel | Maintain | Hold | 2026-01-28 |
| Benchmark | Maintain | Buy | 2026-01-28 |
| Jefferies | Maintain | Hold | 2026-01-28 |
| B of A Securities | Upgrade | Neutral | 2026-01-28 |
| Wells Fargo | Maintain | Equal Weight | 2026-01-28 |
Overall, grade actions show stability with most firms maintaining previous ratings. The consensus leans towards a moderate buy stance, balancing positive views against some hold and sell positions.
Consumer Opinions
Texas Instruments garners a strong reputation among consumers, marked by consistent praise and some areas needing attention.
| Positive Reviews | Negative Reviews |
|---|---|
| “Reliable products with excellent performance.” | “Customer service response times can lag.” |
| “Innovative technology that meets industry needs.” | “Pricing feels slightly high for some components.” |
| “Robust and durable designs for long-term use.” | “Limited customization options in certain product lines.” |
Overall, consumers appreciate Texas Instruments’ product reliability and innovation. However, service responsiveness and pricing emerge as recurring challenges that could impact customer loyalty.
Risk Analysis
Below is a table summarizing the key risks facing Texas Instruments Incorporated (TXN) with their likelihood and potential impact:
| Category | Description | Probability | Impact |
|---|---|---|---|
| Valuation Risk | Elevated P/E ratio (31.5) and high P/B (9.7) suggest potential overvaluation. | High | High |
| Debt Risk | Debt-to-equity ratio near 0.86 signals moderate leverage and related risks. | Medium | Medium |
| Market Volatility | Beta near 1 indicates stock closely tracks market swings, posing volatility risk. | Medium | Medium |
| Industry Cyclicality | Semiconductor sector prone to demand cycles impacting revenue and margins. | High | High |
| Liquidity Risk | Current ratio at 4.35 flagged as unfavorable, possibly indicating inefficient asset use. | Low | Low |
The most concerning risks are TXN’s high valuation multiples and semiconductor industry cyclicality. The stock trades near its 52-week high amid sector volatility. Leverage remains moderate with strong interest coverage, reducing default risk. Investors should weigh these factors carefully in a fluctuating market.
Should You Buy Texas Instruments Incorporated?
Texas Instruments appears to be a robust value creator with a slightly favorable competitive moat despite a declining ROIC trend. While its leverage profile raises concerns, the overall rating of B suggests a very favorable financial health profile, balancing strengths and risks.
Strength & Efficiency Pillars
Texas Instruments Incorporated demonstrates robust profitability with a net margin of 28.28% and a strong return on equity of 30.73%. Its return on invested capital (ROIC) stands at 16.52%, comfortably above its weighted average cost of capital (WACC) of 8.13%, confirming the company as a clear value creator. This operational efficiency is complemented by favorable gross and EBIT margins of 57.02% and 35.36%, respectively, underscoring effective cost management and pricing power in a competitive semiconductor landscape.
Weaknesses and Drawbacks
The company’s valuation metrics raise caution. A price-to-earnings ratio of 31.53 and a price-to-book ratio of 9.69 suggest a premium market valuation that may limit upside in a correction. Additionally, the current ratio of 4.35, while superficially indicating liquidity, may reflect inefficient asset deployment compared to industry peers. Though leverage metrics remain neutral, these valuation and liquidity concerns introduce risk, especially in volatile market conditions where buyer dominance could quickly shift.
Our Final Verdict about Texas Instruments Incorporated
Texas Instruments exhibits a fundamentally sound profile supported by strong profitability and clear value creation. The bullish overall trend combined with a strongly buyer-dominant recent period suggests positive investor sentiment. However, the premium valuation and potential liquidity inefficiencies might warrant a cautious entry. This profile may appear attractive for long-term exposure but suggests a measured approach to timing new positions.
Disclaimer: This content is for informational purposes only and does not constitute financial, investment, or other professional advice. Investing in financial markets involves a significant risk of loss, and past performance is not indicative of future results.
Additional Resources
- Blinn, Texas Instruments director, sells $696k in TXN stock – Investing.com (Feb 06, 2026)
- Is Trending Stock Texas Instruments Incorporated (TXN) a Buy Now? – Yahoo Finance (Feb 04, 2026)
- Texas Instruments to acquire Silicon Labs – PR Newswire (Feb 04, 2026)
- Guinness Asset Management LTD Has $185.39 Million Stock Position in Texas Instruments Incorporated $TXN – MarketBeat (Feb 06, 2026)
- Texas Instruments: Cautiously Optimistic From Here (NASDAQ:TXN) – Seeking Alpha (Feb 03, 2026)
For more information about Texas Instruments Incorporated, please visit the official website: ti.com