Home > Analyses > Consumer Cyclical > Tesla, Inc.
Tesla transforms how we move and power our world, accelerating the shift to sustainable energy. Its electric vehicles set industry standards for performance and innovation. Tesla’s energy solutions complement its automotive dominance, creating a unique ecosystem. I’ve observed that such integration builds a formidable moat. Yet, as Tesla’s valuation climbs, I question if its fundamentals still justify this premium and what lies ahead for investors.
Table of contents
Business Model & Company Overview
Tesla, Inc., founded in 2003 and headquartered in Austin, Texas, dominates the electric vehicle and energy solutions industry. It operates a cohesive ecosystem that integrates electric vehicles, energy generation, and storage systems. Tesla’s core mission centers on accelerating the world’s transition to sustainable energy through innovative automotive and energy products.
Tesla’s revenue engine balances automotive sales with energy generation and storage solutions across the Americas, Europe, and Asia. Its model includes direct vehicle sales, regulatory credits, financing services, and a vast Supercharger network. This multifaceted approach, combined with scalable energy products, creates a robust economic moat that redefines global transportation and energy markets.
Financial Performance & Fundamental Metrics
I will analyze Tesla, Inc.’s income statement, key financial ratios, and dividend payout policy to reveal its core operational and shareholder value dynamics.
Income Statement
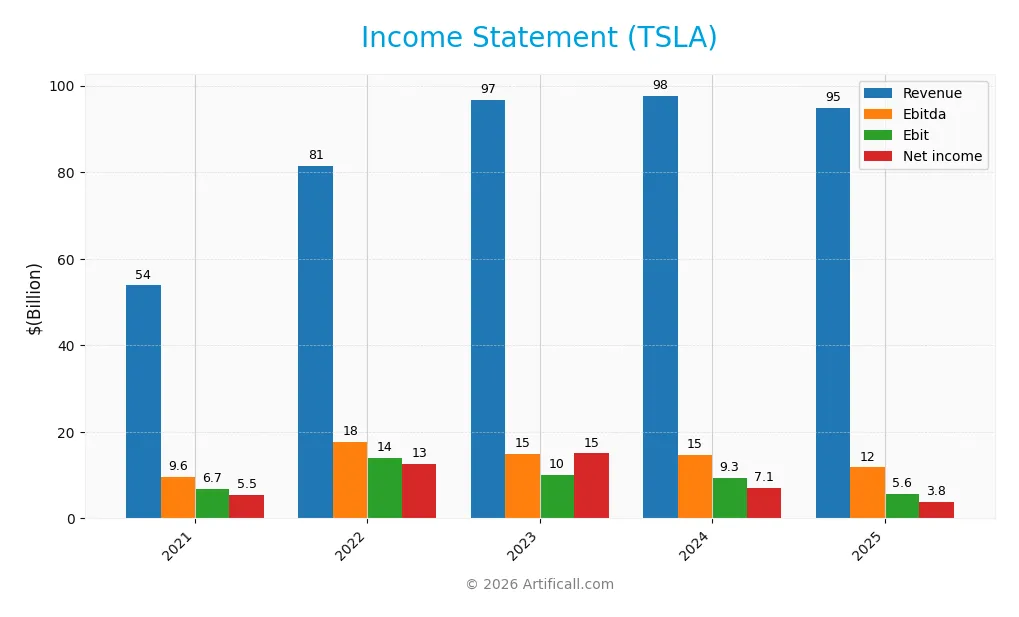
The following table summarizes Tesla, Inc.’s key income statement metrics for fiscal years 2021 through 2025, reflecting revenue, expenses, profits, and earnings per share.
| 2021 | 2022 | 2023 | 2024 | 2025 | |
|---|---|---|---|---|---|
| Revenue | 53.8B | 81.5B | 96.8B | 97.7B | 94.8B |
| Cost of Revenue | 40.2B | 60.6B | 79.1B | 80.2B | 77.7B |
| Operating Expenses | 7.1B | 7.2B | 8.8B | 10.4B | 12.7B |
| Gross Profit | 13.6B | 20.9B | 17.7B | 17.5B | 17.1B |
| EBITDA | 9.6B | 17.7B | 14.8B | 14.7B | 11.8B |
| EBIT | 6.7B | 13.9B | 10.1B | 9.3B | 5.6B |
| Interest Expense | 371M | 191M | 156M | 350M | 338M |
| Net Income | 5.5B | 12.6B | 15.0B | 7.1B | 3.8B |
| EPS | 1.87 | 4.02 | 4.73 | 2.23 | 1.18 |
| Filing Date | 2022-02-07 | 2023-01-31 | 2024-01-29 | 2025-01-30 | 2026-01-29 |
Income Statement Evolution
Tesla’s revenue grew 76% from 2021 to 2025 but declined 2.9% in the last year. Net income fell 31% over the period, with a sharp 45% drop in the most recent year. Margins weakened significantly, as net margin contracted by 61% overall, reflecting deteriorating profitability despite stable gross and EBIT margins.
Is the Income Statement Favorable?
The 2025 income statement shows a neutral gross margin at 18%, alongside a modest 5.9% EBIT margin. Net margin is low at 4%, declining sharply year-over-year. Favorable interest expense at 0.36% partially offsets weaker operational results. Overall, fundamentals appear unfavorable, with most growth and profitability metrics deteriorating significantly.
Financial Ratios
The following table presents key financial ratios for Tesla, Inc. over the fiscal years 2021 to 2025, illustrating profitability, liquidity, leverage, efficiency, and dividend metrics:
| Ratios | 2021 | 2022 | 2023 | 2024 | 2025 |
|---|---|---|---|---|---|
| Net Margin | 10.3% | 15.4% | 15.5% | 7.3% | 4.0% |
| ROE | 18.3% | 28.1% | 23.9% | 9.8% | 4.6% |
| ROIC | 13.1% | 21.7% | 11.0% | 5.8% | 3.0% |
| P/E | 189 | 31 | 53 | 181 | 383 |
| P/B | 34.5 | 8.6 | 12.6 | 17.7 | 17.7 |
| Current Ratio | 1.38 | 1.53 | 1.73 | 2.02 | 2.16 |
| Quick Ratio | 1.08 | 1.05 | 1.25 | 1.61 | 1.77 |
| D/E | 0.29 | 0.13 | 0.15 | 0.19 | 0.10 |
| Debt-to-Assets | 14.3% | 7.0% | 9.0% | 11.2% | 6.1% |
| Interest Coverage | 17.6x | 71.5x | 57.0x | 20.2x | 12.9x |
| Asset Turnover | 0.87 | 0.99 | 0.91 | 0.80 | 0.69 |
| Fixed Asset Turnover | 1.73 | 2.22 | 2.14 | 1.90 | 2.33 |
| Dividend Yield | 0% | 0% | 0% | 0% | 0% |
Evolution of Financial Ratios
Tesla’s Return on Equity (ROE) declined sharply from 28.15% in 2022 to 4.62% in 2025, signaling weakened profitability. The Current Ratio improved steadily, rising from 1.53 in 2022 to 2.16 in 2025, indicating stronger liquidity. Debt-to-Equity ratio decreased from 0.19 in 2024 to 0.10 in 2025, reflecting reduced financial leverage and a more conservative capital structure.
Are the Financial Ratios Favorable?
In 2025, Tesla shows favorable liquidity with a Current Ratio of 2.16 and Debt-to-Equity at 0.10, supporting short-term obligations and low leverage risk. Profitability ratios like ROE (4.62%) and Net Margin (4.0%) are unfavorable, trailing industry norms. Asset turnover metrics remain neutral, while valuation multiples such as P/E (383) and P/B (17.7) are high, indicating stretched market expectations. Overall, the ratios suggest a slightly unfavorable financial profile.
Shareholder Return Policy
Tesla, Inc. does not pay dividends, reflecting its focus on reinvestment and growth. The company maintains no dividend payout ratio or yield, opting instead to prioritize capital allocation toward innovation and expansion. Tesla also does not engage in share buybacks.
This approach aligns with Tesla’s long-term value creation strategy, emphasizing growth over immediate returns. While shareholders receive no direct income, reinvestment supports sustainable competitive advantage and future profitability, consistent with Tesla’s high valuation and market expectations.
Score analysis
Here is a radar chart illustrating Tesla’s key financial scores across valuation, profitability, and leverage metrics:
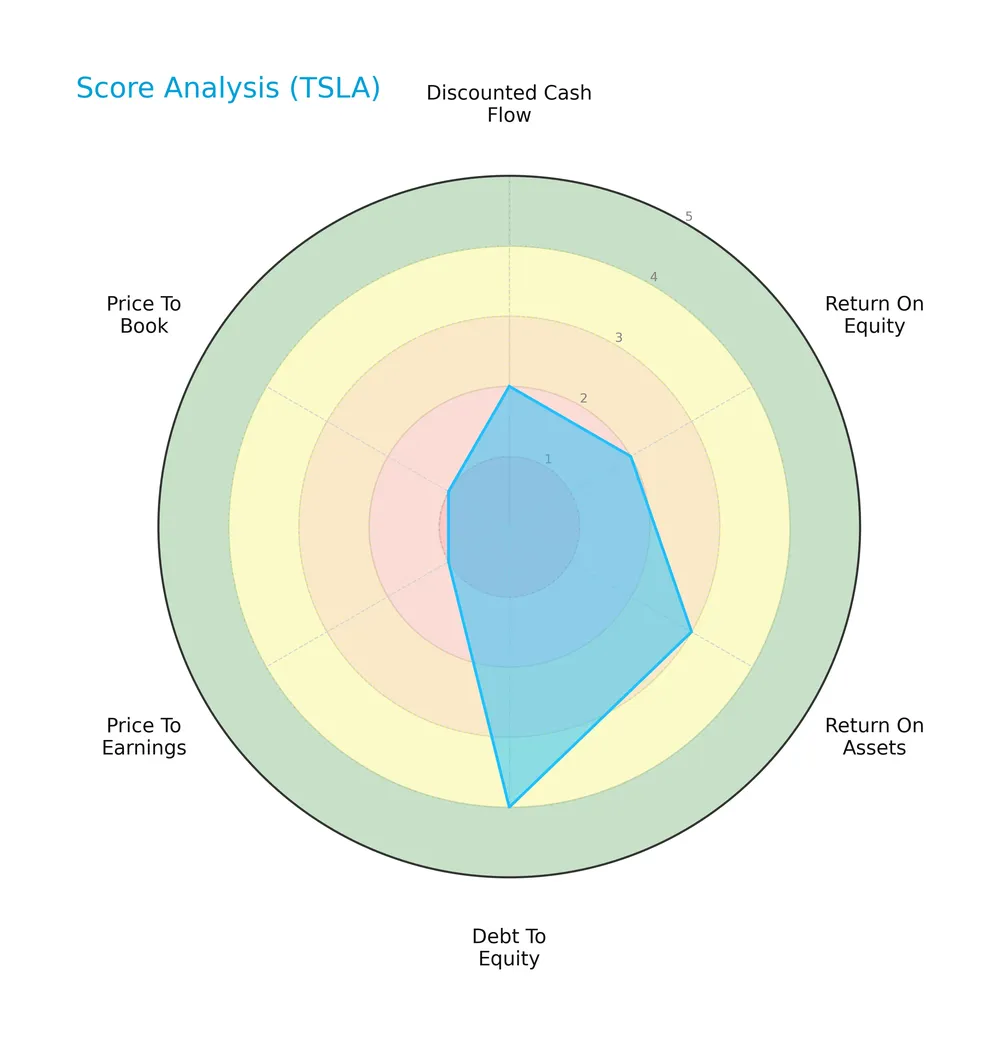
Tesla’s debt-to-equity score stands out as favorable at 4, while return on assets is moderate at 3. However, discounted cash flow and return on equity scores remain unfavorable at 2. Valuation metrics price-to-earnings and price-to-book score very low at 1.
Analysis of the company’s bankruptcy risk
Tesla’s Altman Z-Score places it firmly in the safe zone, indicating a very low risk of bankruptcy:

Is the company in good financial health?
The Piotroski Score diagram shows Tesla with an average financial health score of 6 out of 9:

A score of 6 suggests Tesla maintains moderate financial strength, reflecting stable profitability and operational efficiency, but with room for improvement to reach a strong financial position.
Competitive Landscape & Sector Positioning
This section analyzes Tesla, Inc.’s strategic positioning, revenue segments, key products, and main competitors. I will assess whether Tesla holds a competitive advantage versus its industry peers.
Strategic Positioning
Tesla concentrates on electric vehicles and energy solutions, with Automotive generating $69.5B in 2025. Its Energy segment and Services contribute $12.8B and $12.5B, respectively. Geographically, Tesla earns $47.6B in the US, $21B in China, and $26.2B elsewhere, reflecting both product and geographic diversification.
Revenue by Segment
The pie chart illustrates Tesla’s revenue distribution by segment for the fiscal year 2025, highlighting the company’s diverse business lines and their relative contributions.
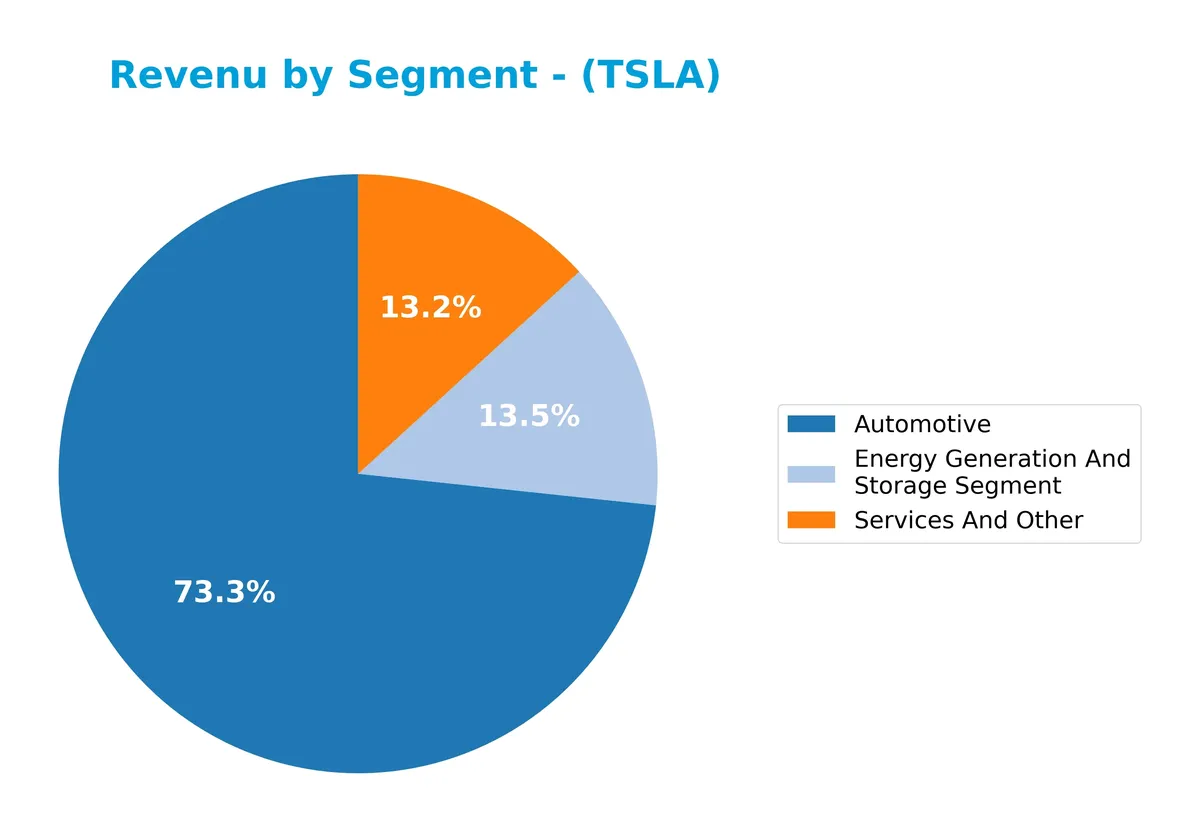
In 2025, Tesla’s Automotive segment remains dominant with $69.5B, reflecting its core revenue driver despite a decline from $77.1B in 2024. The Energy Generation and Storage segment shows steady growth, reaching $12.8B, signaling expanding adoption. Services and Other also grew to $12.5B, indicating diversification. Recent years show a slight revenue concentration risk in Automotive but balanced by robust gains in energy and services.
Key Products & Brands
The table below outlines Tesla’s main products and brands by segment and description:
| Product | Description |
|---|---|
| Automotive | Electric vehicles including sedans and SUVs, regulatory credits, used vehicles, financing, leasing, and vehicle insurance. |
| Energy Generation and Storage | Solar energy generation, energy storage products, installations, sales, leasing, service, repairs, and financing options. |
| Services and Other | After-sales vehicle services, retail merchandise, Tesla Supercharger network, mobile service, and extended warranties. |
Tesla’s portfolio centers on electric vehicles supported by energy solutions and a growing services ecosystem. The company drives revenue diversification across automotive, energy, and service segments.
Main Competitors
Tesla, Inc. operates in a competitive landscape with 3 main players; below is a list of the top 3 leaders by market capitalization:
| Competitor | Market Cap. |
|---|---|
| Tesla, Inc. | 1.41T |
| General Motors Company | 76B |
| Ford Motor Company | 52B |
Tesla ranks first among its competitors with a market cap nearly equal to the sector leader. It trades well above the average market cap of the top 10 and the sector median. The gap between Tesla and its closest competitor is substantial, underscoring its dominant scale in the Auto – Manufacturers industry.
Comparisons with competitors
Check out how we compare the company to its competitors:
Does TSLA have a competitive advantage?
Tesla does not present a competitive advantage based on its ROIC falling 9.7% below WACC and a steep 77% decline in ROIC trend from 2021 to 2025. This indicates the company is shedding value and experiencing declining profitability.
Looking ahead, Tesla’s presence across automotive and energy segments in the US, China, and other countries offers opportunities for growth. Continued innovation in electric vehicles, energy storage, and solar products may shape its future competitive positioning despite recent value erosion.
SWOT Analysis
This SWOT analysis highlights Tesla’s key competitive factors and risks to inform strategic decisions.
Strengths
- Strong brand recognition
- Leading EV technology
- Expanding global footprint
Weaknesses
- Declining profitability
- High valuation multiples
- Negative ROIC vs. WACC
Opportunities
- Growing EV market demand
- Energy storage expansion
- International market growth
Threats
- Intense competition
- Regulatory challenges
- Supply chain volatility
Tesla’s strengths lie in innovation and market position, but deteriorating profitability and valuation risks loom. The company must leverage growth opportunities while managing competitive and regulatory pressures.
Stock Price Action Analysis
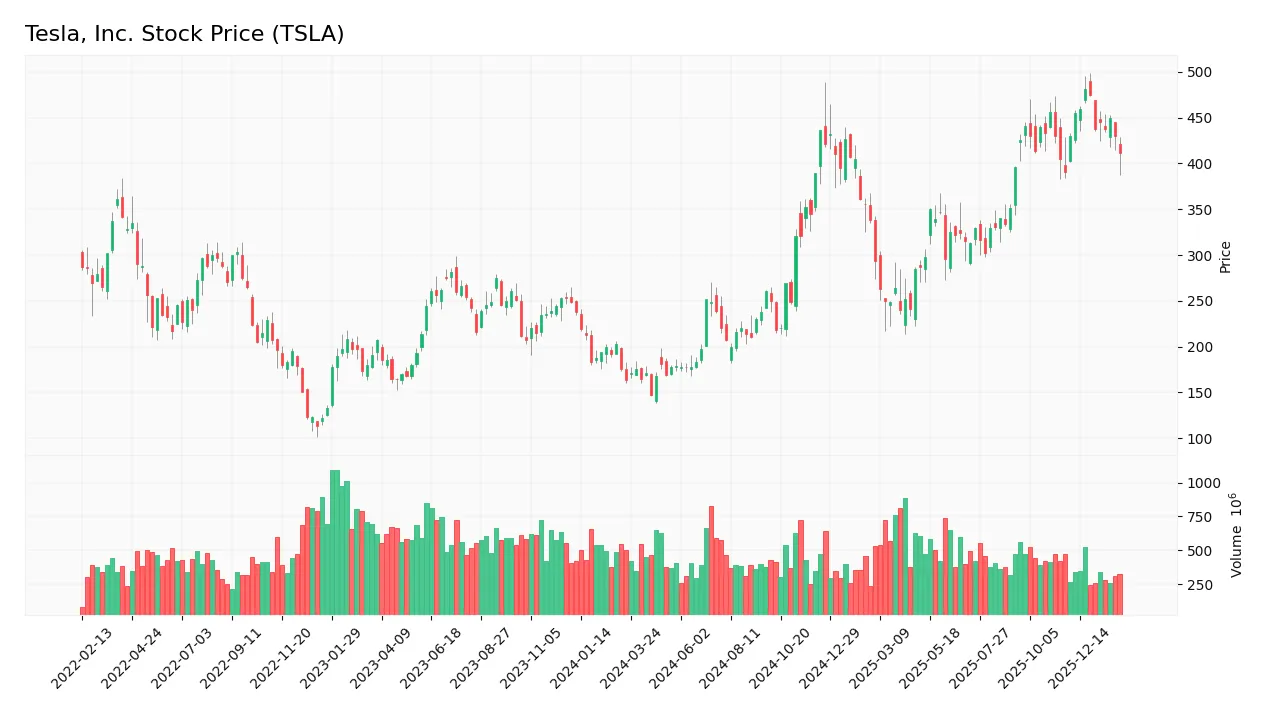
The weekly stock chart below illustrates Tesla, Inc.’s price movements over the past 12 months, highlighting key fluctuations and trend patterns:
Trend Analysis
Over the past year, Tesla’s stock rose 151.34%, indicating a strong bullish trend with notable volatility (std. dev. 95.62). The price peaked at 481.2 and bottomed at 147.05. Recently, the trend showed deceleration. Over the last two and a half months, it gained 5.12% with a slight negative slope (-0.25), reflecting a mild pullback.
Volume Analysis
Trading volume totals 55.7B, with buyer volume slightly surpassing sellers at 50.06%. Over the recent quarter, volume is decreasing despite buyer dominance at 52.49%. This neutral buyer behavior amid falling volumes suggests cautious investor sentiment and lower market participation.
Target Prices
Analysts project a broad range of potential outcomes for Tesla, reflecting both optimism and caution.
| Target Low | Target High | Consensus |
|---|---|---|
| 300 | 600 | 459 |
The consensus target price of $459 suggests moderate upside from current levels. The wide range highlights uncertainty tied to execution and market dynamics.

Don’t Let Luck Decide Your Entry Point
Optimize your entry points with our advanced ProRealTime indicators. You’ll get efficient buy signals with precise price targets for maximum performance. Start outperforming now!
Analyst & Consumer Opinions
This section examines Tesla, Inc.’s analyst ratings and consumer feedback to provide a balanced market perspective.
Stock Grades
Here are the latest verified stock grades for Tesla, Inc. from established financial institutions:
| Grading Company | Action | New Grade | Date |
|---|---|---|---|
| Mizuho | Maintain | Outperform | 2026-01-29 |
| Wedbush | Maintain | Outperform | 2026-01-29 |
| RBC Capital | Maintain | Outperform | 2026-01-29 |
| Cantor Fitzgerald | Maintain | Overweight | 2026-01-29 |
| Wells Fargo | Maintain | Underweight | 2026-01-29 |
| GLJ Research | Maintain | Sell | 2026-01-29 |
| Morgan Stanley | Maintain | Equal Weight | 2026-01-29 |
| Needham | Maintain | Hold | 2026-01-29 |
| Truist Securities | Maintain | Hold | 2026-01-29 |
| Barclays | Maintain | Equal Weight | 2026-01-23 |
The grade distribution reflects a mixed sentiment with a slight bias toward Outperform and Overweight ratings. Several firms maintain Hold or Equal Weight, while a minority express caution with Sell or Underweight grades.
Consumer Opinions
Tesla, Inc. continues to evoke strong reactions from its customer base, reflecting the brand’s bold innovation and occasional operational growing pains.
| Positive Reviews | Negative Reviews |
|---|---|
| Exceptional electric vehicle range | Delivery delays frustrate buyers |
| Cutting-edge autopilot features | Inconsistent build quality |
| Strong brand loyalty and innovation | Customer service responsiveness lags |
Consumers praise Tesla’s advanced technology and impressive EV range. However, recurring issues with delivery timelines and build consistency temper enthusiasm. The brand’s innovation excites buyers, but operational execution remains a key challenge.
Risk Analysis
Below is a concise table summarizing Tesla’s primary risks, their likelihood, and potential impact:
| Category | Description | Probability | Impact |
|---|---|---|---|
| Valuation Risk | Extremely high P/E (383x) and P/B (17.7x) indicate overvaluation | High | High |
| Profitability Risk | Low net margin (4%) and ROIC (2.95%) vs. high WACC (12.61%) | High | High |
| Market Volatility | Beta of 1.89 signals elevated stock price sensitivity | Moderate | Moderate |
| Innovation Risk | Heavy reliance on EV and energy tech innovation | Moderate | High |
| Liquidity Risk | Strong current (2.16) and quick ratios (1.77) reduce liquidity risk | Low | Low |
| Leverage Risk | Low debt-to-equity (0.1) and debt-to-assets (6.08%) | Low | Low |
| Dividend Risk | No dividend yield, limiting income-focused investor appeal | High | Low |
Tesla’s most pressing risks lie in its stretched valuation and weak profitability relative to its cost of capital. Despite a safe Altman Z-score and manageable leverage, the stock trades at a premium that demands flawless execution. Market volatility remains a concern given Tesla’s beta near 1.9. Investors should weigh these risks carefully against Tesla’s innovation-driven growth potential.
Should You Buy Tesla, Inc.?
Tesla appears to be in a safe zone for bankruptcy risk, supported by manageable leverage and moderate operational efficiency. Despite a very unfavorable moat indicating value destruction, the company’s profitability profile could be seen as weakening, resulting in a cautious C+ rating.
Strength & Efficiency Pillars
Tesla, Inc. operates in a safe financial zone with an Altman Z-Score of 16.84, signaling strong solvency. Operationally, the company maintains a positive gross margin at 18.03% and a modest EBIT margin of 5.92%. Despite these, Tesla’s return on invested capital (ROIC) stands at 2.95%, below its weighted average cost of capital (WACC) at 12.61%, indicating value destruction rather than creation. The return on equity is weak at 4.62%, reflecting limited efficiency in generating shareholder returns.
Weaknesses and Drawbacks
Tesla faces significant valuation challenges, with an exorbitant price-to-earnings ratio of 383.0 and a price-to-book ratio of 17.69, implying a steep premium that may not be justified by fundamentals. The company’s profitability metrics are under pressure; net margin is low at 4.0% and declining. Although leverage remains low (debt-to-equity at 0.1) and liquidity is healthy (current ratio 2.16), Tesla’s recent revenue and earnings growth have turned negative, posing risks for sustained financial performance.
Our Final Verdict about Tesla, Inc.
Tesla’s profile appears mixed. The company remains solvent and operationally stable, yet it suffers from value erosion and weak profitability metrics. Despite a bullish long-term trend, recent deceleration and neutral buyer dominance of 52.49% suggest a cautious stance. Investors might consider waiting for improved fundamentals or a more attractive valuation before adding exposure. The profile may appear speculative given the high valuation and operational headwinds.
Disclaimer: This content is for informational purposes only and does not constitute financial, investment, or other professional advice. Investing in financial markets involves a significant risk of loss, and past performance is not indicative of future results.
Additional Resources
- Here’s Why This Investor Just Purchased $1 Million TSLA Stock: ‘Never Bet Against…’ – Benzinga (Feb 04, 2026)
- “Tesla (TSLA) Was Fabulous,” Says Jim Cramer – Yahoo Finance (Feb 06, 2026)
- After Earnings, Is Tesla Stock a Buy, a Sell, or Fairly Valued? – morningstar.com (Feb 05, 2026)
- Tesla: From EV Maker To AI Empire (NASDAQ:TSLA) – Seeking Alpha (Feb 05, 2026)
- Waymo Raises Another Red Flag for Tesla. Should You Sell TSLA Stock in February 2026? – Barchart.com (Feb 04, 2026)
For more information about Tesla, Inc., please visit the official website: tesla.com