Home > Analyses > Technology > Teradyne, Inc.
Teradyne powers the semiconductor and automation industries with cutting-edge test and robotic technologies that touch billions of devices worldwide. Its flagship test platforms set the standard for quality and reliability across automotive, consumer electronics, and wireless communications. Known for relentless innovation, Teradyne shapes how chips and smart machines perform under pressure. As market dynamics evolve rapidly, I question whether Teradyne’s robust fundamentals still justify its premium valuation and growth expectations.

Table of contents
Business Model & Company Overview
Teradyne, Inc., founded in 1960 and headquartered in North Reading, Massachusetts, dominates the semiconductor test equipment industry. It delivers an integrated ecosystem spanning Semiconductor Test, System Test, Industrial Automation, and Wireless Test segments. This core mission supports diverse applications from automotive to cloud computing, enabling precision and reliability across global technology supply chains.
Teradyne generates value through a balanced mix of advanced hardware platforms and sophisticated software solutions, complemented by recurring service offerings. Its strategic footprint spans the Americas, Europe, and Asia, serving semiconductor manufacturers, defense clients, and industrial automation markets. The company’s economic moat lies in its proprietary test technologies and deep integration with evolving semiconductor and automation ecosystems, positioning it as a pivotal industry innovator.
Financial Performance & Fundamental Metrics
I analyze Teradyne, Inc.’s income statement, key financial ratios, and dividend payout policy to reveal its operational efficiency and shareholder return strategy.
Income Statement
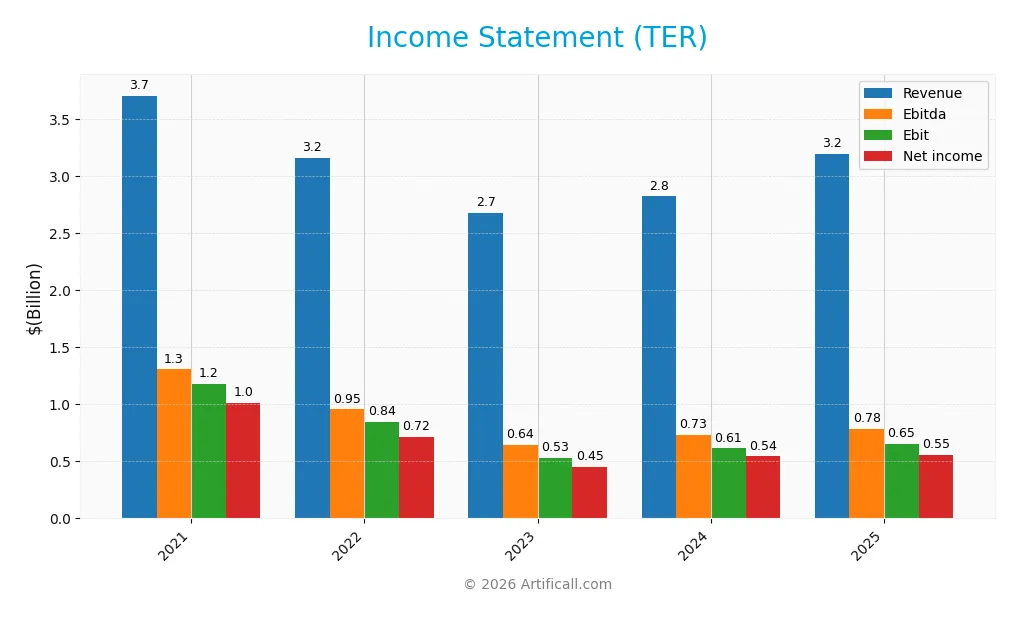
Below is Teradyne, Inc.’s income statement summary for the fiscal years 2021 through 2025, showing key profitability metrics and earnings per share.
| 2021 | 2022 | 2023 | 2024 | 2025 | |
|---|---|---|---|---|---|
| Revenue | 3.70B | 3.16B | 2.68B | 2.82B | 3.19B |
| Cost of Revenue | 1.50B | 1.29B | 1.14B | 1.17B | 1.32B |
| Operating Expenses | 1.01B | 1.04B | 1.04B | 1.06B | 1.17B |
| Gross Profit | 2.21B | 1.87B | 1.54B | 1.65B | 1.87B |
| EBITDA | 1.30B | 955M | 640M | 732M | 780M |
| EBIT | 1.18B | 844M | 529M | 613M | 653M |
| Interest Expense | 18M | 3.7M | 3.8M | 3.6M | 8.0M |
| Net Income | 1.01B | 716M | 449M | 542M | 554M |
| EPS | 6.15 | 4.52 | 2.91 | 3.41 | 3.49 |
| Filing Date | 2022-02-23 | 2023-02-22 | 2024-02-22 | 2025-02-20 | 2026-02-19 |
Income Statement Evolution
Teradyne’s revenue declined 14% from 2021 to 2025 but rebounded 13% in 2025 alone. Net income followed this volatile trend, falling 45% overall yet rising 2.1% in 2025. Gross margin remained robust near 59%, supporting stable profitability despite margin compression over the period.
Is the Income Statement Favorable?
In 2025, Teradyne posted $3.19B revenue and $554M net income, yielding a 17.4% net margin. Operating expenses grew proportionally with revenue, maintaining a favorable EBIT margin above 20%. Interest expenses stayed low at 0.25% of revenue. Despite a slight net margin dip year-over-year, fundamentals appear generally favorable given solid margins and improving earnings per share.
Financial Ratios
The table below summarizes key financial ratios for Teradyne, Inc. over the last five fiscal years, providing insight into profitability, liquidity, leverage, and efficiency:
| Ratios | 2021 | 2022 | 2023 | 2024 | 2025 |
|---|---|---|---|---|---|
| Net Margin | 27% | 23% | 17% | 19% | 17% |
| ROE | 40% | 29% | 18% | 19% | 20% |
| ROIC | 34% | 25% | 15% | 17% | 18% |
| P/E | 27 | 19 | 37 | 37 | 55 |
| P/B | 11 | 6 | 7 | 7 | 11 |
| Current Ratio | 3.20 | 3.03 | 3.28 | 2.91 | 1.76 |
| Quick Ratio | 2.44 | 1.93 | 2.05 | 1.84 | 1.41 |
| D/E | 0.09 | 0.08 | 0.06 | 0.05 | 0.12 |
| Debt-to-Assets | 6% | 6% | 4% | 4% | 8% |
| Interest Coverage | 67 | 224 | 132 | 166 | 86 |
| Asset Turnover | 0.97 | 0.90 | 0.77 | 0.76 | 0.76 |
| Fixed Asset Turnover | 8.12 | 6.41 | 5.16 | 4.88 | 4.99 |
| Dividend Yield | 0.24% | 0.50% | 0.41% | 0.38% | 0.25% |
Evolution of Financial Ratios
Teradyne’s Return on Equity (ROE) declined steadily from 39.6% in 2021 to 19.8% in 2025, signaling reduced profitability. The Current Ratio contracted from 3.2 to 1.76, indicating tighter liquidity over time. Debt-to-Equity Ratio remained low and stable, around 0.12 in 2025, reflecting consistent low leverage.
Are the Financial Ratios Favorable?
In 2025, Teradyne exhibits favorable profitability with a 17.4% net margin and 19.8% ROE, both above typical market averages. Liquidity ratios are solid, with a current ratio of 1.76 and quick ratio of 1.41. Leverage stays conservative, debt-to-equity at 0.12, and interest coverage very strong at 81.4. However, valuation metrics such as P/E of 54.6 and P/B of 10.8 appear stretched, and dividend yield is low at 0.25%. Overall, 64% of ratios are favorable, supporting a generally positive financial profile.
Shareholder Return Policy
Teradyne, Inc. maintains a consistent dividend payment with a payout ratio around 14%, a modest yield near 0.25%-0.5%, and annual dividends rising steadily to $0.49 per share in 2025. The company supports shareholder returns through dividends and maintains coverage by free cash flow, indicating prudent capital allocation.
Teradyne also appears to engage in share buybacks, complementing dividends as part of its return strategy. This balanced approach supports sustainable long-term shareholder value, as dividend payments remain covered by operating cash flow and capital expenditures, minimizing risks of unsustainable distributions or excessive repurchases.
Score analysis
Here is a radar chart summarizing Teradyne, Inc.’s key financial scores across valuation, profitability, and leverage metrics:
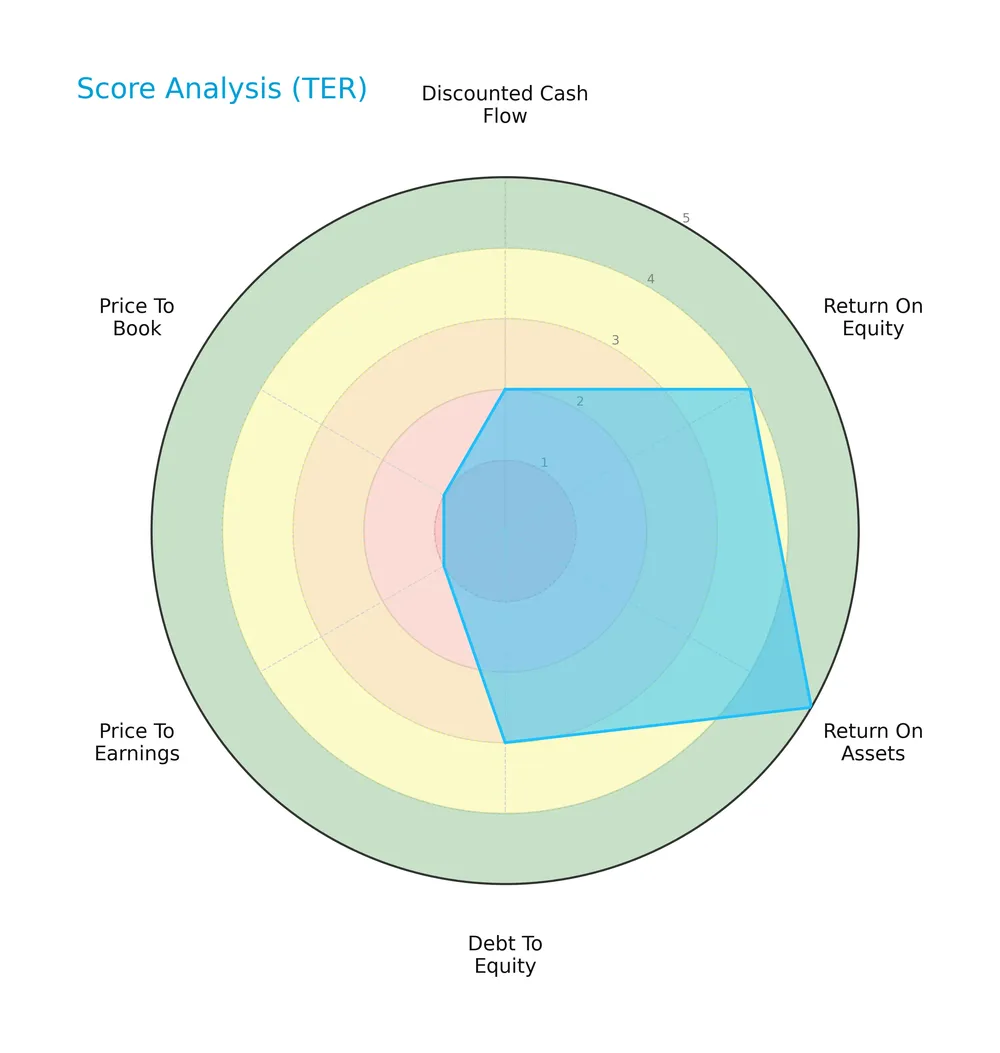
Teradyne scores very favorably on return on assets (5) and favorably on return on equity (4). Its debt-to-equity ratio is moderate (3). However, valuation metrics price-to-earnings (1) and price-to-book (1) are very unfavorable, while discounted cash flow is unfavorable (2). Overall, the company’s scores indicate mixed fundamentals with strong profitability but weak valuation metrics.
Analysis of the company’s bankruptcy risk
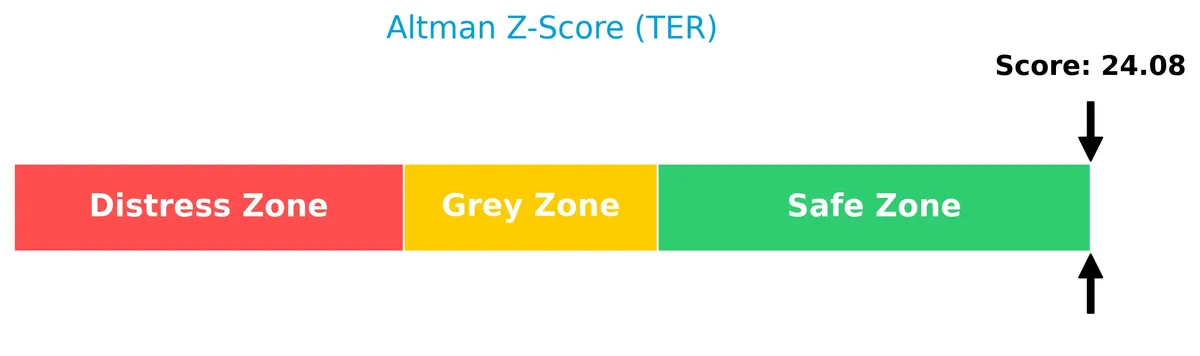
The Altman Z-Score places Teradyne well within the safe zone, indicating a very low risk of bankruptcy:
Is the company in good financial health?
The Piotroski Score diagram provides insight into Teradyne’s financial health based on profitability, leverage, and efficiency metrics:

Teradyne’s Piotroski Score of 6 suggests average financial health. This indicates the company shows reasonable strength but falls short of top-tier financial robustness in this scoring framework.
Competitive Landscape & Sector Positioning
This section analyzes Teradyne, Inc.’s strategic positioning, revenue segments, key products, and main competitors. I will assess whether Teradyne holds a competitive advantage over its industry peers.
Strategic Positioning
Teradyne maintains a diversified product portfolio spanning Semiconductor Test, System Test, Industrial Automation, and Wireless Test segments. Geographically, it distributes revenue across major Asian markets and the U.S., with Taiwan, Korea, China, and the U.S. as key revenue contributors, reflecting broad global exposure.
Revenue by Segment
The pie chart illustrates Teradyne, Inc.’s revenue distribution by segment for fiscal year 2025, highlighting the relative contributions of Product and Service lines.
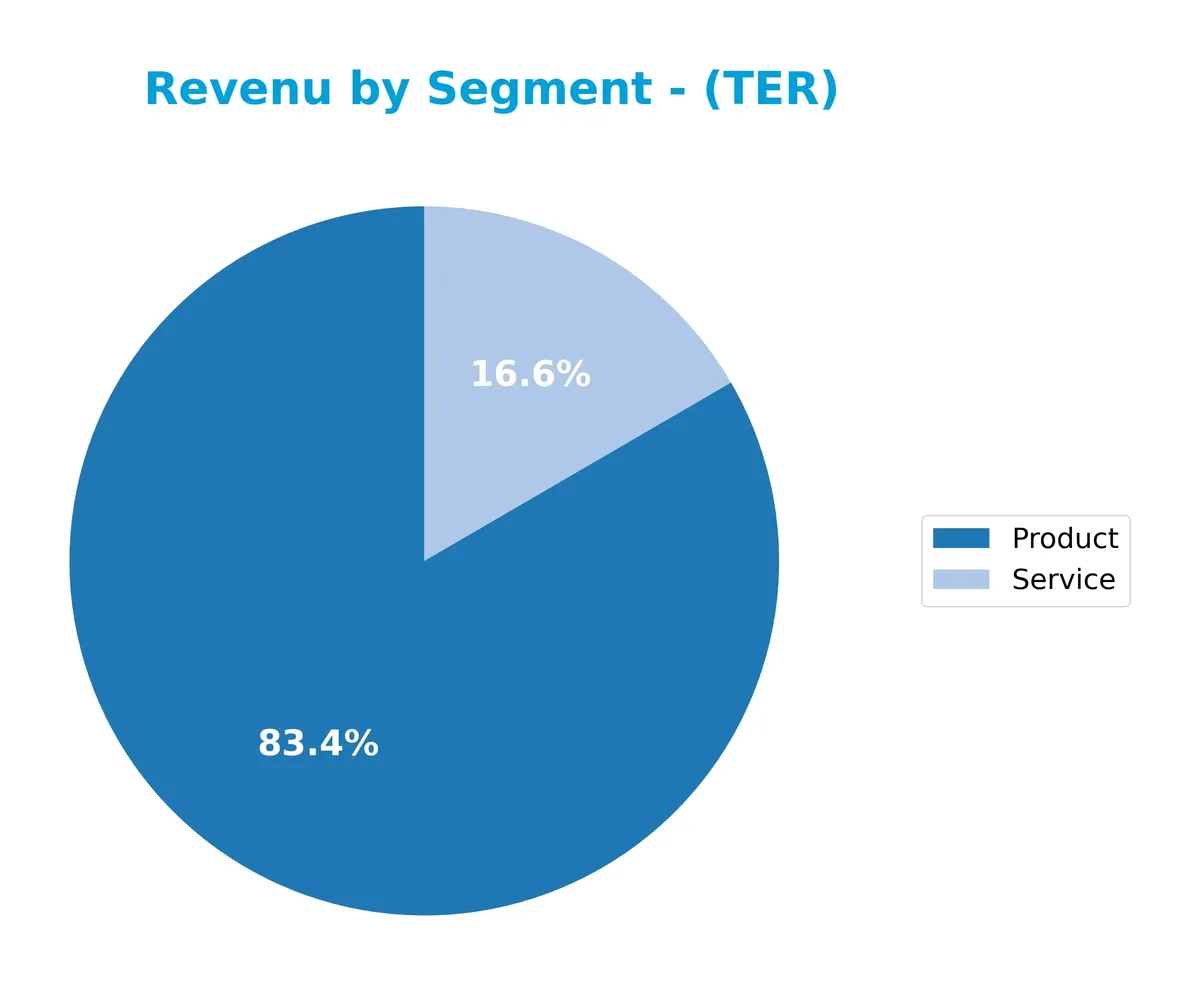
In 2025, Product revenue led at $2.66B, showing steady growth from $2.09B in 2023. Service revenue remained stable near $530M, reflecting a consistent but smaller business pillar. The Product segment drives Teradyne’s revenue growth, while Service provides recurring income. Recent years show a rebound in Product sales after a dip in 2023, reducing concentration risk by balancing both segments effectively.
Key Products & Brands
Teradyne’s product portfolio spans automatic test equipment and industrial automation solutions, segmented as follows:
| Product | Description |
|---|---|
| Semiconductor Test | Equipment for wafer and device package testing, including FLEX, J750, Magnum, and ETS platforms, serving fabs and fabless firms. |
| System Test | Defense/aerospace test instruments, storage test systems, and circuit-board test and inspection solutions. |
| Industrial Automation | Collaborative robotic arms, autonomous mobile robots, and advanced control software for manufacturing and logistics. |
| Wireless Test | Test solutions under the LitePoint brand for wireless devices, supporting Wi-Fi, GSM, LTE, 5G, and IoT device testing. |
Teradyne’s diverse offerings address semiconductor manufacturing, defense, industrial automation, and wireless device testing, reflecting a broad technology footprint.
Main Competitors
The semiconductor sector includes 38 competitors, with the following table showing the top 10 leaders by market capitalization:
| Competitor | Market Cap. |
|---|---|
| NVIDIA Corporation | 4.6T |
| Broadcom Inc. | 1.6T |
| Taiwan Semiconductor Manufacturing Company Limited | 1.6T |
| ASML Holding N.V. | 415B |
| Advanced Micro Devices, Inc. | 363B |
| Micron Technology, Inc. | 353B |
| Lam Research Corporation | 232B |
| Applied Materials, Inc. | 214B |
| QUALCOMM Incorporated | 185B |
| Intel Corporation | 173B |
Teradyne, Inc. ranks 19th among 38 competitors, with a market cap just 1.12% of the sector leader, NVIDIA. It sits below the average market cap of the top 10 leaders (974B) but above the sector median (31B). Teradyne’s market cap trails its closest competitor above by approximately 32.2%, indicating a notable gap in scale within the mid-tier segment.
Comparisons with competitors
Check out how we compare the company to its competitors:
Does Teradyne have a competitive advantage?
Teradyne presents a competitive advantage, as its ROIC exceeds WACC by 6.27%, indicating value creation despite a declining profitability trend. Its diversified segments in semiconductor test, system test, industrial automation, and wireless test support steady revenue streams.
Looking ahead, Teradyne’s product platforms like FLEX, J750, and Magnum target expanding semiconductor markets including automotive and cloud computing. The company also explores growth in industrial automation and 5G wireless testing, offering potential for future market opportunities.
SWOT Analysis
This analysis highlights Teradyne’s key internal and external factors shaping its competitive position.
Strengths
- Strong gross margin at 58.55%
- High ROIC of 18.45% well above WACC
- Diversified product segments including industrial automation
Weaknesses
- Declining revenue and net income over 5 years
- High valuation multiples: PE 54.64, PB 10.83
- Net margin growth negative in long term
Opportunities
- Growth in semiconductor testing for 5G and IoT devices
- Expansion in emerging Asian markets like Taiwan and Korea
- Increasing automation demand in manufacturing
Threats
- High beta of 1.82 indicating stock volatility
- Competitive pressure from other semiconductor test equipment firms
- Geopolitical risks affecting global supply chains
Teradyne’s strengths in profit margins and innovation support value creation despite a declining profitability trend. The company must leverage growth opportunities in automation and wireless testing while managing valuation risks and global uncertainties.
Stock Price Action Analysis
The weekly chart illustrates Teradyne, Inc.’s stock price movements over the past 12 months, revealing key highs, lows, and trend shifts:
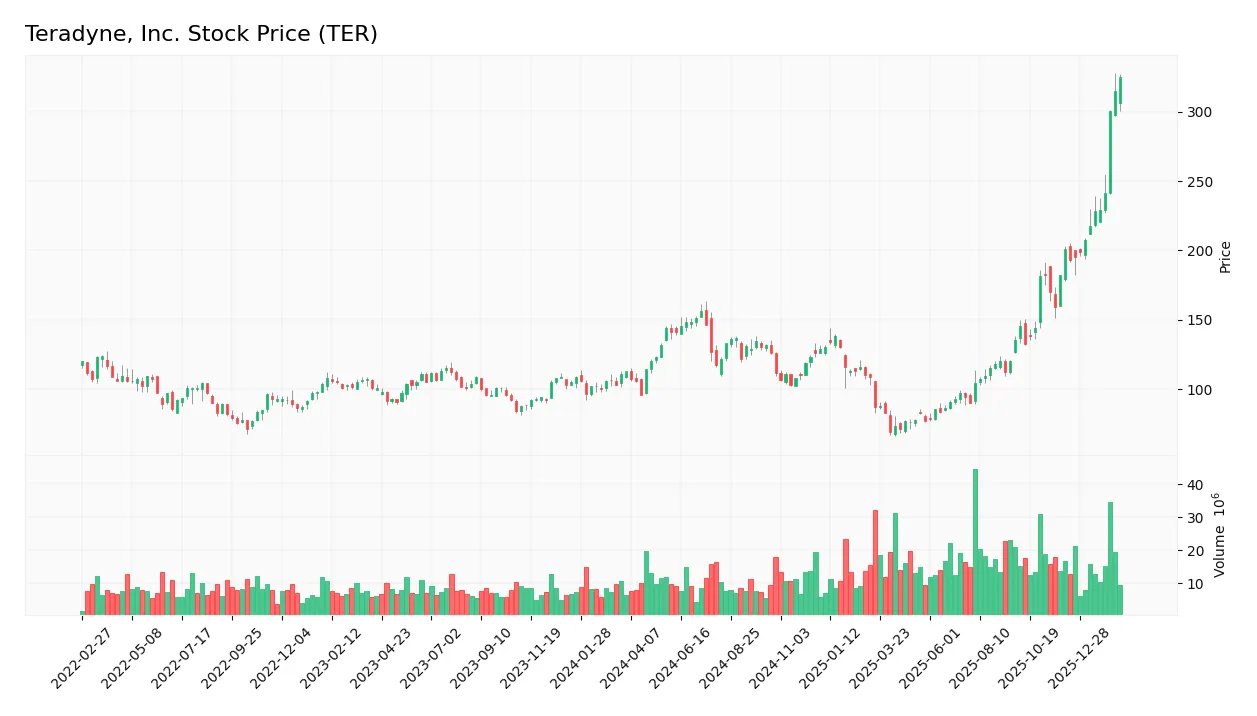
Trend Analysis
Over the past 12 months, Teradyne’s stock rose 188%, confirming a strong bullish trend with clear acceleration. Volatility is high, with a standard deviation of 48.37. The price ranged from a low of 68.72 to a peak of 324.85, underscoring substantial upward momentum.
Volume Analysis
Trading volume shows a clear buyer-driven pattern, with buyers accounting for 64.4% of total volume, which is increasing overall. In the recent three months, buyer dominance surged to 93%, signaling robust investor confidence and heightened market participation.
Target Prices
Analysts show a bullish consensus for Teradyne, Inc., reflecting confidence in its growth prospects.
| Target Low | Target High | Consensus |
|---|---|---|
| 175 | 335 | 278 |
The target range spans from 175 to 335, with a consensus around 278, indicating solid upside potential based on current valuations.

Don’t Let Luck Decide Your Entry Point
Optimize your entry points with our advanced ProRealTime indicators. You’ll get efficient buy signals with precise price targets for maximum performance. Start outperforming now!
Analyst & Consumer Opinions
This section examines the latest analyst ratings and consumer feedback related to Teradyne, Inc.’s performance and reputation.
Stock Grades
Here are the latest verified stock grades for Teradyne, Inc. from leading financial institutions:
| Grading Company | Action | New Grade | Date |
|---|---|---|---|
| Citigroup | Maintain | Buy | 2026-02-04 |
| Goldman Sachs | Maintain | Buy | 2026-02-04 |
| Cantor Fitzgerald | Maintain | Overweight | 2026-02-04 |
| Evercore ISI Group | Maintain | Outperform | 2026-02-04 |
| Stifel | Maintain | Buy | 2026-02-04 |
| Evercore ISI Group | Maintain | Outperform | 2026-02-03 |
| Cantor Fitzgerald | Maintain | Overweight | 2026-02-02 |
| Stifel | Maintain | Buy | 2026-01-30 |
| UBS | Maintain | Buy | 2026-01-26 |
| B of A Securities | Maintain | Buy | 2026-01-22 |
The consensus across respected firms remains bullish, with a clear preference for “Buy” or equivalent ratings. No downgrades or negative outlooks appear, reflecting steady confidence in Teradyne’s outlook.
Consumer Opinions
Teradyne, Inc. consistently earns praise for innovation but faces criticism on service responsiveness.
| Positive Reviews | Negative Reviews |
|---|---|
| “Teradyne’s testing equipment is highly reliable and boosts our production efficiency.” | “Customer support response times are slower than expected, causing project delays.” |
| “Their automation solutions significantly reduce manual errors and operational costs.” | “Some software updates have introduced bugs, affecting workflow temporarily.” |
| “The company’s commitment to cutting-edge technology keeps us ahead of competitors.” | “Pricing is on the higher side compared to alternative suppliers in the market.” |
Overall, customers appreciate Teradyne’s advanced technology and reliability. However, service speed and cost remain recurring concerns that could impact long-term client retention.
Risk Analysis
Below is a summary table outlining key risks Teradyne, Inc. faces, categorized by their nature, likelihood, and potential impact on the business:
| Category | Description | Probability | Impact |
|---|---|---|---|
| Valuation Risk | High P/E (54.64) and P/B (10.83) ratios indicate expensive stock relative to earnings and book value. | High | High |
| Market Volatility | Beta of 1.82 suggests stock price swings significantly more than the market, increasing volatility risk. | High | Medium |
| Industry Cyclicality | Semiconductor sector prone to cyclical downturns affecting demand for test equipment. | Medium | High |
| Competitive Risk | Innovation pressure and rapid tech shifts could erode Teradyne’s moat in automation and testing. | Medium | Medium |
| Dividend Yield Risk | Low dividend yield (0.25%) may deter income-focused investors and impact stock appeal. | Low | Low |
| Financial Stability | Strong Altman Z-score (24.08) signals low bankruptcy risk; however, moderate Piotroski score (6) suggests some operational caution. | Low | Low |
The most pressing risks stem from Teradyne’s elevated valuation and market volatility. Despite solid financial fundamentals, the stock trades at a premium, raising correction risk if semiconductor demand softens. The sector’s cyclical nature remains a significant factor, historically driving sharp earnings swings. Investors should monitor industry trends closely alongside market sentiment.
Should You Buy Teradyne, Inc.?
Teradyne, Inc. appears to be a robust operator with a slightly favorable moat, indicating value creation despite declining profitability. Its debt profile is manageable, supporting operational efficiency. The overall rating of B suggests a very favorable but cautious investment profile.
Strength & Efficiency Pillars
Teradyne, Inc. demonstrates solid operational efficiency with a net margin of 17.37% and a return on equity (ROE) of 19.82%. Its return on invested capital (ROIC) stands at 18.45%, comfortably above the weighted average cost of capital (WACC) at 12.18%, confirming it as a clear value creator. The company’s gross margin at 58.55% and EBIT margin of 20.48% further underline strong profitability. These metrics suggest Teradyne effectively converts revenue into profit while generating returns exceeding its capital costs, a hallmark of sustainable value creation.
Weaknesses and Drawbacks
Despite operational strengths, Teradyne faces valuation headwinds with a high price-to-earnings ratio of 54.64 and a price-to-book ratio of 10.83, both flagged as very unfavorable. These metrics indicate a premium valuation that may limit upside potential. Additionally, the company’s dividend yield is low at 0.25%, which might deter income-focused investors. While leverage ratios are favorable, the elevated valuation multiples pose a risk if growth slows or market sentiment shifts, potentially leading to price pressure.
Our Final Verdict about Teradyne, Inc.
Teradyne’s fundamental profile appears robust with strong profitability and value creation signals. The stock’s bullish longer-term trend, coupled with strong buyer dominance recently, suggests positive momentum. However, the elevated valuation multiples could imply limited margin for error. Investors might consider a cautious approach, as the profile suggests potential but also signals the need for careful timing before committing capital.
Disclaimer: This content is for informational purposes only and does not constitute financial, investment, or other professional advice. Investing in financial markets involves a significant risk of loss, and past performance is not indicative of future results.
Additional Resources
- Teradyne Inc (TER) Shares Up 3.03% on Feb 20 – GuruFocus (Feb 20, 2026)
- Teradyne (TER) NASDAQ $315.90 pre-mkt Feb 20 2026: AI demand could lift guidance – Meyka (Feb 20, 2026)
- Teradyne Surges 88% in Three Months: Time to Buy the Stock? – Yahoo Finance (Feb 16, 2026)
- TERADYNE, INC SEC 10-K Report – TradingView (Feb 19, 2026)
- Teradyne (TER) rockets 24% as 11 analysts hike PT after strong earnings – MSN (Feb 18, 2026)
For more information about Teradyne, Inc., please visit the official website: teradyne.com