Home > Analyses > Technology > Teradata Corporation
Teradata transforms how enterprises unlock value from data, powering smarter decisions that shape industries worldwide. Its flagship platform, Teradata Vantage, integrates diverse data sources across multi-cloud environments, streamlining analytics for sectors like finance, healthcare, and retail. Renowned for innovation and robust infrastructure, Teradata stands at the forefront of data analytics evolution. The critical question now is whether its strategic positioning and financial health support sustained growth and justify its current market valuation.

Table of contents
Business Model & Company Overview
Teradata Corporation, founded in 1979 and headquartered in San Diego, California, dominates the Software – Infrastructure industry with its connected multi-cloud data platform. Its flagship product, Teradata Vantage, creates an integrated ecosystem that enables enterprises to unify diverse data sources for advanced analytics and cloud migration. This cohesive approach drives simplification and operational efficiency across sectors like financial services, healthcare, and telecommunications.
The company’s revenue engine balances software licensing with consulting and support services, emphasizing recurring value through its multi-cloud architecture. Teradata’s strategic footprint spans the Americas, Europe, the Middle East, Africa, and Asia Pacific, enabling global reach and customer intimacy. Its competitive advantage lies in delivering scalable, enterprise-grade analytics infrastructure that shapes the future of data-driven decision-making.
Financial Performance & Fundamental Metrics
I analyze Teradata Corporation’s income statement, key financial ratios, and dividend payout policy to assess its profitability, efficiency, and shareholder returns.
Income Statement
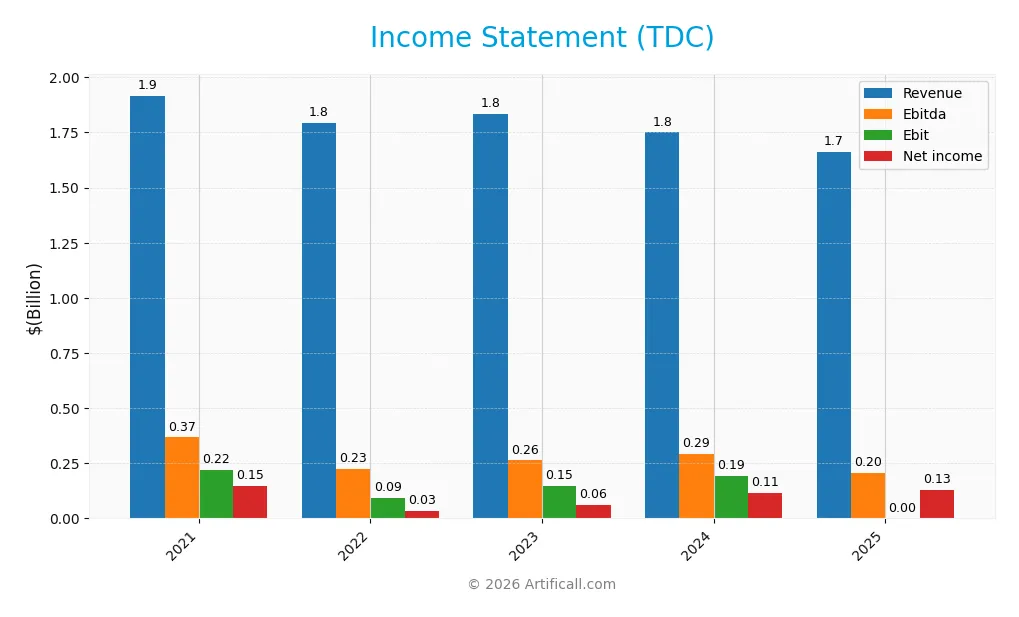
The table below summarizes Teradata Corporation’s key income statement metrics for the fiscal years 2021 through 2025, showing revenue, expenses, profits, and earnings per share.
| 2021 | 2022 | 2023 | 2024 | 2025 | |
|---|---|---|---|---|---|
| Revenue | 1.92B | 1.80B | 1.83B | 1.75B | 1.66B |
| Cost of Revenue | 731M | 714M | 718M | 692M | 670M |
| Operating Expenses | 955M | 963M | 929M | 849M | 782M |
| Gross Profit | 1.19B | 1.08B | 1.12B | 1.06B | 993M |
| EBITDA | 367M | 225M | 263M | 293M | 301M |
| EBIT | 218M | 91M | 147M | 193M | 211M |
| Interest Expense | 26M | 24M | 30M | 29M | 0 |
| Net Income | 147M | 33M | 62M | 114M | 130M |
| EPS | 1.35 | 0.32 | 0.62 | 1.18 | 1.38 |
| Filing Date | 2022-02-25 | 2023-02-24 | 2024-02-23 | 2025-02-21 | 2026-02-27 |
Income Statement Evolution
Teradata’s revenue declined by 5% in 2025, continuing a downward trend since 2021. Gross profit fell 6%, reflecting pressure on cost efficiency. Despite this, EBIT rose 9% in 2025, indicating improved operating leverage. Margins remain solid with a gross margin near 60% and an EBIT margin around 13%, stable over the period.
Is the Income Statement Favorable?
The 2025 income statement shows generally favorable fundamentals. Net income increased 14% year-over-year, lifting net margin to 7.8%. Operating expenses decreased proportionally with revenue, supporting margin expansion. Interest expense was negligible, enhancing profitability. Overall, Teradata demonstrates disciplined cost control despite softer top-line growth, indicating a resilient profit structure.
Financial Ratios
The following table summarizes key financial ratios for Teradata Corporation (TDC) over the past five fiscal years, illustrating profitability, liquidity, leverage, and valuation metrics:
| Ratios | 2021 | 2022 | 2023 | 2024 | 2025 |
|---|---|---|---|---|---|
| Net Margin | 7.7% | 1.8% | 3.4% | 6.5% | 7.8% |
| ROE | 31.9% | 12.8% | 45.9% | 85.7% | 56.5% |
| ROIC | 13.5% | 5.3% | 10.2% | 16.9% | 16.4% |
| P/E | 31.4 | 105.3 | 70.0 | 26.3 | 22.1 |
| P/B | 10.0 | 13.5 | 32.2 | 22.6 | 12.5 |
| Current Ratio | 1.07 | 1.02 | 0.87 | 0.81 | 0.92 |
| Quick Ratio | 1.05 | 1.01 | 0.86 | 0.79 | 0.90 |
| D/E | 1.24 | 2.47 | 4.74 | 4.33 | 2.44 |
| Debt-to-Assets | 26.4% | 31.5% | 34.2% | 33.8% | 31.5% |
| Interest Coverage | 8.9 | 4.9 | 6.2 | 7.2 | 0 |
| Asset Turnover | 0.88 | 0.89 | 0.98 | 1.03 | 0.93 |
| Fixed Asset Turnover | 6.1 | 7.0 | 7.4 | 9.1 | 8.1 |
| Dividend Yield | 0% | 0% | 0% | 0% | 0% |
Evolution of Financial Ratios
Teradata’s Return on Equity (ROE) surged sharply, peaking at 85.7% in 2024 before moderating to 56.5% in 2025, indicating fluctuating profitability. The Current Ratio declined from above 1.0 in 2021 to 0.92 in 2025, signaling tightening liquidity. The Debt-to-Equity Ratio rose from 1.24 in 2021 to 4.74 in 2023, then improved to 2.44 by 2025, showing variable leverage management.
Are the Financial Ratios Fovorable?
In 2025, profitability ratios like ROE (56.5%) and ROIC (16.4%) outperform WACC (5.5%), reflecting strong capital efficiency. Liquidity ratios remain mixed: a low Current Ratio (0.92) is unfavorable, while the Quick Ratio (0.9) is neutral. Debt metrics show moderate risk with a 2.44 Debt-to-Equity ratio. Market multiples such as P/E (22.1) are neutral, but the elevated Price-to-Book (12.49) ratio is unfavorable. Overall, Teradata’s ratios are slightly favorable with notable risks.
Shareholder Return Policy
Teradata Corporation does not pay dividends, reflecting a strategic choice to reinvest earnings. The company may prioritize growth initiatives or R&D over immediate shareholder payouts. It does not appear to engage in share buybacks, limiting direct capital returns.
This approach aligns with sustaining long-term value by focusing on operational improvements and cash flow generation. However, investors should monitor the absence of distributions alongside the company’s leverage and cash flow metrics to assess financial flexibility.
Score analysis
The following radar chart presents Teradata Corporation’s key financial scores for a comprehensive view:
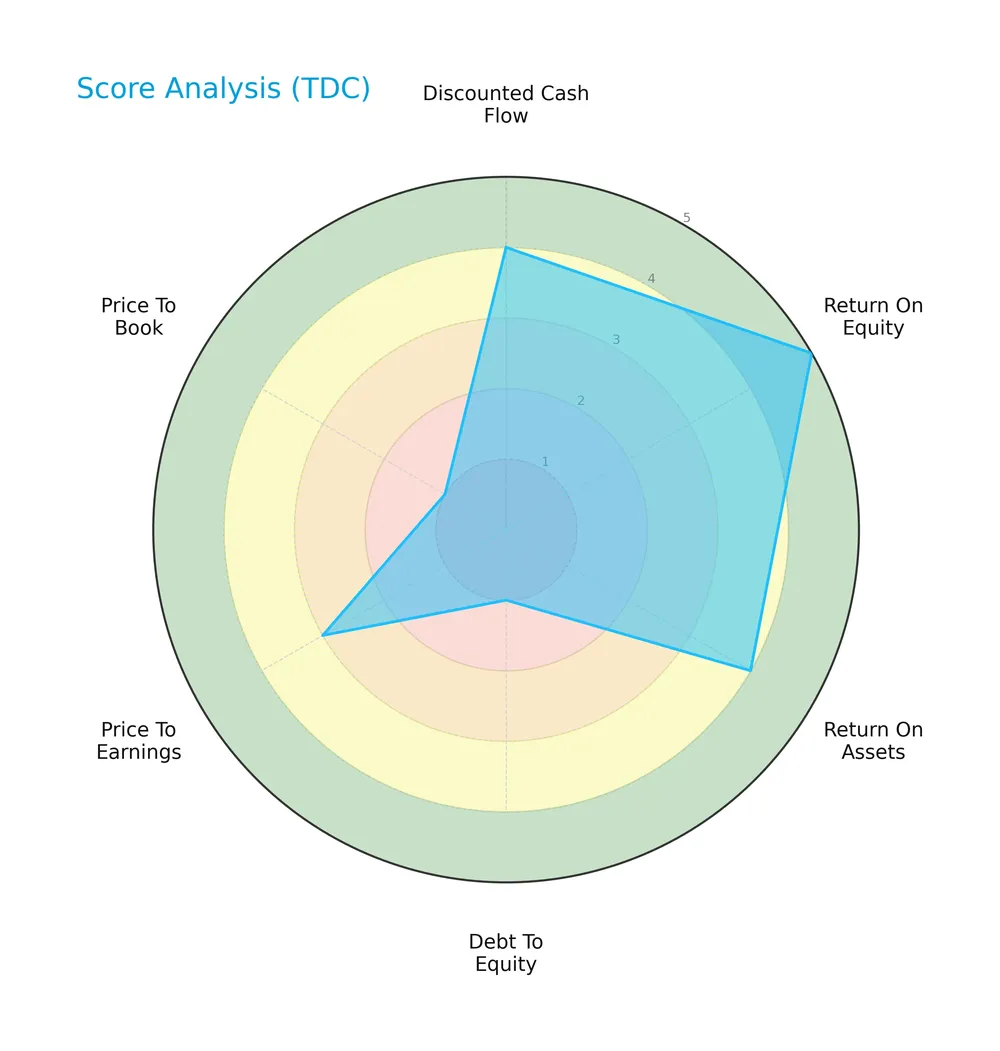
Teradata’s discounted cash flow, return on equity, and return on assets scores are favorable to very favorable. However, its debt-to-equity, price-to-earnings, and price-to-book scores signal significant weaknesses in leverage and valuation metrics.
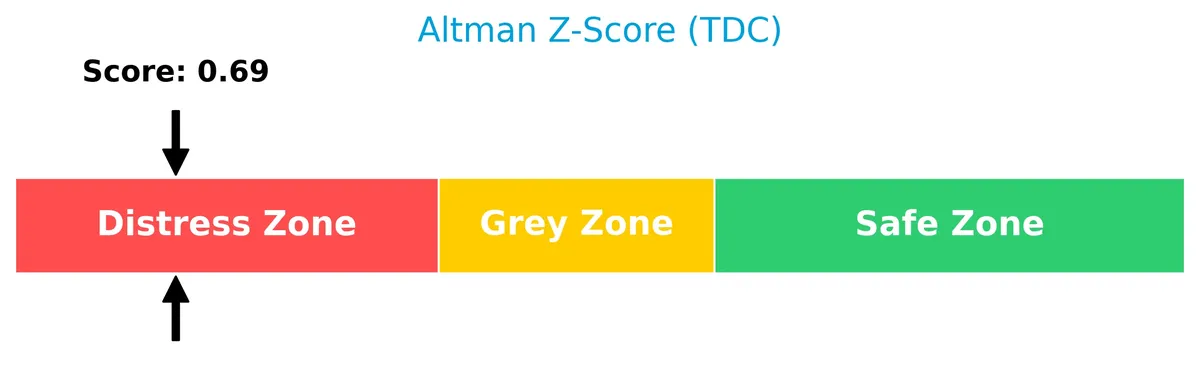
Analysis of the company’s bankruptcy risk
Teradata’s Altman Z-Score places it firmly in the distress zone, indicating a high risk of bankruptcy:
Is the company in good financial health?
The Piotroski diagram below illustrates Teradata’s strong financial health based on profitability, leverage, liquidity, and efficiency criteria:
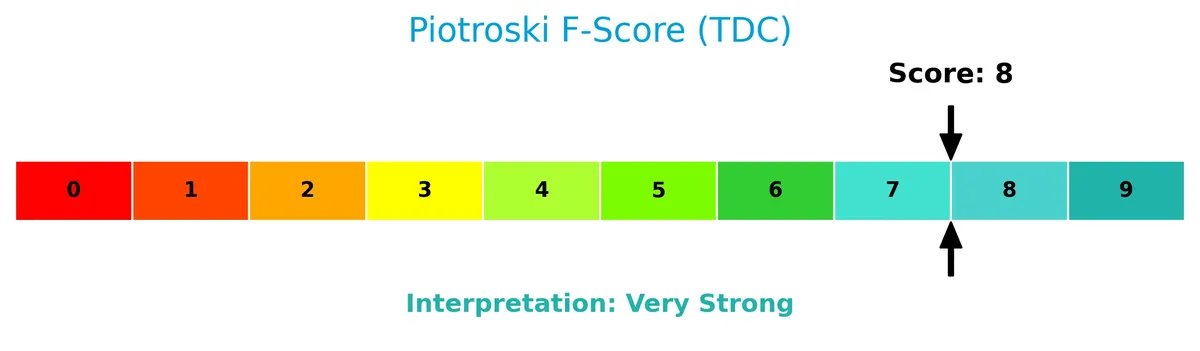
With a Piotroski Score of 8, Teradata demonstrates very strong financial fundamentals despite its leverage concerns, suggesting solid internal financial management.
Competitive Landscape & Sector Positioning
This sector analysis explores Teradata Corporation’s strategic positioning, revenue by segment, key products, and main competitors. I will assess whether Teradata holds a sustainable competitive advantage in the software infrastructure industry. This review includes competitive advantages and a SWOT analysis for comprehensive insight.
Strategic Positioning
Teradata concentrates on multi-cloud data platforms and analytics, with a product mix dominated by recurring services (1.17B in 2025) and subscription software (273M). Its geographic exposure is diversified across Americas (1.01B), EMEA (484M), and Asia Pacific Japan (255M), serving multiple industries globally.
Revenue by Segment
This pie chart illustrates Teradata Corporation’s revenue distribution across its main business segments for fiscal year 2025.
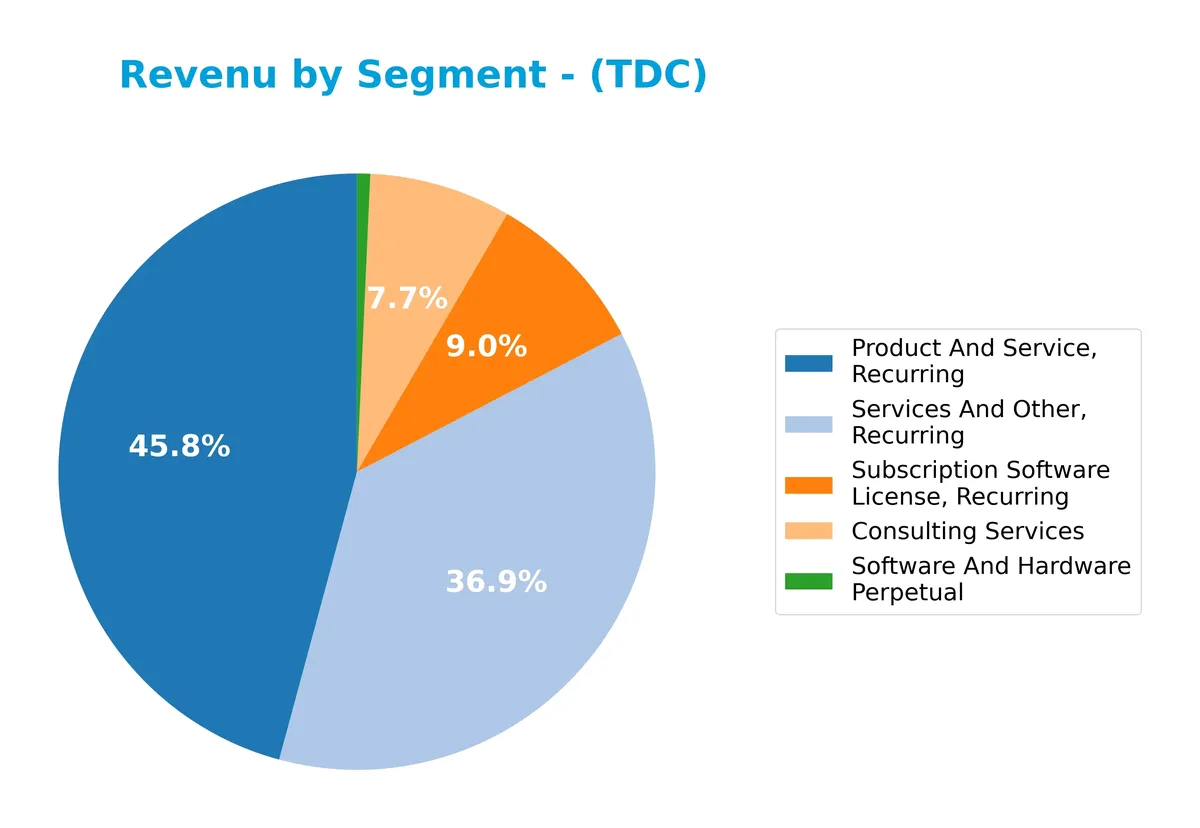
In 2025, “Services And Other, Recurring” dominates with $1.17B, reflecting Teradata’s strong focus on recurring revenue. “Subscription Software License, Recurring” contributes $273M, showing a modest decline from prior years. “Consulting Services” dropped to $201M, indicating some slowdown. The “Software and Hardware Perpetual” segment remains minimal at $17M, signaling a strategic shift away from traditional licensing models towards recurring services.
Key Products & Brands
The following table outlines Teradata Corporation’s main products and services with brief descriptions:
| Product | Description |
|---|---|
| Teradata Vantage | Connected multi-cloud data platform enabling enterprise-wide data analytics and ecosystem simplification. |
| Consulting Services | Support for data and analytic vision, operationalizing opportunities, and multi-cloud ecosystem architecture. |
| Services And Other, Recurring | Ongoing support and maintenance services facilitating platform reliability and customer success. |
| Subscription Software License | Recurring revenue from licensing of software primarily focused on analytics and data management. |
| Software and Hardware Perpetual | One-time sales of software and hardware products, representing a smaller revenue segment. |
Teradata’s portfolio centers on data analytics software and consulting, with a strong emphasis on recurring revenue streams from services and subscription licenses, reflecting its strategic shift to cloud-enabled solutions.
Main Competitors
Teradata Corporation faces competition from 32 companies in its sector, with the table below showing the top 10 leaders by market capitalization:
| Competitor | Market Cap. |
|---|---|
| Microsoft Corporation | 3.52T |
| Oracle Corporation | 553B |
| Palantir Technologies Inc. | 383B |
| Adobe Inc. | 140B |
| Palo Alto Networks, Inc. | 120B |
| CrowdStrike Holdings, Inc. | 113B |
| Synopsys, Inc. | 92B |
| Cloudflare, Inc. | 69B |
| Fortinet, Inc. | 59B |
| Block, Inc. | 40B |
Teradata ranks 29th among 32 competitors, with a market cap just 0.08% of Microsoft’s, the sector leader. It falls well below both the average top 10 market cap of $508B and the sector median of $18.8B. The company’s market cap is 30.4% lower than the next closest competitor above it, underscoring a significant scale gap.
Comparisons with competitors
Check out how we compare the company to its competitors:
Does Teradata have a competitive advantage?
Teradata presents a clear competitive advantage, demonstrated by a ROIC exceeding its WACC by nearly 11%, signaling strong value creation and efficient capital use. Its consistent growth in ROIC over 2021-2025 further confirms a sustainable and improving profitability trend.
Looking ahead, Teradata’s connected multi-cloud data platform and integrated migration services position it well to capitalize on expanding enterprise analytics demand. The company’s presence across diverse sectors and global regions supports opportunities for market growth and innovation.
SWOT Analysis
This analysis highlights Teradata Corporation’s key internal and external factors shaping its strategic outlook.
Strengths
- strong ROIC well above WACC
- growing ROIC trend signals value creation
- very favorable moat with sustainable competitive advantage
Weaknesses
- declining revenue over five years
- low current ratio signals liquidity risk
- high debt-to-equity ratio raises financial leverage concerns
Opportunities
- expanding multi-cloud analytics market
- increasing demand for data-driven decision making
- global footprint enables geographic growth
Threats
- intense competition in software infrastructure
- rapid technology changes require continuous innovation
- macroeconomic uncertainty may pressure IT budgets
Teradata’s robust profitability and moat offer a solid foundation. However, shrinking top-line and liquidity issues require cautious capital management. The company must leverage cloud trends and geographic reach while mitigating competitive and economic risks to sustain growth.
Stock Price Action Analysis
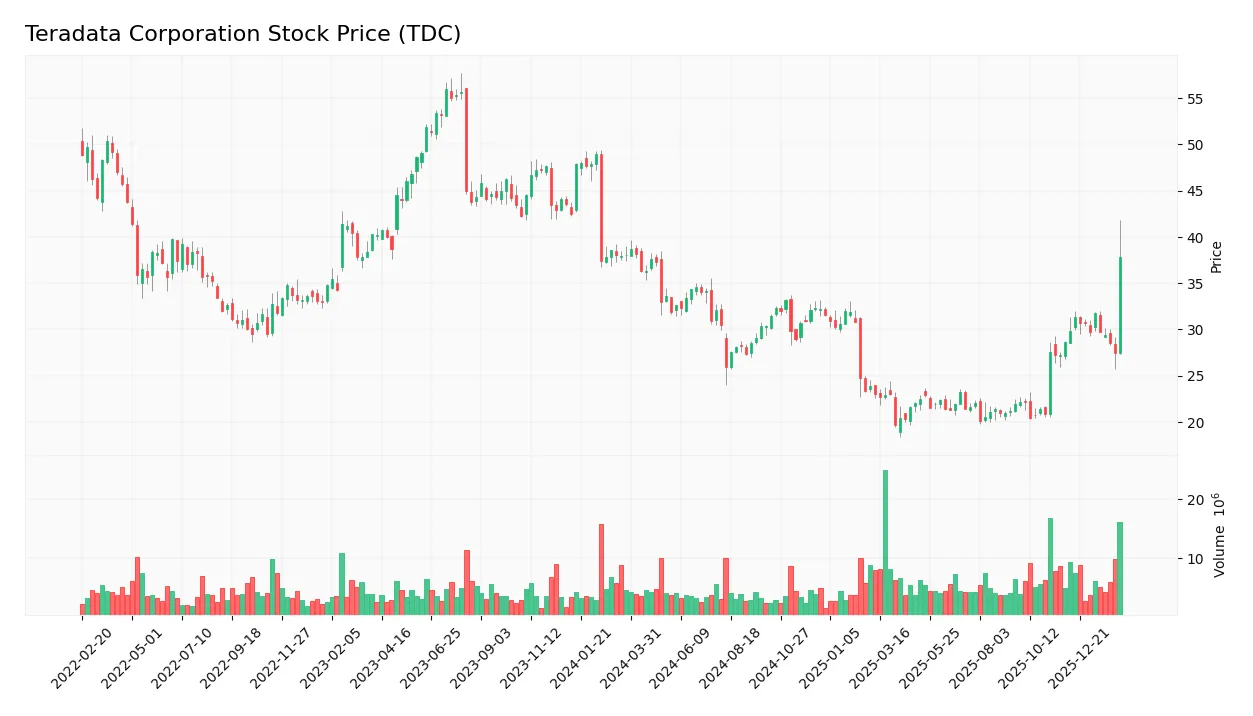
The weekly stock chart below illustrates Teradata Corporation’s price movements over the past year, highlighting notable highs and lows with recent trend shifts:
Trend Analysis
Over the past 12 months, Teradata’s stock price fell by 17.59%, marking a clear bearish trend with accelerating decline. The price ranged from a high of 38.21 to a low of 19.73. Volatility, measured by a 5.09 standard deviation, underscores significant price fluctuations during this period.
Volume Analysis
Trading volume increased over the last three months, totaling over 66M shares. Buyer volume slightly leads at 53.73%, indicating mild buyer dominance. This rising activity suggests growing market participation, but buyer behavior remains neutral with balanced buying and selling in recent weeks.
Target Prices
Analysts project a target price consensus that suggests moderate upside potential.
| Target Low | Target High | Consensus |
|---|---|---|
| 27 | 40 | 35 |
The range from 27 to 40 indicates a cautiously optimistic outlook, with consensus at 35 signaling expected growth potential.

Don’t Let Luck Decide Your Entry Point
Optimize your entry points with our advanced ProRealTime indicators. You’ll get efficient buy signals with precise price targets for maximum performance. Start outperforming now!
Analyst & Consumer Opinions
This section examines Teradata Corporation’s grades and consumer feedback to provide a balanced view of its market perception.
Stock Grades
Here is a summary of recent verified stock grades from recognized analysts for Teradata Corporation (TDC):
| Grading Company | Action | New Grade | Date |
|---|---|---|---|
| Citigroup | Maintain | Buy | 2026-02-12 |
| Evercore ISI Group | Maintain | Outperform | 2026-02-11 |
| RBC Capital | Maintain | Sector Perform | 2026-02-11 |
| Citizens | Maintain | Market Outperform | 2026-02-11 |
| Barclays | Maintain | Underweight | 2026-02-11 |
| Citigroup | Maintain | Buy | 2026-02-04 |
| Barclays | Maintain | Underweight | 2026-01-12 |
| RBC Capital | Maintain | Sector Perform | 2026-01-05 |
| Morgan Stanley | Maintain | Overweight | 2025-12-17 |
| Citizens | Upgrade | Market Outperform | 2025-11-10 |
The general trend shows a mix of positive and cautious stances, with several firms maintaining Buy or Outperform ratings, while Barclays consistently holds an Underweight view. This suggests a divergence in analyst sentiment, reflecting differing assessments of Teradata’s near-term prospects.
Consumer Opinions
Teradata Corporation sparks mixed feelings among users, reflecting its complex role in data analytics.
| Positive Reviews | Negative Reviews |
|---|---|
| Robust data processing capabilities impress users. | Some find the platform difficult to learn initially. |
| Strong customer support often praised for responsiveness. | Pricing perceived as high compared to competitors. |
| Scalable solutions suit large enterprise needs well. | Occasional software bugs disrupt workflow. |
Overall, consumers appreciate Teradata’s powerful analytics and responsive support. However, they flag a steep learning curve and premium costs as notable drawbacks.
Risk Analysis
Below is a summary table outlining key risks facing Teradata Corporation in 2026:
| Category | Description | Probability | Impact |
|---|---|---|---|
| Financial Health | Altman Z-Score in distress zone (0.87) signals high bankruptcy risk. | High | Severe |
| Leverage | Debt-to-equity ratio of 2.44 indicates heavy reliance on debt financing. | High | High |
| Liquidity | Current ratio below 1 (0.92) suggests potential short-term liquidity issues. | Medium | Medium |
| Valuation | Elevated price-to-book ratio (12.49) points to overvaluation risk. | Medium | Medium |
| Dividend Policy | No dividend yield reduces income appeal for yield-focused investors. | Low | Low |
| Market Volatility | Beta of 0.54 reflects lower stock volatility but may limit upside potential. | Low | Low |
Teradata’s most pressing risk is its financial distress as indicated by the Altman Z-Score below 1. This metric historically precedes bankruptcy in the software infrastructure sector. High leverage amplifies this risk, raising concern about debt servicing despite infinite interest coverage. Low liquidity compounds short-term funding risks. On the positive side, Teradata’s strong Piotroski score (8) shows operational resilience. Investors must weigh these risks carefully against the company’s growth prospects and sector benchmarks.
Should You Buy Teradata Corporation?
Teradata appears to be generating robust value creation with a durable competitive moat, evidenced by growing ROIC well above WACC. While debt metrics suggest a challenging leverage profile, the overall rating remains a solid B, reflecting a cautiously favorable investment case.
Strength & Efficiency Pillars
Teradata Corporation shows solid operational efficiency with a gross margin of 59.71% and an EBIT margin of 12.69%. Its return on equity (ROE) stands at a favorable 56.52%, while return on invested capital (ROIC) at 16.36% comfortably exceeds its weighted average cost of capital (WACC) of 5.48%. This gap confirms Teradata as a value creator. The company also benefits from a growing ROIC trend, indicating strengthening profitability and a sustainable competitive advantage.
Weaknesses and Drawbacks
Teradata is currently in the financial distress zone, as indicated by an Altman Z-Score of 0.87, signaling heightened bankruptcy risk. This solvency concern overshadows other metrics. The company’s leverage is high, with a debt-to-equity ratio of 2.44 and a weak current ratio at 0.92, suggesting liquidity pressures. Additionally, valuation multiples appear stretched, with a price-to-book ratio at 12.49, which could deter value-focused investors. Market trends remain bearish, adding short-term headwinds despite neutral recent buyer dominance.
Our Final Verdict about Teradata Corporation
Despite Teradata’s operational strengths and clear value creation, the Altman Z-Score firmly places it in financial distress. This solvency risk makes the investment profile highly speculative and too risky for conservative capital. Investors should prioritize safety and consider Teradata only if comfortable with elevated bankruptcy risk, regardless of improving margins or positive ROIC trends.
Disclaimer: This content is for informational purposes only and does not constitute financial, investment, or other professional advice. Investing in financial markets involves a significant risk of loss, and past performance is not indicative of future results.
Additional Resources
- Envestnet Asset Management Inc. Sells 47,219 Shares of Teradata Corporation $TDC – MarketBeat (Feb 28, 2026)
- Decoding Teradata Corp (TDC): A Strategic SWOT Insight – GuruFocus (Feb 28, 2026)
- AI and hybrid-cloud push defines Teradata (NYSE: TDC) 2025 annual report – Stock Titan (Feb 27, 2026)
- TERADATA CORP /DE/ SEC 10-K Report – TradingView (Feb 27, 2026)
- Why Are Teradata (TDC) Shares Soaring Today – Finviz (Feb 24, 2026)
For more information about Teradata Corporation, please visit the official website: teradata.com